Races in Creston-Bigfork, Montana (MT) Detailed Stats
Ancestries, Foreign-born residents, place of birth
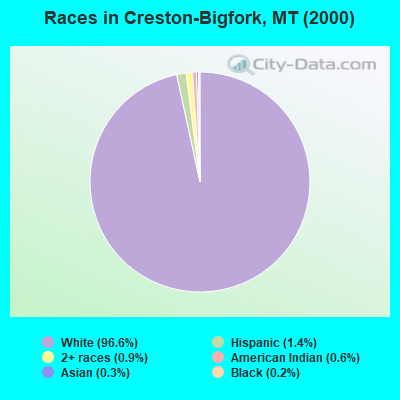
Race distribution in Creston-Bigfork

- 6,41996.6%White alone
- 951.4%Hispanic
- 570.9%Two or more races
- 370.6%American Indian alone
- 230.3%Asian alone
- 110.2%Black alone
- 30.05%Native Hawaiian and Other
Pacific Islander alone - 10.02%Other race alone
2000
2022
-
- 807,82389.5%White alone
- 54,4266.0%American Indian alone
- 18,0812.0%Hispanic
- 13,7681.5%Two or more races
- 4,5690.5%Asian alone
- 2,5340.3%Black alone
- 5690.06%Other race alone
- 4250.05%Native Hawaiian and Other
Pacific Islander alone

-
- 937,36583.5%White alone
- 58,7485.2%American Indian alone
- 55,1724.9%Two or more races
- 49,8304.4%Hispanic
- 9,0120.8%Other race alone
- 7,7000.7%Asian alone
- 3,4280.3%Black alone
- 1,6120.1%Native Hawaiian and Other
Pacific Islander alone

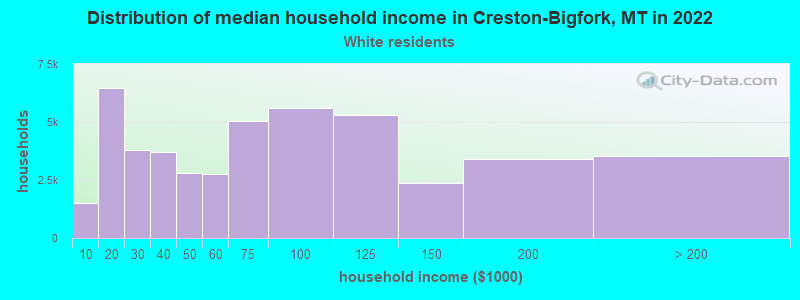
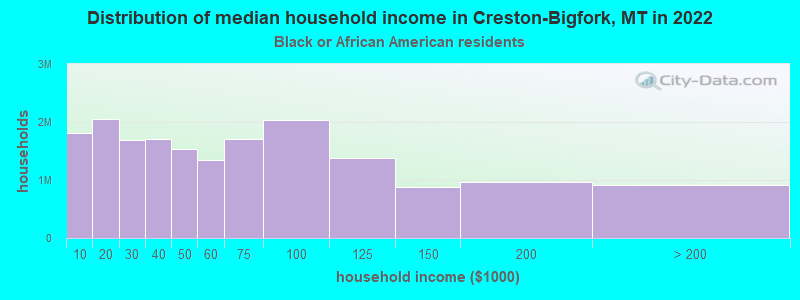
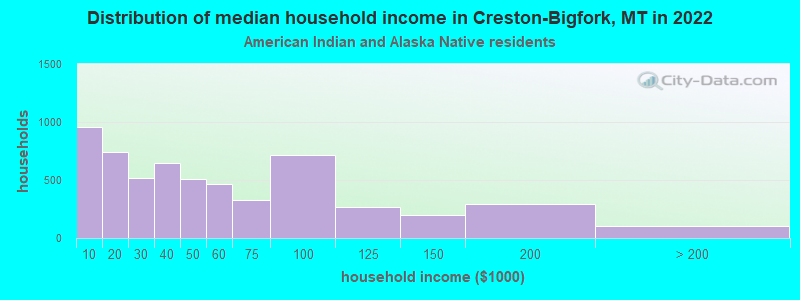
Income and house value in Creston-Bigfork
- Median household income in 2022
- $70,670White non-Hispanic householders
- $14,228American Indian and Alaska Native householders
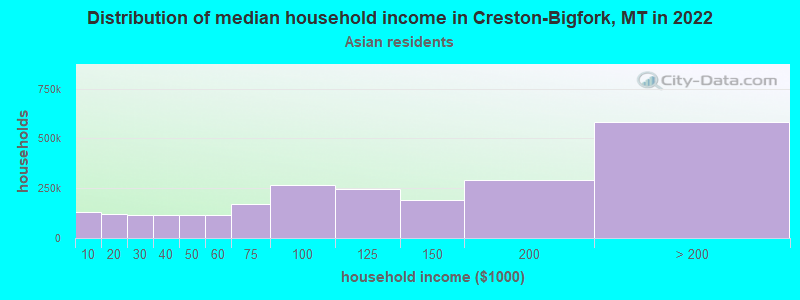
- $27,403Asian householders
- $74,912Two or more races householders
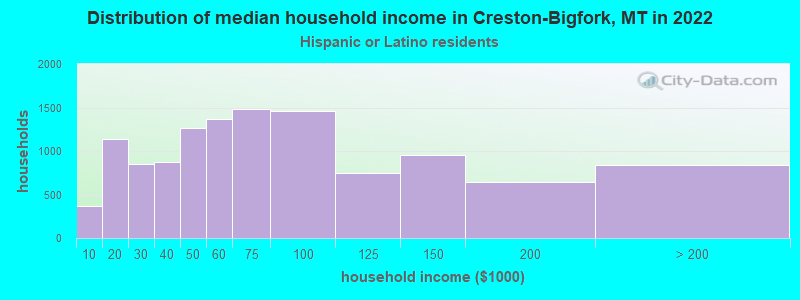
- $55,164Hispanic or Latino race householders
- Median 2022 house value
- $662,454White Non-Hispanic householders
- $295,130American Indian or Alaska Native householders
- $431,344Native Hawaiian and other Pacific Islander householders
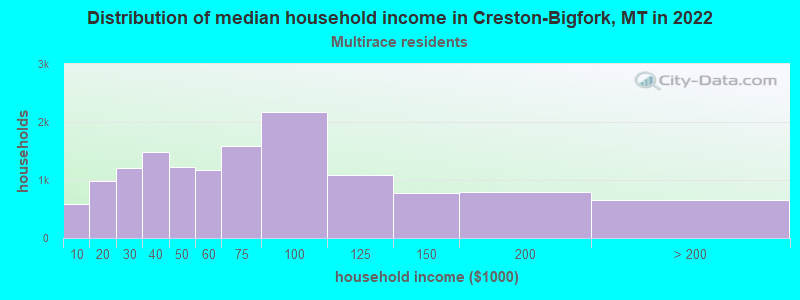
- $737,826Two or more races householders
- $624,314Hispanic or Latino householders
Household income for White non-Hispanic householders
Household income for Black householders
Household income for American Indian and Alaska Native householders
Household income for Asian householders
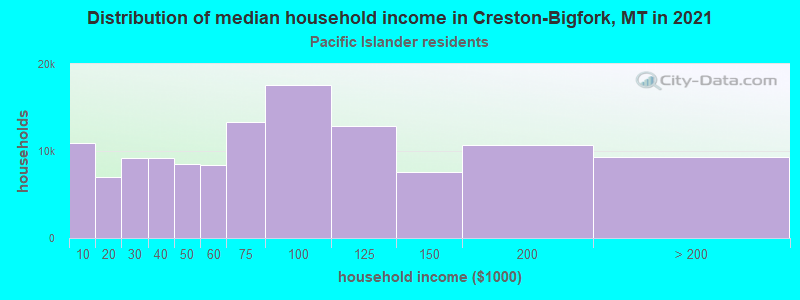
Household income for Native Hawaiian and other Pacific Islander householders
Household income for Two or more races householders
Household income for Hispanic or Latino race householders
Zip code: 59911