Races in Crow Reservation, Montana (MT) Detailed Stats
Ancestries, Foreign-born residents, place of birth
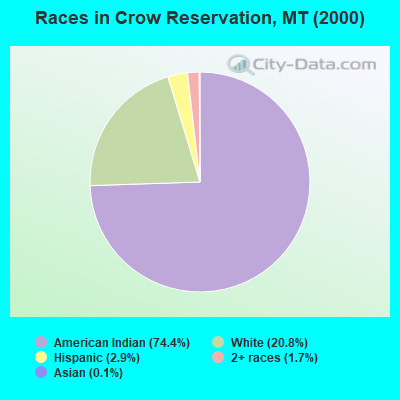
Race distribution in Crow Reservation

- 4,93274.4%American Indian alone
- 1,38020.8%White alone
- 1922.9%Hispanic
- 1151.7%Two or more races
- 70.1%Asian alone
2000
2022
-
- 807,82389.5%White alone
- 54,4266.0%American Indian alone
- 18,0812.0%Hispanic
- 13,7681.5%Two or more races
- 4,5690.5%Asian alone
- 2,5340.3%Black alone
- 5690.06%Other race alone
- 4250.05%Native Hawaiian and Other
Pacific Islander alone

-
- 937,36583.5%White alone
- 58,7485.2%American Indian alone
- 55,1724.9%Two or more races
- 49,8304.4%Hispanic
- 9,0120.8%Other race alone
- 7,7000.7%Asian alone
- 3,4280.3%Black alone
- 1,6120.1%Native Hawaiian and Other
Pacific Islander alone

Income and house value in Crow Reservation
- Median household income in 2022
- $48,922White non-Hispanic householders
- $43,893American Indian and Alaska Native householders
- $58,488Some other race householders
- $63,305Two or more races householders
- $67,502Hispanic or Latino race householders
- Median 2022 house value
- $194,960White Non-Hispanic householders
- $132,018American Indian or Alaska Native householders
- $88,765Some other race householders
- $236,599Two or more races householders
- $78,113Hispanic or Latino householders
Household income for White non-Hispanic householders

Household income for American Indian and Alaska Native householders

Household income for Two or more races householders

Household income for Hispanic or Latino race householders
