Races in Dacula-Rocky Creek, Georgia (GA) Detailed Stats
Ancestries, Foreign-born residents, place of birth
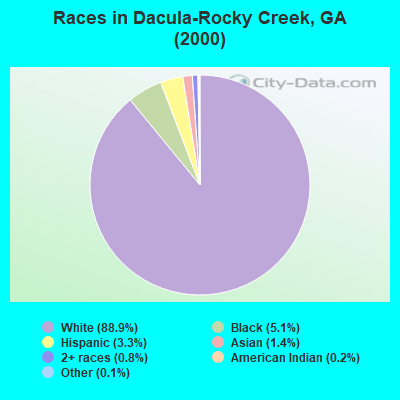
Race distribution in Dacula-Rocky Creek

- 35,36588.9%White alone
- 2,0445.1%Black alone
- 1,3323.3%Hispanic
- 5751.4%Asian alone
- 3230.8%Two or more races
- 760.2%American Indian alone
- 430.1%Other race alone
- 140.04%Native Hawaiian and Other
Pacific Islander alone
2000
2022
-
- 5,128,66162.6%White alone
- 2,331,46528.5%Black alone
- 435,2275.3%Hispanic
- 171,5132.1%Asian alone
- 87,3641.1%Two or more races
- 17,6700.2%American Indian alone
- 11,2750.1%Other race alone
- 3,2780.04%Native Hawaiian and Other
Pacific Islander alone

-
- 5,415,65749.6%White alone
- 3,349,24030.7%Black alone
- 1,132,60410.4%Hispanic
- 479,1564.4%Asian alone
- 462,9234.2%Two or more races
- 54,4160.5%Other race alone
- 11,9230.1%American Indian alone
- 6,9570.06%Native Hawaiian and Other
Pacific Islander alone

Income and house value in Dacula-Rocky Creek
- Median household income in 2022
- $100,017White non-Hispanic householders
- $89,423Black householders
- $70,240American Indian and Alaska Native householders
- $102,385Asian householders
- $94,033Some other race householders
- $104,952Two or more races householders
- $95,577Hispanic or Latino race householders
- Median 2022 house value
- $400,432White Non-Hispanic householders
- $403,689Black or African American householders
- $373,284American Indian or Alaska Native householders
- $377,084Asian householders
- $345,050Some other race householders
- $419,164Two or more races householders
- $398,260Hispanic or Latino householders
Household income for White non-Hispanic householders

Household income for Black householders

Household income for American Indian and Alaska Native householders

Household income for Asian householders

Household income for Two or more races householders

Household income for Hispanic or Latino race householders

Zip code: 30019