Races in Dalton, Georgia (GA) Detailed Stats
Data:
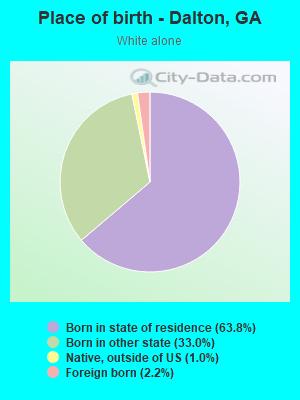
Races - White alone (%)
Races - White alone (% change since 2000)
Races - Black alone (%)
Races - Black alone (% change since 2000)
Races - American Indian alone (%)
Races - American Indian alone (% change since 2000)
Races - Asian alone (%)
Races - Asian alone (% change since 2000)
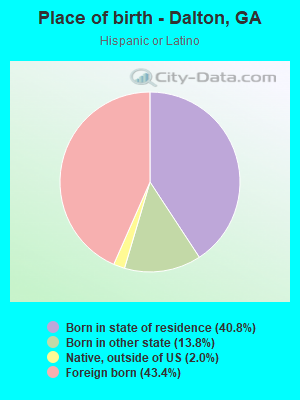
Races - Hispanic (%)
Races - Hispanic (% change since 2000)
Races - Native Hawaiian and Other Pacific Islander alone (%)
Races - Native Hawaiian and Other Pacific Islander alone (% change since 2000)
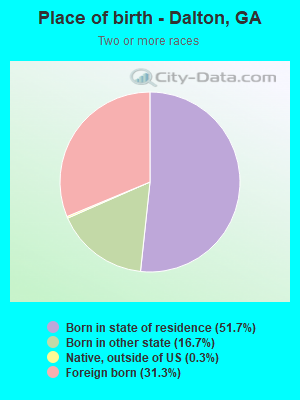
Races - Two or more races(%)
Races - Two or more races(% change since 2000)
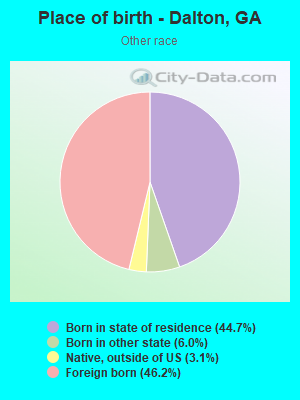
Races - Other race alone (%)
Races - Other race alone (% change since 2000)
Racial diversity
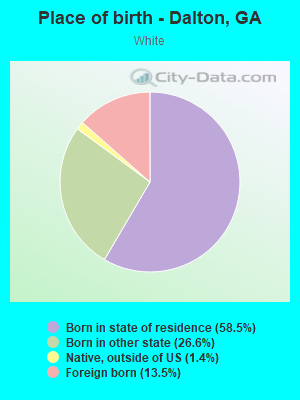
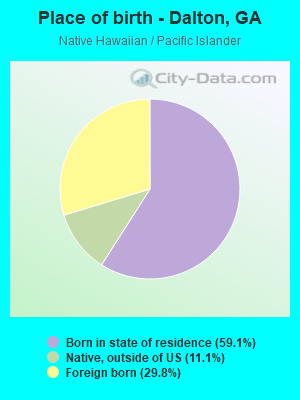
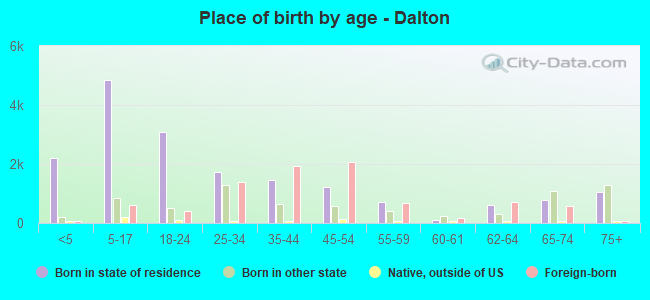
Place of birth - Born in state of residence (%)
Place of birth - Born in state of residence (%) - White
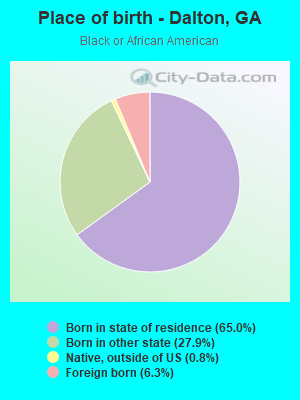
Place of birth - Born in state of residence (%) - Black or African American
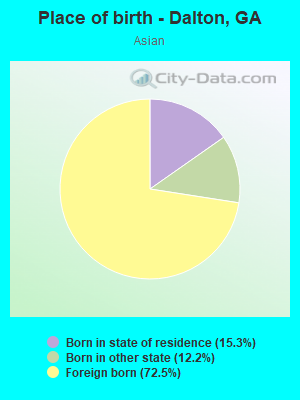
Place of birth - Born in state of residence (%) - Asian
Place of birth - Born in state of residence (%) - Hispanic or Latino
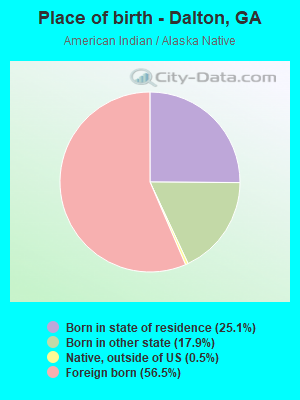
Place of birth - Born in state of residence (%) - American Indian and Alaska Native
Place of birth - Born in state of residence (%) - Multirace
Place of birth - Born in state of residence (%) - Other Race
Place of birth - Born in other state (%)
Place of birth - Born in other state (%) - White
Place of birth - Born in other state (%) - Black or African American
Place of birth - Born in other state (%) - Asian
Place of birth - Born in other state (%) - Hispanic or Latino
Place of birth - Born in other state (%) - American Indian and Alaska Native
Place of birth - Born in other state (%) - Multirace
Place of birth - Born in other state (%) - Other Race
Place of birth - Native, outside of US (%)
Place of birth - Native, outside of US (%) - White
Place of birth - Native, outside of US (%) - Black or African American
Place of birth - Native, outside of US (%) - Asian
Place of birth - Native, outside of US (%) - Hispanic or Latino
Place of birth - Native, outside of US (%) - American Indian and Alaska Native
Place of birth - Native, outside of US (%) - Multirace
Place of birth - Native, outside of US (%) - Other Race
Place of birth - Foreign born (%)
Place of birth - Foreign born (%) - White
Place of birth - Foreign born (%) - Black or African American
Place of birth - Foreign born (%) - Asian
Place of birth - Foreign born (%) - Hispanic or Latino
Place of birth - Foreign born (%) - American Indian and Alaska Native
Place of birth - Foreign born (%) - Multirace
Place of birth - Foreign born (%) - Other Race
Residents speaking English at home (%)
Residents speaking English at home - Born in the United States (%)
Residents speaking English at home - Native, born elsewhere (%)
Residents speaking English at home - Foreign born (%)
Residents speaking Spanish at home (%)
Residents speaking Spanish at home - Born in the United States (%)
Residents speaking Spanish at home - Native, born elsewhere (%)
Residents speaking Spanish at home - Foreign born (%)
Residents speaking other language at home (%)
Residents speaking other language at home - Born in the United States (%)
Residents speaking other language at home - Native, born elsewhere (%)
Residents speaking other language at home - Foreign born (%)
Marital status - Never married (%)
Marital status - Now married (%)
Marital status - Separated (%)
Marital status - Widowed (%)
Marital status - Divorced (%)
Ancestries Reported - Arab (%)
Ancestries Reported - Czech (%)
Ancestries Reported - Danish (%)
Ancestries Reported - Dutch (%)
Ancestries Reported - English (%)
Ancestries Reported - French (%)
Ancestries Reported - French Canadian (%)
Ancestries Reported - German (%)
Ancestries Reported - Greek (%)
Ancestries Reported - Hungarian (%)
Ancestries Reported - Irish (%)
Ancestries Reported - Italian (%)
Ancestries Reported - Lithuanian (%)
Ancestries Reported - Norwegian (%)
Ancestries Reported - Polish (%)
Ancestries Reported - Portuguese (%)
Ancestries Reported - Russian (%)
Ancestries Reported - Scotch-Irish (%)
Ancestries Reported - Scottish (%)
Ancestries Reported - Slovak (%)
Ancestries Reported - Subsaharan African (%)
Ancestries Reported - Swedish (%)
Ancestries Reported - Swiss (%)
Ancestries Reported - Ukrainian (%)
Ancestries Reported - United States (%)
Ancestries Reported - Welsh (%)
Ancestries Reported - West Indian (%)
Ancestries Reported - Other (%)
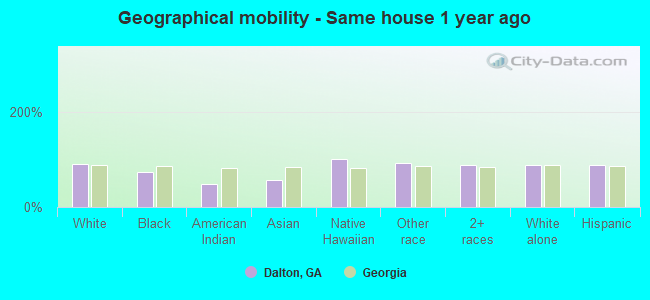
Geographical mobility - Same house 1 year ago (%)
Geographical mobility - Same house 1 year ago (%) - White
Geographical mobility - Same house 1 year ago (%) - Black or African American
Geographical mobility - Same house 1 year ago (%) - Asian
Geographical mobility - Same house 1 year ago (%) - Hispanic or Latino
Geographical mobility - Same house 1 year ago (%) - American Indian and Alaska Native
Geographical mobility - Same house 1 year ago (%) - Multirace
Geographical mobility - Same house 1 year ago (%) - Other Race
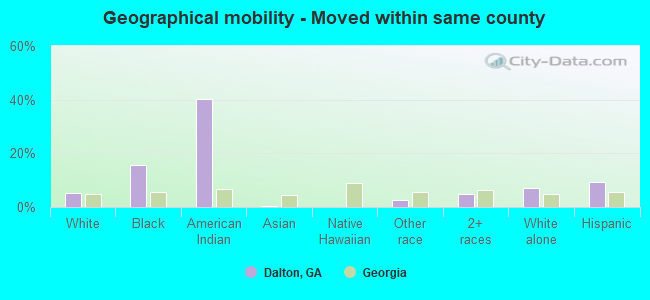
Geographical mobility - Moved within same county (%)
Geographical mobility - Moved within same county (%) - White
Geographical mobility - Moved within same county (%) - Black or African American
Geographical mobility - Moved within same county (%) - Asian
Geographical mobility - Moved within same county (%) - Hispanic or Latino
Geographical mobility - Moved within same county (%) - American Indian and Alaska Native
Geographical mobility - Moved within same county (%) - Multirace
Geographical mobility - Moved within same county (%) - Other Race
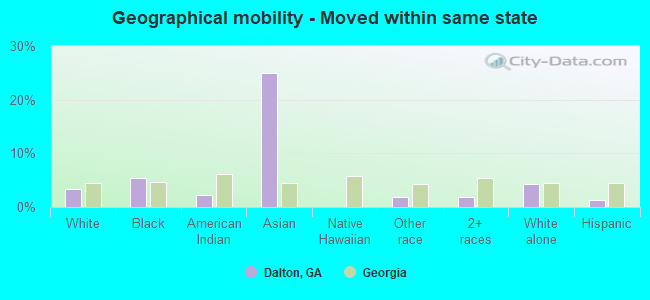
Geographical mobility - Moved from different county within same state (%)
Geographical mobility - Moved from different county within same state (%) - White
Geographical mobility - Moved from different county within same state (%) - Black or African American
Geographical mobility - Moved from different county within same state (%) - Asian
Geographical mobility - Moved from different county within same state (%) - Hispanic or Latino
Geographical mobility - Moved from different county within same state (%) - American Indian and Alaska Native
Geographical mobility - Moved from different county within same state (%) - Multirace
Geographical mobility - Moved from different county within same state (%) - Other Race
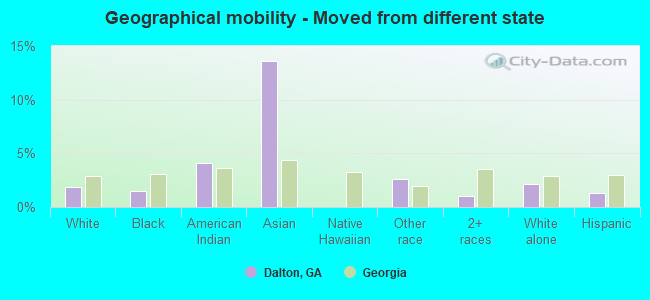
Geographical mobility - Moved from different state (%)
Geographical mobility - Moved from different state (%) - White
Geographical mobility - Moved from different state (%) - Black or African American
Geographical mobility - Moved from different state (%) - Asian
Geographical mobility - Moved from different state (%) - Hispanic or Latino
Geographical mobility - Moved from different state (%) - American Indian and Alaska Native
Geographical mobility - Moved from different state (%) - Multirace
Geographical mobility - Moved from different state (%) - Other Race
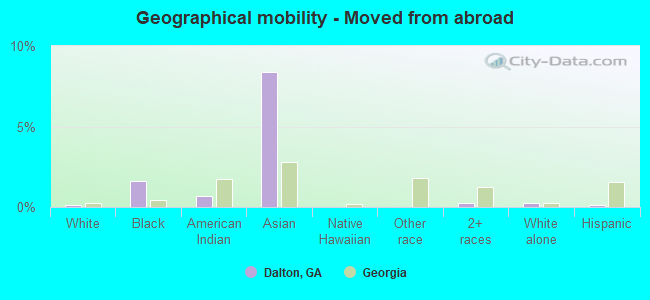
Geographical mobility - Moved from abroad (%)
Geographical mobility - Moved from abroad (%) - White
Geographical mobility - Moved from abroad (%) - Black or African American
Geographical mobility - Moved from abroad (%) - Asian
Geographical mobility - Moved from abroad (%) - Hispanic or Latino
Geographical mobility - Moved from abroad (%) - American Indian and Alaska Native
Geographical mobility - Moved from abroad (%) - Multirace
Geographical mobility - Moved from abroad (%) - Other Race
Place of birth for the foreign-born population - Ireland (%)
Place of birth for the foreign-born population - Denmark (%)
Place of birth for the foreign-born population - Norway (%)
Place of birth for the foreign-born population - Sweden (%)
Place of birth for the foreign-born population - United Kingdom (%)
Place of birth for the foreign-born population - England (%)
Place of birth for the foreign-born population - Scotland (%)
Place of birth for the foreign-born population - Other Northern Europe (%)
Place of birth for the foreign-born population - Austria (%)
Place of birth for the foreign-born population - Belgium (%)
Place of birth for the foreign-born population - France (%)
Place of birth for the foreign-born population - Germany (%)
Place of birth for the foreign-born population - Netherlands (%)
Place of birth for the foreign-born population - Switzerland (%)
Place of birth for the foreign-born population - Other Western Europe (%)
Place of birth for the foreign-born population - Greece (%)
Place of birth for the foreign-born population - Italy (%)
Place of birth for the foreign-born population - Portugal (%)
Place of birth for the foreign-born population - Spain (%)
Place of birth for the foreign-born population - Other Southern Europe (%)
Place of birth for the foreign-born population - Albania (%)
Place of birth for the foreign-born population - Belarus (%)
Place of birth for the foreign-born population - Bosnia and Herzegovina (%)
Place of birth for the foreign-born population - Bulgaria (%)
Place of birth for the foreign-born population - Croatia (%)
Place of birth for the foreign-born population - Czechoslovakia (%)
Place of birth for the foreign-born population - Hungary (%)
Place of birth for the foreign-born population - Latvia (%)
Place of birth for the foreign-born population - Lithuania (%)
Place of birth for the foreign-born population - North Macedonia (Macedonia) (%)
Place of birth for the foreign-born population - Moldova (%)
Place of birth for the foreign-born population - Poland (%)
Place of birth for the foreign-born population - Romania (%)
Place of birth for the foreign-born population - Russia (%)
Place of birth for the foreign-born population - Serbia (%)
Place of birth for the foreign-born population - Ukraine (%)
Place of birth for the foreign-born population - Other Eastern Europe (%)
Place of birth for the foreign-born population - China (%)
Place of birth for the foreign-born population - Hong Kong (%)
Place of birth for the foreign-born population - Taiwan (%)
Place of birth for the foreign-born population - Japan (%)
Place of birth for the foreign-born population - Korea (%)
Place of birth for the foreign-born population - Other Eastern Asia (%)
Place of birth for the foreign-born population - Afghanistan (%)
Place of birth for the foreign-born population - Bangladesh (%)
Place of birth for the foreign-born population - India (%)
Place of birth for the foreign-born population - Iran (%)
Place of birth for the foreign-born population - Kazakhstan (%)
Place of birth for the foreign-born population - Nepal (%)
Place of birth for the foreign-born population - Pakistan (%)
Place of birth for the foreign-born population - Sri Lanka (%)
Place of birth for the foreign-born population - Uzbekistan (%)
Place of birth for the foreign-born population - Other South Central Asia (%)
Place of birth for the foreign-born population - Burma (%)
Place of birth for the foreign-born population - Cambodia (%)
Place of birth for the foreign-born population - Indonesia (%)
Place of birth for the foreign-born population - Laos (%)
Place of birth for the foreign-born population - Malaysia (%)
Place of birth for the foreign-born population - Philippines (%)
Place of birth for the foreign-born population - Singapore (%)
Place of birth for the foreign-born population - Thailand (%)
Place of birth for the foreign-born population - Vietnam (%)
Place of birth for the foreign-born population - Other South Eastern Asia (%)
Place of birth for the foreign-born population - Armenia (%)
Place of birth for the foreign-born population - Iraq (%)
Place of birth for the foreign-born population - Israel (%)
Place of birth for the foreign-born population - Jordan (%)
Place of birth for the foreign-born population - Kuwait (%)
Place of birth for the foreign-born population - Lebanon (%)
Place of birth for the foreign-born population - Saudi Arabia (%)
Place of birth for the foreign-born population - Syria (%)
Place of birth for the foreign-born population - Turkey (%)
Place of birth for the foreign-born population - Yemen (%)
Place of birth for the foreign-born population - Other Western Asia (%)
Place of birth for the foreign-born population - Eritrea (%)
Place of birth for the foreign-born population - Ethiopia (%)
Place of birth for the foreign-born population - Kenya (%)
Place of birth for the foreign-born population - Somalia (%)
Place of birth for the foreign-born population - Uganda (%)
Place of birth for the foreign-born population - Zimbabwe (%)
Place of birth for the foreign-born population - Other Eastern Africa (%)
Place of birth for the foreign-born population - Cameroon (%)
Place of birth for the foreign-born population - Congo (%)
Place of birth for the foreign-born population - Democratic Republic of Congo (Zaire) (%)
Place of birth for the foreign-born population - Other Middle Africa (%)
Place of birth for the foreign-born population - Egypt (%)
Place of birth for the foreign-born population - Morocco (%)
Place of birth for the foreign-born population - Sudan (%)
Place of birth for the foreign-born population - Other Northern Africa (%)
Place of birth for the foreign-born population - South Africa (%)
Place of birth for the foreign-born population - Other Southern Africa (%)
Place of birth for the foreign-born population - Cabo Verde (%)
Place of birth for the foreign-born population - Ghana (%)
Place of birth for the foreign-born population - Liberia (%)
Place of birth for the foreign-born population - Nigeria (%)
Place of birth for the foreign-born population - Senegal (%)
Place of birth for the foreign-born population - Sierra Leone (%)
Place of birth for the foreign-born population - Other Western Africa (%)
Place of birth for the foreign-born population - Australia (%)
Place of birth for the foreign-born population - New Zealand (%)
Place of birth for the foreign-born population - Fiji (%)
Place of birth for the foreign-born population - Micronesia (%)
Place of birth for the foreign-born population - Bahamas (%)
Place of birth for the foreign-born population - Barbados (%)
Place of birth for the foreign-born population - Cuba (%)
Place of birth for the foreign-born population - Dominica (%)
Place of birth for the foreign-born population - Dominican Republic (%)
Place of birth for the foreign-born population - Grenada (%)
Place of birth for the foreign-born population - Haiti (%)
Place of birth for the foreign-born population - Jamaica (%)
Place of birth for the foreign-born population - St. Vincent and the Grenadines (%)
Place of birth for the foreign-born population - Trinidad and Tobago (%)
Place of birth for the foreign-born population - West Indies (%)
Place of birth for the foreign-born population - Other Caribbean (%)
Place of birth for the foreign-born population - Belize (%)
Place of birth for the foreign-born population - Costa Rica (%)
Place of birth for the foreign-born population - El Salvador (%)
Place of birth for the foreign-born population - Guatemala (%)
Place of birth for the foreign-born population - Honduras (%)
Place of birth for the foreign-born population - Mexico (%)
Place of birth for the foreign-born population - Nicaragua (%)
Place of birth for the foreign-born population - Panama (%)
Place of birth for the foreign-born population - Other Central America (%)
Place of birth for the foreign-born population - Argentina (%)
Place of birth for the foreign-born population - Bolivia (%)
Place of birth for the foreign-born population - Brazil (%)
Place of birth for the foreign-born population - Chile (%)
Place of birth for the foreign-born population - Colombia (%)
Place of birth for the foreign-born population - Ecuador (%)
Place of birth for the foreign-born population - Guyana (%)
Place of birth for the foreign-born population - Peru (%)
Place of birth for the foreign-born population - Uruguay (%)
Place of birth for the foreign-born population - Venezuela (%)
Place of birth for the foreign-born population - Other South America (%)
Place of birth for the foreign-born population - Canada (%)
Place of birth for the foreign-born population - Other Northern America (%)
Place of birth for the foreign-born population - Other (%)
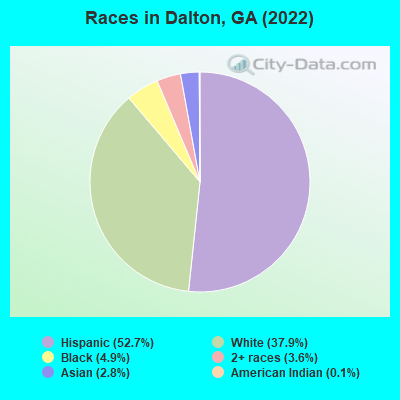
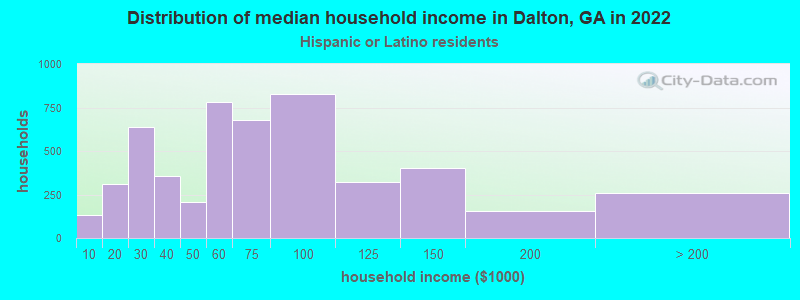
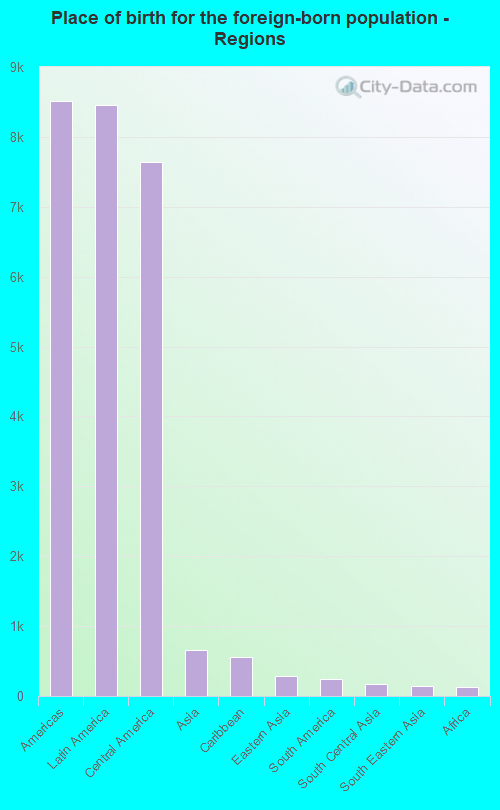
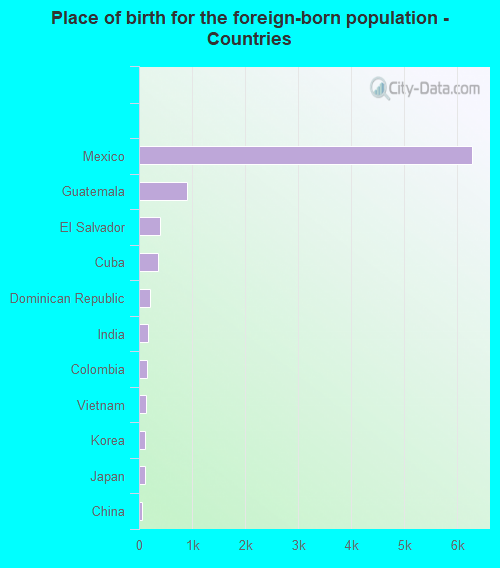
According to 2022 data, the most numerous races in Dalton, GA are White alone (13,020 residents), Black alone (1,695 residents), and Hispanic (18,141 residents). 54.8% of Dalton residents speak English at home. 27.3% of Dalton, GA residents are foreign-born (23.6% born in Latin America), which is 63.3% greater than the foreign-born rate of 10.0% across the entire state of Georgia.
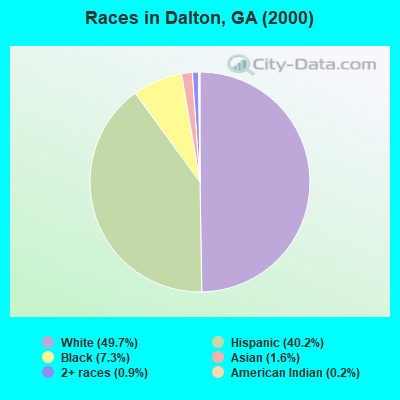
Race distribution in Dalton
2000 2022
5,128,661 62.6% White alone 2,331,465 28.5% Black alone 435,227 5.3% Hispanic 171,513 2.1% Asian alone 87,364 1.1% Two or more races 17,670 0.2% American Indian alone 11,275 0.1% Other race alone 3,278 0.04% Native Hawaiian and Other
5,415,657 49.6% White alone 3,349,240 30.7% Black alone 1,132,604 10.4% Hispanic 479,156 4.4% Asian alone 462,923 4.2% Two or more races 54,416 0.5% Other race alone 11,923 0.1% American Indian alone 6,957 0.06% Native Hawaiian and Other
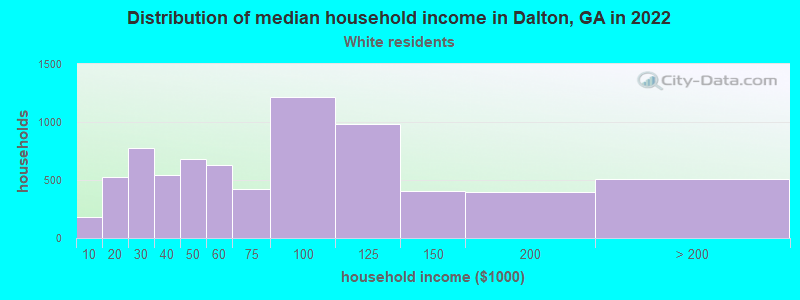
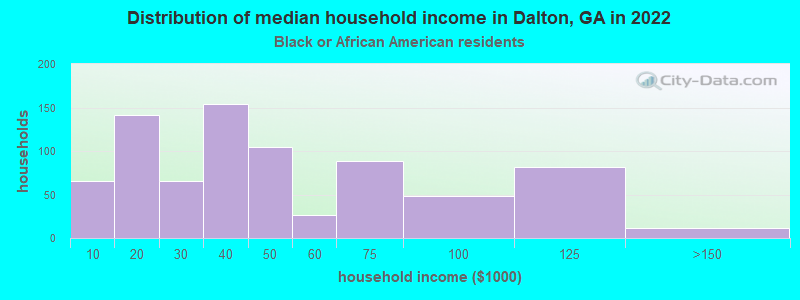
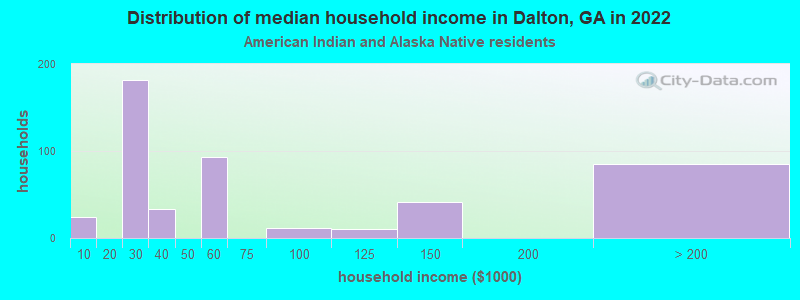
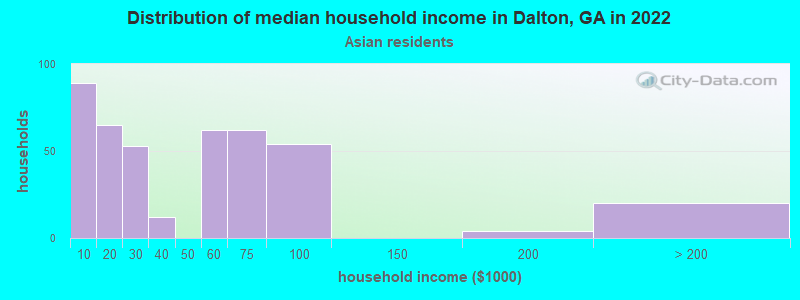
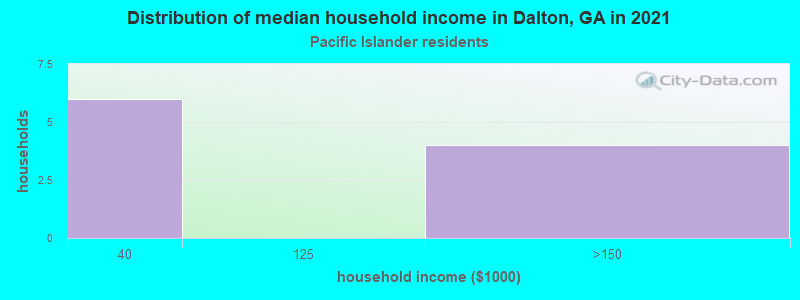
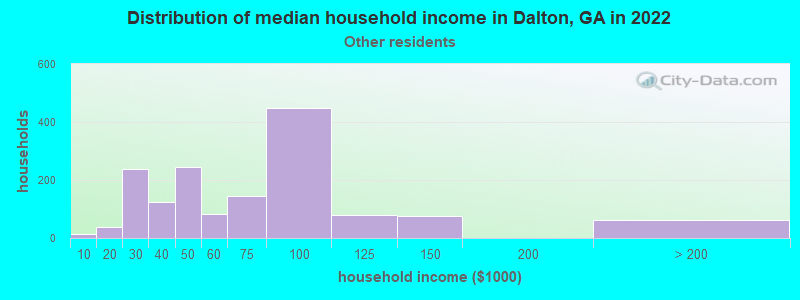
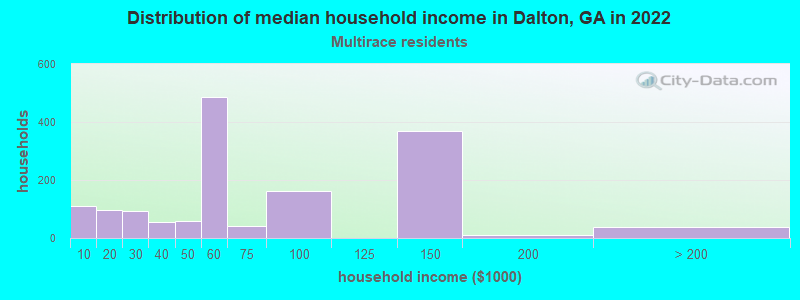
Income and house value in Dalton Median household income in 2022 $70,763 White non-Hispanic householders$28,402 Black householders$58,798 Some other race householders$43,747 Two or more races householders$56,848 Hispanic or Latino race householdersMedian 2022 house value $261,097 White Non-Hispanic householders$144,786 Black or African American householders$186,185 American Indian or Alaska Native householders $383,323 Asian householders$148,948 Some other race householders$180,928 Two or more races householders$147,415 Hispanic or Latino householders
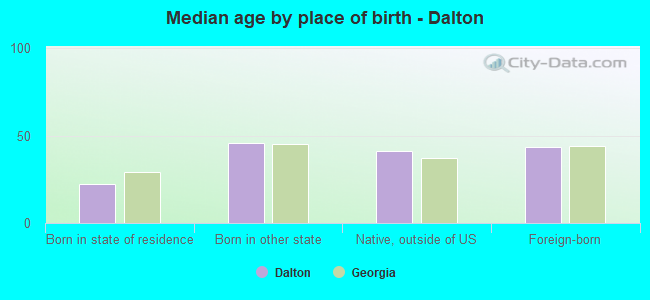
Median age by race in Dalton
40.5 Median age for White residents37.2 44.1 39.2 Median age for Black or African American residents40.6 34.9 23.1 Median age for American Indian / Alaska Native residents26.2 23.4 60.5 Median age for Asian residents40.1 50.7 17.6 Median age for Native Hawaiian / Pacific Islander residents-666,666,666.0 60.8 25.1 Median age for Other race residents27.2 20.6 27.2 Median age for Two or more races residents27.5 23.5 47.6 Median age for White alone residents41.6 50.6 26.4 Median age for Hispanic or Latino residents27.8 23.3
Owner/renter occupied households by race in Dalton
House owners and renters - White residents 3,744 52.8% Owner occupied3,351 47.2% Renter occupiedHouse owners and renters - Black or African American residents 402 38.1% Owner occupied653 61.9% Renter occupiedHouse owners and renters - American Indian / Alaska Native residents 279 60.8% Owner occupied180 39.2% Renter occupiedHouse owners and renters - Asian residents 238 57.7% Owner occupied174 42.3% Renter occupiedHouse owners and renters - Native Hawaiian / Pacific Islander residents 8 58.0% Owner occupied6 42.0% Renter occupiedHouse owners and renters - Other race residents 925 58.0% Owner occupied669 42.0% Renter occupiedHouse owners and renters - Two or more races residents 681 46.4% Owner occupied788 53.6% Renter occupiedHouse owners and renters - White alone residents 3,211 54.5% Owner occupied2,682 45.5% Renter occupiedHouse owners and renters - Hispanic or Latino residents 2,139 39.4% Owner occupied3,290 60.6% Renter occupied
Language usage in Dalton
English speakers - Total 54.8% of residents of Dalton speak English at home.
44.3% of residents speak Spanish at home 7,710 54.3% Speak English very well6,483 45.7% Speak English less than very well1.7% of residents speak other language at home 263 49.7% Speak English very well266 50.3% Speak English less than very well
English speakers - Born in the United States 79.7% of residents of Dalton speak English at home.
21.0% of residents speak Spanish at home 1,398 94.6% Speak English very well80 5.4% Speak English less than very well0.8% of residents speak other language at home 48 81.4% Speak English very well11 18.6% Speak English less than very well
English speakers - Native, born elsewhere 43.0% of residents of Dalton speak English at home.
55.5% of residents speak Spanish at home 271 79.2% Speak English very well71 20.8% Speak English less than very well
English speakers - Foreign-born 9.7% of residents of Dalton speak English at home.
83.6% of residents speak Spanish at home 2,031 28.8% Speak English very well5,029 71.2% Speak English less than very well5.7% of residents speak other language at home 264 55.1% Speak English very well215 44.9% Speak English less than very well
White (Caucasian) - Speak only English Native:
88.3% (12,744)Foreign-born:
21.4% (505)
White (Caucasian) - Speak another language Native:
13.9% (2,005)Foreign-born:
74.9% (1,769)
Black or African American - Speak only English Native:
98.8% (1,645)Foreign-born:
73.6% (67)
Black or African American - Speak another language Native:
1.0% (17)Foreign-born:
25.2% (23)
American Indian / Alaska Native - Speak only English Native:
21.2% (324)Foreign-born:
9.7% (120)
American Indian / Alaska Native - Speak another language Native:
48.3% (740)Foreign-born:
90.3% (1,121)
Asian - Speak only English Native:
18.2% (25)Foreign-born:
20.7% (148)
Asian - Speak another language Native:
84.1% (114)Foreign-born:
78.2% (557)
Native Hawaiian / Pacific Islander - Speak another language Native:
100.0% (19)Foreign-born:
100.0% (9)
Other race - Speak only English Native:
12.2% (562)Foreign-born:
7.2% (305)
Other race - Speak another language Native:
87.5% (4,037)Foreign-born:
88.6% (3,756)
Two or more races - Speak only English Native:
51.1% (1,600)Foreign-born:
11.6% (229)
Two or more races - Speak another language Native:
49.0% (1,535)Foreign-born:
88.6% (1,750)
White alone - Speak only English Native:
99.8% (12,392)Foreign-born:
59.6% (92)
White alone - Speak another language Native:
0.3% (33)Foreign-born:
40.6% (63)
Hispanic or Latino - Speak only English Native:
22.0% (1,980)Foreign-born:
8.7% (678)
Hispanic or Latino - Speak another language Native:
78.6% (7,076)Foreign-born:
91.2% (7,097)
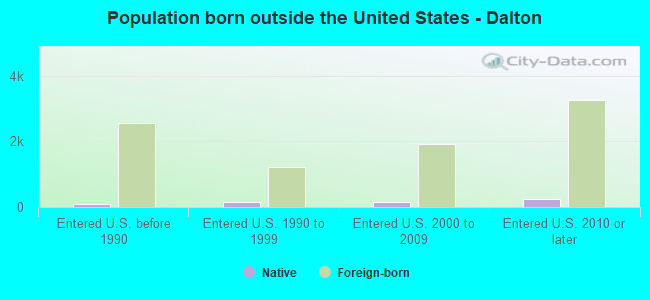
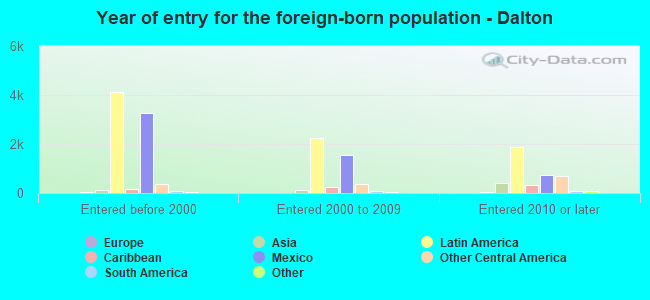
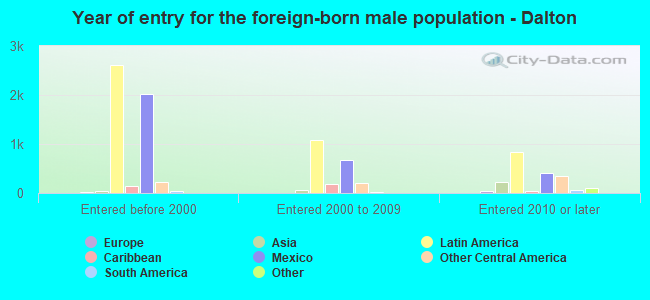
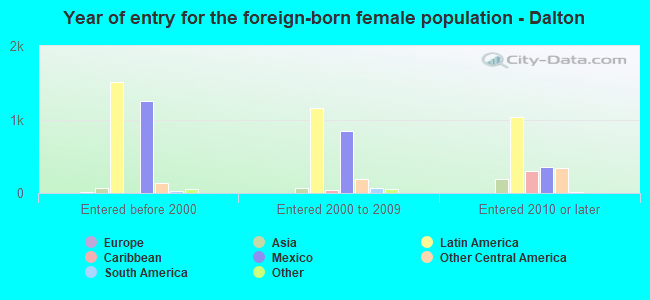
Foreign-born residents in Dalton 9,380 residents are foreign born (23.6% Latin America ).
This city:
27.3%Georgia:
10.4%
Marital status for residents in Dalton Marital status - White (Caucasian) population 15 years and over
Males 39.2% Never married44.5% Now married2.6% Separated5.3% Widowed8.4% DivorcedFemales 29.9% Never married39.3% Now married2.5% Separated13.2% Widowed15.2% DivorcedWomen who gave birth in the past 12 months Now married:
53.3% (107)Unmarried:
46.7% (94)
Women who did not give birth in the past 12 months Now married:
37.2% (1,328)Unmarried:
62.8% (2,242)
Marital status - Black or African American population 15 years and over
Males 53.9% Never married28.3% Now married0.0% Separated13.1% Widowed4.7% DivorcedFemales 46.1% Never married17.1% Now married0.0% Separated12.7% Widowed24.0% DivorcedWomen who did not give birth in the past 12 months Now married:
15.6% (70)Unmarried:
84.4% (379)
Marital status - American Indian / Alaska Native population 15 years and over
Males 58.7% Never married31.8% Now married0.0% Separated2.8% Widowed6.7% DivorcedFemales 54.2% Never married34.4% Now married11.4% Separated0.0% Widowed0.0% DivorcedWomen who gave birth in the past 12 months Now married:
100.0% (127)Unmarried:
0.0% (0)
Women who did not give birth in the past 12 months Now married:
40.7% (295)Unmarried:
59.3% (429)
Marital status - Asian population 15 years and over
Males 9.9% Never married90.1% Now married0.0% Separated0.0% Widowed0.0% DivorcedFemales 25.7% Never married66.8% Now married0.8% Separated0.0% Widowed6.8% DivorcedWomen who gave birth in the past 12 months Now married:
100.0% (57)Unmarried:
0.0% (0)
Women who did not give birth in the past 12 months Now married:
57.4% (173)Unmarried:
42.6% (128)
Marital status - Native Hawaiian / Pacific Islander population 15 years and over
Males 100.0% Never married0.0% Now married0.0% Separated0.0% Widowed0.0% DivorcedFemales 60.0% Never married40.0% Now married0.0% Separated0.0% Widowed0.0% DivorcedWomen who did not give birth in the past 12 months Now married:
0.0% (0)Unmarried:
100.0% (3)
Marital status - Other race population 15 years and over
Males 45.0% Never married47.4% Now married3.8% Separated0.0% Widowed3.9% DivorcedFemales 40.2% Never married35.7% Now married3.2% Separated6.5% Widowed14.5% DivorcedWomen who gave birth in the past 12 months Now married:
0.0% (0)Unmarried:
100.0% (146)
Women who did not give birth in the past 12 months Now married:
27.1% (584)Unmarried:
72.9% (1,568)
Marital status - Two or more races population 15 years and over
Males 39.1% Never married40.8% Now married17.8% Separated0.0% Widowed2.4% DivorcedFemales 45.3% Never married41.5% Now married3.6% Separated1.2% Widowed8.3% DivorcedWomen who gave birth in the past 12 months Now married:
0.0% (0)Unmarried:
100.0% (62)
Women who did not give birth in the past 12 months Now married:
41.2% (531)Unmarried:
58.8% (758)
Marital status - White alone, not Hispanic / Latino population 15 years and over
Males 38.9% Never married41.6% Now married2.0% Separated5.8% Widowed11.8% DivorcedFemales 24.3% Never married37.6% Now married2.9% Separated16.0% Widowed19.2% DivorcedWomen who gave birth in the past 12 months Now married:
66.2% (86)Unmarried:
33.8% (44)
Women who did not give birth in the past 12 months Now married:
34.6% (899)Unmarried:
65.4% (1,696)
Marital status - Hispanic or Latino population 15 years and over
Males 42.4% Never married46.4% Now married6.1% Separated2.2% Widowed2.9% DivorcedFemales 42.9% Never married40.9% Now married3.1% Separated5.0% Widowed8.2% DivorcedWomen who gave birth in the past 12 months Now married:
46.6% (136)Unmarried:
53.4% (156)
Women who did not give birth in the past 12 months Now married:
37.7% (1,662)Unmarried:
62.3% (2,742)
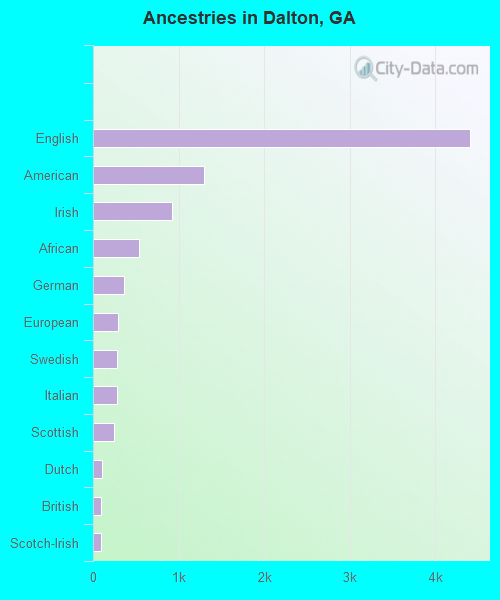
Ancestries in Dalton
4,406 17.7% English1,296 5.2% American923 3.7% Irish535 2.2% African364 1.5% German289 1.2% European283 1.1% Swedish276 1.1% Italian240 1.0% Scottish100 0.4% Dutch94 0.4% British88 0.4% Scotch-Irish35 0.1% Northern European29 0.1% Eastern European24 0.10% Welsh23 0.09% Turkish22 0.09% Nigerian21 0.08% Pennsylvania German16 0.06% Danish15 0.06% Polish11 0.04% Haitian9 0.04% French9 0.04% Hungarian
Geographical mobility in Dalton Same house 1 year ago 15,525 91.1% White (Caucasian)1,312 72.8% Black or African American1,063 48.0% American Indian / Alaska Native514 56.0% Asian32 100.0% Native Hawaiian / Pacific Islander5,704 92.4% Other race5,466 86.9% Two or more races11,304 87.5% White alone, not Hispanic / Latino15,521 86.6% Hispanic or LatinoMoved within same county 868 5.1% White / Caucasian284 15.8% Black or African American893 40.3% American Indian / Alaska Native4 0.5% Asian164 2.7% Other race314 5.0% Two or more races930 7.2% White alone, not Hispanic / Latino1,662 9.3% Hispanic or LatinoMoved within same state 564 3.3% White / Caucasian97 5.4% Black or African American51 2.3% American Indian / Alaska Native229 25.0% Asian117 1.9% Other race123 1.9% Two or more races558 4.3% White alone, not Hispanic / Latino219 1.2% Hispanic or LatinoMoved from different state 318 1.9% White / Caucasian27 1.5% Black or African American92 4.1% American Indian / Alaska Native125 13.6% Asian160 2.6% Other race63 1.0% Two or more races278 2.2% White alone, not Hispanic / Latino233 1.3% Hispanic or LatinoMoved from abroad 24 0.1% White29 1.6% Black or African American15 0.7% American Indian / Alaska Native77 8.4% Asian17 0.3% Two or more races29 0.2% White alone, not Hispanic / Latino22 0.1% Hispanic or Latino
Children Nativity (place of birth) in Dalton
Children under 6 years - Living with two parents Both parents native 544 100.0% NativeBoth parents foreign-born 441 94.6% Native25 5.4% Foreign-bornOne native, one foreign-born parent 500 100.0% NativeChildren under 6 years - Living with one parent Native parent 918 100.0% Native0 0.0% Foreign-bornForeign-born parent 176 97.5% Native5 2.5% Foreign-bornChildren 6 to 17 years - Living with two parents Both parents native 409 100.0% NativeBoth parents foreign-born 931 91.8% Native83 8.2% Foreign-bornOne native, one foreign-born parent 847 100.0% NativeChildren 6 to 17 years - Living with one parent Native parent 871 100.0% NativeForeign-born parent 2,273 54.5% Native1,901 45.5% Foreign-born
Grandparents responsible for own grandchildren in Dalton
Grandparents (30 to 59 years) White / Caucasian 10 17.2% Responsible for grandchildren47 82.8% Not responsible for grandchildrenAmerican Indian / Alaska Native 2 100.0% Responsible for grandchildrenOther race 56 100.0% Responsible for grandchildrenTwo or more races 25 100.0% Not responsible for grandchildrenWhite alone, not Hispanic / Latino 11 46.1% Responsible for grandchildren13 53.9% Not responsible for grandchildrenHispanic or Latino 56 53.4% Responsible for grandchildren49 46.6% Not responsible for grandchildrenGrandparents (60 years and over) White / Caucasian 78 27.7% Responsible for grandchildren204 72.3% Not responsible for grandchildrenAmerican Indian / Alaska Native 3 100.0% Not responsible for grandchildrenOther race 218 100.0% Not responsible for grandchildrenTwo or more races 24 19.2% Responsible for grandchildren100 80.8% Not responsible for grandchildrenWhite alone, not Hispanic / Latino 78 31.5% Responsible for grandchildren171 68.5% Not responsible for grandchildrenHispanic or Latino 443 100.0% Not responsible for grandchildren