Races in De Funiak Springs, Florida (FL) Detailed Stats
Ancestries, Foreign-born residents, place of birth

Recent posts about races in De Funiak Springs, Florida on our local forum with over 2,400,000 registered users:
 | Where Is The Best Place To Live In Florida For Work And Affordable Housing? (347 replies) |
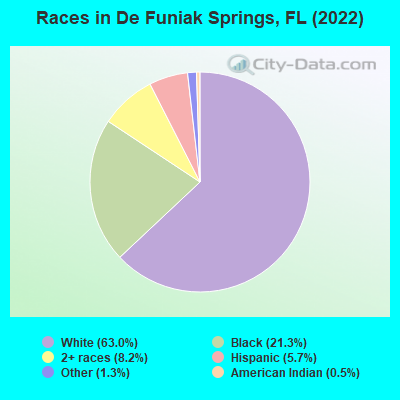
According to 2022 data, the most numerous races in De Funiak Springs, FL are White alone (3,932 residents), Hispanic (354 residents), and Black alone (1,328 residents). 96.2% of De Funiak Springs residents speak English at home. 3.8% of De Funiak Springs, FL residents are foreign-born (3.3% born in Latin America, 0.4% born in North America), which is 454.6% less than the foreign-born rate of 21.0% across the entire state of Florida.
Race distribution in De Funiak Springs
2000
2022

- 3,59470.6%White alone
- 1,16622.9%Black alone
- 1683.3%Hispanic
- 841.7%Two or more races
- 440.9%American Indian alone
- 260.5%Asian alone
- 40.08%Native Hawaiian and Other
Pacific Islander alone - 30.06%Other race alone

-
- 3,93263.0%White alone
- 1,32821.3%Black alone
- 5138.2%Two or more races
- 3545.7%Hispanic
- 831.3%Other race alone
- 310.5%American Indian alone
2000
2022
-
- 10,458,50965.4%White alone
- 2,682,71516.8%Hispanic
- 2,264,26814.2%Black alone
- 261,6931.6%Asian alone
- 236,9541.5%Two or more races
- 42,3580.3%American Indian alone
- 28,9940.2%Other race alone
- 6,8870.04%Native Hawaiian and Other
Pacific Islander alone

-
- 11,309,40350.8%White alone
- 6,025,03927.1%Hispanic
- 3,241,01514.6%Black alone
- 861,6303.9%Two or more races
- 623,6922.8%Asian alone
- 152,0540.7%Other race alone
- 22,5040.1%American Indian alone
- 9,4860.04%Native Hawaiian and Other
Pacific Islander alone

Income and house value in De Funiak Springs
- Median household income in 2022
- $58,424White non-Hispanic householders
- $37,252Black householders
- $126,649Hispanic or Latino race householders
- Median 2022 house value
- $202,858White Non-Hispanic householders
- $148,196Black or African American householders
- $207,414Two or more races householders
- $113,880Hispanic or Latino householders
Household income for White non-Hispanic householders

Household income for Black householders

Household income for American Indian and Alaska Native householders

Household income for Some other race householders

Household income for Two or more races householders

Household income for Hispanic or Latino race householders

Median age by race in De Funiak Springs
- 34.3Median age for White residents
- 33.9Males
- 37.3Females
- 49.0Median age for Black or African American residents
- 59.6Males
- 36.5Females
- 38.8Median age for American Indian / Alaska Native residents
- 36.6Males
- 64.0Females
- -614,929,785.0Median age for Asian residents
- -593,232,540.8Males
- -636,294,608.3Females
- -666,666,666.0Median age for Native Hawaiian / Pacific Islander residents
- -666,666,666.0Males
- -666,666,666.0Females
- 15.2Median age for Other race residents
- 39.6Males
- 14.7Females
- 21.3Median age for Two or more races residents
- 22.5Males
- 6.2Females
- 33.8Median age for White alone residents
- 32.6Males
- 37.1Females
- 32.4Median age for Hispanic or Latino residents
- 49.0Males
- 6.9Females
Owner/renter occupied households by race in De Funiak Springs
- House owners and renters - White residents
- 1,36473.2%Owner occupied
- 49826.8%Renter occupied
- House owners and renters - Black or African American residents
- 23231.0%Owner occupied
- 51669.0%Renter occupied
- House owners and renters - American Indian / Alaska Native residents
- 2935.5%Owner occupied
- 5364.5%Renter occupied
- House owners and renters - Other race residents
- 2249.5%Owner occupied
- 2350.5%Renter occupied
- House owners and renters - Two or more races residents
- 5468.3%Owner occupied
- 2531.7%Renter occupied
- House owners and renters - White alone residents
- 1,34372.1%Owner occupied
- 52027.9%Renter occupied
- House owners and renters - Hispanic or Latino residents
- 2517.0%Owner occupied
- 12383.0%Renter occupied
Language usage in De Funiak Springs
- English speakers - Total
- 96.2% of residents of De Funiak Springs speak English at home.
- 3.1% of residents speak Spanish at home
- 4324.0%Speak English very well
- 13676.0%Speak English less than very well
- 0.4% of residents speak other language at home
- 24100.0%Speak English very well
- English speakers - Born in the United States
- 99.4% of residents of De Funiak Springs speak English at home.
- 0.7% of residents speak other language at home
- 14100.0%Speak English very well
All residents speak only English at home
- English speakers - Foreign-born
- 24.0% of residents of De Funiak Springs speak English at home.
- 72.0% of residents speak Spanish at home
- 4323.9%Speak English very well
- 13776.1%Speak English less than very well
- 3.6% of residents speak other language at home
- 9100.0%Speak English very well
White (Caucasian) - Speak only English
| Native: | 99.4% (3,938) |
| Foreign-born: | 36.8% (21) |
White (Caucasian) - Speak another language
| Native: | 0.4% (16) |
| Foreign-born: | 65.6% (38) |
Black or African American - Speak only English
| Native: | 99.8% (1,243) |
| Foreign-born: | 97.0% (3) |
Other race - Speak only English
| Native: | 100.0% (69) |
| Foreign-born: | 64.2% (42) |
White alone - Speak only English
| Native: | 98.6% (3,912) |
| Foreign-born: | 59.1% (21) |
White alone - Speak another language
| Native: | 0.6% (25) |
| Foreign-born: | 34.3% (12) |
Hispanic or Latino - Speak only English
| Native: | 100.0% (94) |
| Foreign-born: | 8.1% (20) |
Foreign-born residents in De Funiak Springs
250 residents are foreign born (3.3% Latin America, 0.4% North America).
| This city: | 3.8% |
| Florida: | 21.1% |


Marital status for residents in De Funiak Springs
Marital status - White (Caucasian) population 15 years and over
- Males
- 28.2%Never married
- 48.6%Now married
- 3.1%Separated
- 6.1%Widowed
- 14.1%Divorced
- Females
- 21.2%Never married
- 44.1%Now married
- 2.3%Separated
- 13.2%Widowed
- 19.2%Divorced
Women who gave birth in the past 12 months
| Now married: | 33.3% (13) |
| Unmarried: | 66.7% (25) |
Women who did not give birth in the past 12 months
| Now married: | 50.1% (639) |
| Unmarried: | 49.9% (637) |
Marital status - Black or African American population 15 years and over
- Males
- 70.4%Never married
- 18.4%Now married
- 1.3%Separated
- 0.0%Widowed
- 9.9%Divorced
- Females
- 46.0%Never married
- 16.6%Now married
- 0.0%Separated
- 10.0%Widowed
- 27.4%Divorced
Women who gave birth in the past 12 months
| Now married: | 100.0% (33) |
| Unmarried: | 0.0% (0) |
Women who did not give birth in the past 12 months
| Now married: | 7.2% (25) |
| Unmarried: | 92.8% (319) |
Marital status - American Indian / Alaska Native population 15 years and over
- Males
- 42.6%Never married
- 57.4%Now married
- 0.0%Separated
- 0.0%Widowed
- 0.0%Divorced
- Females
- 0.0%Never married
- 36.7%Now married
- 0.0%Separated
- 63.3%Widowed
- 0.0%Divorced
Women who did not give birth in the past 12 months
| Now married: | 100.0% (7) |
| Unmarried: | 0.0% (0) |
Marital status - Other race population 15 years and over
- Males
- 30.2%Never married
- 69.8%Now married
- 0.0%Separated
- 0.0%Widowed
- 0.0%Divorced
- Females
- 0.0%Never married
- 100.0%Now married
- 0.0%Separated
- 0.0%Widowed
- 0.0%Divorced
Women who did not give birth in the past 12 months
| Now married: | 100.0% (23) |
| Unmarried: | 0.0% (0) |
Marital status - Two or more races population 15 years and over
- Males
- 67.8%Never married
- 19.2%Now married
- 9.3%Separated
- 0.0%Widowed
- 3.7%Divorced
- Females
- 0.0%Never married
- 60.0%Now married
- 0.0%Separated
- 24.0%Widowed
- 16.0%Divorced
Women who did not give birth in the past 12 months
| Now married: | 0.0% (0) |
| Unmarried: | 100.0% (6) |
Marital status - White alone, not Hispanic / Latino population 15 years and over
- Males
- 29.2%Never married
- 48.5%Now married
- 3.2%Separated
- 4.4%Widowed
- 14.7%Divorced
- Females
- 19.8%Never married
- 44.9%Now married
- 2.3%Separated
- 13.4%Widowed
- 19.5%Divorced
Women who gave birth in the past 12 months
| Now married: | 33.3% (13) |
| Unmarried: | 66.7% (26) |
Women who did not give birth in the past 12 months
| Now married: | 51.5% (659) |
| Unmarried: | 48.5% (620) |
Marital status - Hispanic or Latino population 15 years and over
- Males
- 27.8%Never married
- 54.5%Now married
- 0.0%Separated
- 13.6%Widowed
- 4.0%Divorced
- Females
- 57.6%Never married
- 32.2%Now married
- 0.0%Separated
- 10.2%Widowed
- 0.0%Divorced
Women who did not give birth in the past 12 months
| Now married: | 32.0% (17) |
| Unmarried: | 68.0% (35) |
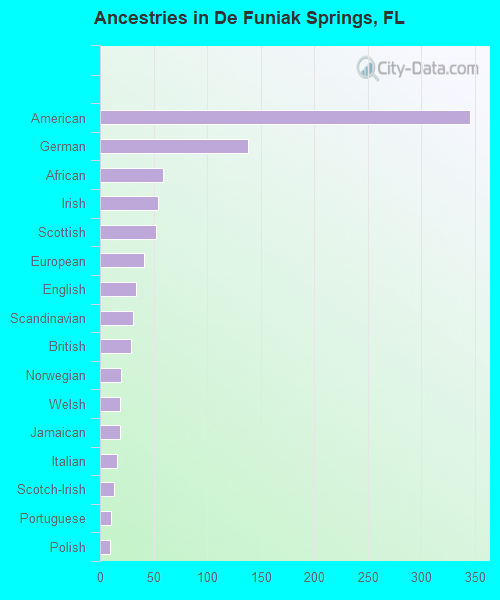
Ancestries in De Funiak Springs

- 34614.9%American
- 1385.9%German
- 592.5%African
- 542.3%Irish
- 522.2%Scottish
- 411.8%European
- 341.5%English
- 311.3%Scandinavian
- 291.2%British
- 200.9%Norwegian
- 190.8%Welsh
- 190.8%Jamaican
- 160.7%Italian
- 130.6%Scotch-Irish
- 100.4%Portuguese
- 90.4%Polish
Geographical mobility in De Funiak Springs

- Same house 1 year ago
- 3,30579.3%White (Caucasian)
- 1,321100.0%Black or African American
- 20182.5%American Indian / Alaska Native
- 180100.0%Other race
- 49474.6%Two or more races
- 3,30779.1%White alone, not Hispanic / Latino
- 26273.8%Hispanic or Latino

-
- Moved within same county
- 3498.4%White / Caucasian
- 171.3%Black or African American
- 243.6%Two or more races
- 3498.3%White alone, not Hispanic / Latino
- 174.8%Hispanic or Latino

-
- Moved within same state
- 2536.1%White / Caucasian
- 274.1%Two or more races
- 2666.4%White alone, not Hispanic / Latino

-
- Moved from different state
- 2275.5%White / Caucasian
- 60.4%Black or African American
- 11517.4%Two or more races
- 2285.4%White alone, not Hispanic / Latino
- 4913.9%Hispanic or Latino

-
- Moved from abroad
- 641.5%White
- 6325.7%American Indian / Alaska Native
- 641.5%White alone, not Hispanic / Latino
- 4612.9%Hispanic or Latino

Children Nativity (place of birth) in De Funiak Springs
Place of birth for residents in De Funiak Springs
![Place of birth for the foreign-born population - Regions]()
- 241Americas
- 214Latin America
- 187Central America
- 27Caribbean
- 26Northern America
- 9Europe
- 9Eastern Europe

![Place of birth for the foreign-born population - Countries]()
- 173Mexico
- 26Canada
- 13Guatemala
- 9Poland
- 6Cuba
- 3Jamaica
