Races in Delta, Colorado (CO) Detailed Stats
Data:
Races - White alone (%)
Races - White alone (% change since 2000)
Races - Black alone (%)
Races - Black alone (% change since 2000)
Races - American Indian alone (%)
Races - American Indian alone (% change since 2000)
Races - Asian alone (%)
Races - Asian alone (% change since 2000)
Races - Hispanic (%)
Races - Hispanic (% change since 2000)
Races - Native Hawaiian and Other Pacific Islander alone (%)
Races - Native Hawaiian and Other Pacific Islander alone (% change since 2000)
Races - Two or more races(%)
Races - Two or more races(% change since 2000)
Races - Other race alone (%)
Races - Other race alone (% change since 2000)
Racial diversity
Place of birth - Born in state of residence (%)
Place of birth - Born in state of residence (%) - White
Place of birth - Born in state of residence (%) - Black or African American
Place of birth - Born in state of residence (%) - Asian
Place of birth - Born in state of residence (%) - Hispanic or Latino
Place of birth - Born in state of residence (%) - American Indian and Alaska Native
Place of birth - Born in state of residence (%) - Multirace
Place of birth - Born in state of residence (%) - Other Race
Place of birth - Born in other state (%)
Place of birth - Born in other state (%) - White
Place of birth - Born in other state (%) - Black or African American
Place of birth - Born in other state (%) - Asian
Place of birth - Born in other state (%) - Hispanic or Latino
Place of birth - Born in other state (%) - American Indian and Alaska Native
Place of birth - Born in other state (%) - Multirace
Place of birth - Born in other state (%) - Other Race
Place of birth - Native, outside of US (%)
Place of birth - Native, outside of US (%) - White
Place of birth - Native, outside of US (%) - Black or African American
Place of birth - Native, outside of US (%) - Asian
Place of birth - Native, outside of US (%) - Hispanic or Latino
Place of birth - Native, outside of US (%) - American Indian and Alaska Native
Place of birth - Native, outside of US (%) - Multirace
Place of birth - Native, outside of US (%) - Other Race
Place of birth - Foreign born (%)
Place of birth - Foreign born (%) - White
Place of birth - Foreign born (%) - Black or African American
Place of birth - Foreign born (%) - Asian
Place of birth - Foreign born (%) - Hispanic or Latino
Place of birth - Foreign born (%) - American Indian and Alaska Native
Place of birth - Foreign born (%) - Multirace
Place of birth - Foreign born (%) - Other Race
Residents speaking English at home (%)
Residents speaking English at home - Born in the United States (%)
Residents speaking English at home - Native, born elsewhere (%)
Residents speaking English at home - Foreign born (%)
Residents speaking Spanish at home (%)
Residents speaking Spanish at home - Born in the United States (%)
Residents speaking Spanish at home - Native, born elsewhere (%)
Residents speaking Spanish at home - Foreign born (%)
Residents speaking other language at home (%)
Residents speaking other language at home - Born in the United States (%)
Residents speaking other language at home - Native, born elsewhere (%)
Residents speaking other language at home - Foreign born (%)
Marital status - Never married (%)
Marital status - Now married (%)
Marital status - Separated (%)
Marital status - Widowed (%)
Marital status - Divorced (%)
Ancestries Reported - Arab (%)
Ancestries Reported - Czech (%)
Ancestries Reported - Danish (%)
Ancestries Reported - Dutch (%)
Ancestries Reported - English (%)
Ancestries Reported - French (%)
Ancestries Reported - French Canadian (%)
Ancestries Reported - German (%)
Ancestries Reported - Greek (%)
Ancestries Reported - Hungarian (%)
Ancestries Reported - Irish (%)
Ancestries Reported - Italian (%)
Ancestries Reported - Lithuanian (%)
Ancestries Reported - Norwegian (%)
Ancestries Reported - Polish (%)
Ancestries Reported - Portuguese (%)
Ancestries Reported - Russian (%)
Ancestries Reported - Scotch-Irish (%)
Ancestries Reported - Scottish (%)
Ancestries Reported - Slovak (%)
Ancestries Reported - Subsaharan African (%)
Ancestries Reported - Swedish (%)
Ancestries Reported - Swiss (%)
Ancestries Reported - Ukrainian (%)
Ancestries Reported - United States (%)
Ancestries Reported - Welsh (%)
Ancestries Reported - West Indian (%)
Ancestries Reported - Other (%)
Geographical mobility - Same house 1 year ago (%)
Geographical mobility - Same house 1 year ago (%) - White
Geographical mobility - Same house 1 year ago (%) - Black or African American
Geographical mobility - Same house 1 year ago (%) - Asian
Geographical mobility - Same house 1 year ago (%) - Hispanic or Latino
Geographical mobility - Same house 1 year ago (%) - American Indian and Alaska Native
Geographical mobility - Same house 1 year ago (%) - Multirace
Geographical mobility - Same house 1 year ago (%) - Other Race
Geographical mobility - Moved within same county (%)
Geographical mobility - Moved within same county (%) - White
Geographical mobility - Moved within same county (%) - Black or African American
Geographical mobility - Moved within same county (%) - Asian
Geographical mobility - Moved within same county (%) - Hispanic or Latino
Geographical mobility - Moved within same county (%) - American Indian and Alaska Native
Geographical mobility - Moved within same county (%) - Multirace
Geographical mobility - Moved within same county (%) - Other Race
Geographical mobility - Moved from different county within same state (%)
Geographical mobility - Moved from different county within same state (%) - White
Geographical mobility - Moved from different county within same state (%) - Black or African American
Geographical mobility - Moved from different county within same state (%) - Asian
Geographical mobility - Moved from different county within same state (%) - Hispanic or Latino
Geographical mobility - Moved from different county within same state (%) - American Indian and Alaska Native
Geographical mobility - Moved from different county within same state (%) - Multirace
Geographical mobility - Moved from different county within same state (%) - Other Race
Geographical mobility - Moved from different state (%)
Geographical mobility - Moved from different state (%) - White
Geographical mobility - Moved from different state (%) - Black or African American
Geographical mobility - Moved from different state (%) - Asian
Geographical mobility - Moved from different state (%) - Hispanic or Latino
Geographical mobility - Moved from different state (%) - American Indian and Alaska Native
Geographical mobility - Moved from different state (%) - Multirace
Geographical mobility - Moved from different state (%) - Other Race
Geographical mobility - Moved from abroad (%)
Geographical mobility - Moved from abroad (%) - White
Geographical mobility - Moved from abroad (%) - Black or African American
Geographical mobility - Moved from abroad (%) - Asian
Geographical mobility - Moved from abroad (%) - Hispanic or Latino
Geographical mobility - Moved from abroad (%) - American Indian and Alaska Native
Geographical mobility - Moved from abroad (%) - Multirace
Geographical mobility - Moved from abroad (%) - Other Race
Place of birth for the foreign-born population - Ireland (%)
Place of birth for the foreign-born population - Denmark (%)
Place of birth for the foreign-born population - Norway (%)
Place of birth for the foreign-born population - Sweden (%)
Place of birth for the foreign-born population - United Kingdom (%)
Place of birth for the foreign-born population - England (%)
Place of birth for the foreign-born population - Scotland (%)
Place of birth for the foreign-born population - Other Northern Europe (%)
Place of birth for the foreign-born population - Austria (%)
Place of birth for the foreign-born population - Belgium (%)
Place of birth for the foreign-born population - France (%)
Place of birth for the foreign-born population - Germany (%)
Place of birth for the foreign-born population - Netherlands (%)
Place of birth for the foreign-born population - Switzerland (%)
Place of birth for the foreign-born population - Other Western Europe (%)
Place of birth for the foreign-born population - Greece (%)
Place of birth for the foreign-born population - Italy (%)
Place of birth for the foreign-born population - Portugal (%)
Place of birth for the foreign-born population - Spain (%)
Place of birth for the foreign-born population - Other Southern Europe (%)
Place of birth for the foreign-born population - Albania (%)
Place of birth for the foreign-born population - Belarus (%)
Place of birth for the foreign-born population - Bosnia and Herzegovina (%)
Place of birth for the foreign-born population - Bulgaria (%)
Place of birth for the foreign-born population - Croatia (%)
Place of birth for the foreign-born population - Czechoslovakia (%)
Place of birth for the foreign-born population - Hungary (%)
Place of birth for the foreign-born population - Latvia (%)
Place of birth for the foreign-born population - Lithuania (%)
Place of birth for the foreign-born population - North Macedonia (Macedonia) (%)
Place of birth for the foreign-born population - Moldova (%)
Place of birth for the foreign-born population - Poland (%)
Place of birth for the foreign-born population - Romania (%)
Place of birth for the foreign-born population - Russia (%)
Place of birth for the foreign-born population - Serbia (%)
Place of birth for the foreign-born population - Ukraine (%)
Place of birth for the foreign-born population - Other Eastern Europe (%)
Place of birth for the foreign-born population - China (%)
Place of birth for the foreign-born population - Hong Kong (%)
Place of birth for the foreign-born population - Taiwan (%)
Place of birth for the foreign-born population - Japan (%)
Place of birth for the foreign-born population - Korea (%)
Place of birth for the foreign-born population - Other Eastern Asia (%)
Place of birth for the foreign-born population - Afghanistan (%)
Place of birth for the foreign-born population - Bangladesh (%)
Place of birth for the foreign-born population - India (%)
Place of birth for the foreign-born population - Iran (%)
Place of birth for the foreign-born population - Kazakhstan (%)
Place of birth for the foreign-born population - Nepal (%)
Place of birth for the foreign-born population - Pakistan (%)
Place of birth for the foreign-born population - Sri Lanka (%)
Place of birth for the foreign-born population - Uzbekistan (%)
Place of birth for the foreign-born population - Other South Central Asia (%)
Place of birth for the foreign-born population - Burma (%)
Place of birth for the foreign-born population - Cambodia (%)
Place of birth for the foreign-born population - Indonesia (%)
Place of birth for the foreign-born population - Laos (%)
Place of birth for the foreign-born population - Malaysia (%)
Place of birth for the foreign-born population - Philippines (%)
Place of birth for the foreign-born population - Singapore (%)
Place of birth for the foreign-born population - Thailand (%)
Place of birth for the foreign-born population - Vietnam (%)
Place of birth for the foreign-born population - Other South Eastern Asia (%)
Place of birth for the foreign-born population - Armenia (%)
Place of birth for the foreign-born population - Iraq (%)
Place of birth for the foreign-born population - Israel (%)
Place of birth for the foreign-born population - Jordan (%)
Place of birth for the foreign-born population - Kuwait (%)
Place of birth for the foreign-born population - Lebanon (%)
Place of birth for the foreign-born population - Saudi Arabia (%)
Place of birth for the foreign-born population - Syria (%)
Place of birth for the foreign-born population - Turkey (%)
Place of birth for the foreign-born population - Yemen (%)
Place of birth for the foreign-born population - Other Western Asia (%)
Place of birth for the foreign-born population - Eritrea (%)
Place of birth for the foreign-born population - Ethiopia (%)
Place of birth for the foreign-born population - Kenya (%)
Place of birth for the foreign-born population - Somalia (%)
Place of birth for the foreign-born population - Uganda (%)
Place of birth for the foreign-born population - Zimbabwe (%)
Place of birth for the foreign-born population - Other Eastern Africa (%)
Place of birth for the foreign-born population - Cameroon (%)
Place of birth for the foreign-born population - Congo (%)
Place of birth for the foreign-born population - Democratic Republic of Congo (Zaire) (%)
Place of birth for the foreign-born population - Other Middle Africa (%)
Place of birth for the foreign-born population - Egypt (%)
Place of birth for the foreign-born population - Morocco (%)
Place of birth for the foreign-born population - Sudan (%)
Place of birth for the foreign-born population - Other Northern Africa (%)
Place of birth for the foreign-born population - South Africa (%)
Place of birth for the foreign-born population - Other Southern Africa (%)
Place of birth for the foreign-born population - Cabo Verde (%)
Place of birth for the foreign-born population - Ghana (%)
Place of birth for the foreign-born population - Liberia (%)
Place of birth for the foreign-born population - Nigeria (%)
Place of birth for the foreign-born population - Senegal (%)
Place of birth for the foreign-born population - Sierra Leone (%)
Place of birth for the foreign-born population - Other Western Africa (%)
Place of birth for the foreign-born population - Australia (%)
Place of birth for the foreign-born population - New Zealand (%)
Place of birth for the foreign-born population - Fiji (%)
Place of birth for the foreign-born population - Micronesia (%)
Place of birth for the foreign-born population - Bahamas (%)
Place of birth for the foreign-born population - Barbados (%)
Place of birth for the foreign-born population - Cuba (%)
Place of birth for the foreign-born population - Dominica (%)
Place of birth for the foreign-born population - Dominican Republic (%)
Place of birth for the foreign-born population - Grenada (%)
Place of birth for the foreign-born population - Haiti (%)
Place of birth for the foreign-born population - Jamaica (%)
Place of birth for the foreign-born population - St. Vincent and the Grenadines (%)
Place of birth for the foreign-born population - Trinidad and Tobago (%)
Place of birth for the foreign-born population - West Indies (%)
Place of birth for the foreign-born population - Other Caribbean (%)
Place of birth for the foreign-born population - Belize (%)
Place of birth for the foreign-born population - Costa Rica (%)
Place of birth for the foreign-born population - El Salvador (%)
Place of birth for the foreign-born population - Guatemala (%)
Place of birth for the foreign-born population - Honduras (%)
Place of birth for the foreign-born population - Mexico (%)
Place of birth for the foreign-born population - Nicaragua (%)
Place of birth for the foreign-born population - Panama (%)
Place of birth for the foreign-born population - Other Central America (%)
Place of birth for the foreign-born population - Argentina (%)
Place of birth for the foreign-born population - Bolivia (%)
Place of birth for the foreign-born population - Brazil (%)
Place of birth for the foreign-born population - Chile (%)
Place of birth for the foreign-born population - Colombia (%)
Place of birth for the foreign-born population - Ecuador (%)
Place of birth for the foreign-born population - Guyana (%)
Place of birth for the foreign-born population - Peru (%)
Place of birth for the foreign-born population - Uruguay (%)
Place of birth for the foreign-born population - Venezuela (%)
Place of birth for the foreign-born population - Other South America (%)
Place of birth for the foreign-born population - Canada (%)
Place of birth for the foreign-born population - Other Northern America (%)
Place of birth for the foreign-born population - Other (%)
Latest news about races in Delta, CO collected exclusively by city-data.com from local newspapers, TV, and radio stations
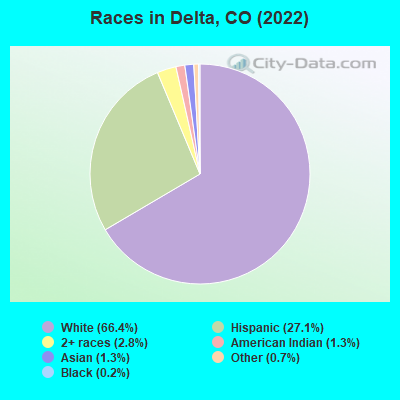
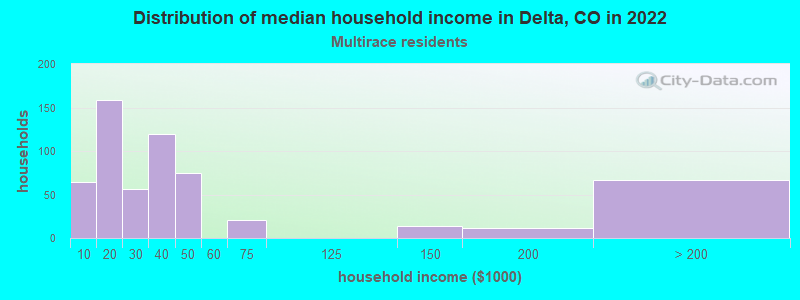
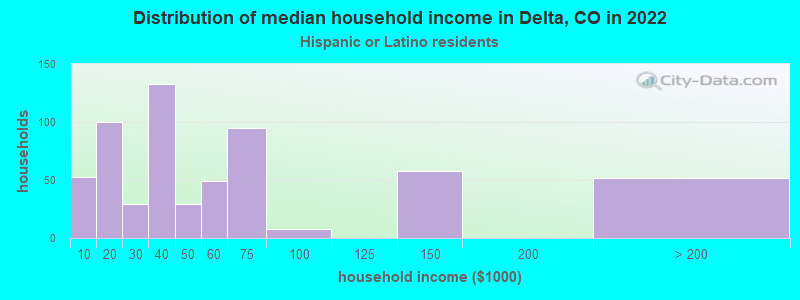
According to 2022 data, the most numerous races in Delta, CO are White alone (6,419 residents), Hispanic (2,192 residents), and Two or more races (340 residents). 86.2% of Delta residents speak English at home. 4.9% of Delta, CO residents are foreign-born (3.3% born in Latin America, 1.4% born in Asia), which is 84.8% less than the foreign-born rate of 9.0% across the entire state of Colorado.
Race distribution in Delta
2000 2022
3,202,880 74.5% White alone 735,601 17.1% Hispanic 158,443 3.7% Black alone 93,277 2.2% Asian alone 72,721 1.7% Two or more races 28,982 0.7% American Indian alone 5,512 0.1% Other race alone 3,845 0.09% Native Hawaiian and Other
3,793,270 65.0% White alone 1,314,962 22.5% Hispanic 268,754 4.6% Two or more races 220,756 3.8% Black alone 182,658 3.1% Asian alone 29,798 0.5% Other race alone 23,389 0.4% American Indian alone 6,339 0.1% Native Hawaiian and Other
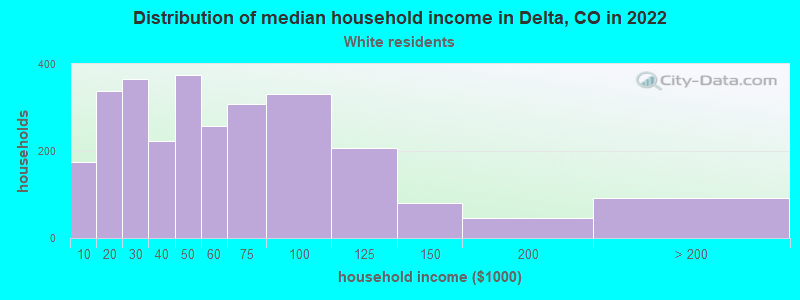
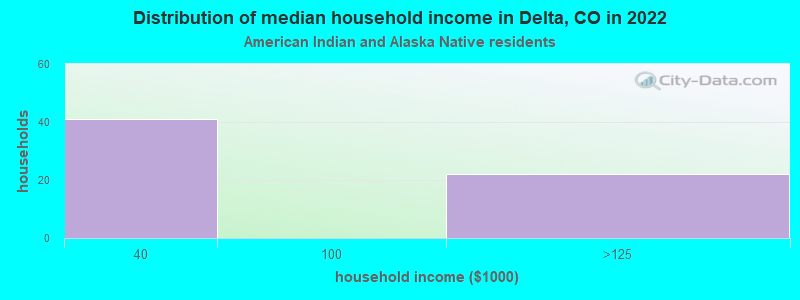
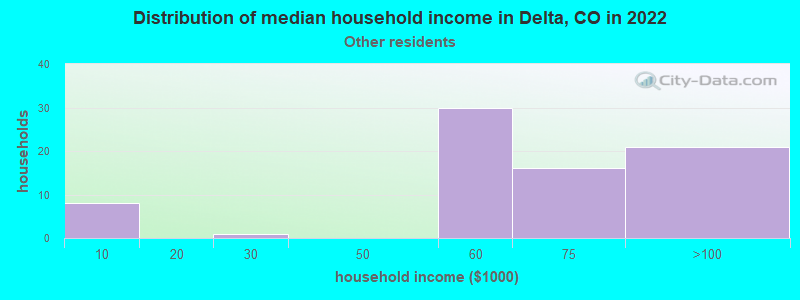
Income and house value in Delta Median household income in 2022 $55,033 White non-Hispanic householders$73,760 American Indian and Alaska Native householders$79,136 Asian householders$71,685 Some other race householders$34,079 Two or more races householders$53,166 Hispanic or Latino race householdersMedian 2022 house value $322,773 White Non-Hispanic householders$227,566 American Indian or Alaska Native householders$309,504 Some other race householders$283,961 Two or more races householders$283,961 Hispanic or Latino householders
Median age by race in Delta
45.2 Median age for White residents44.1 46.3 31.1 Median age for Black or African American residents46.8 20.0 56.1 Median age for American Indian / Alaska Native residents56.8 15.1 37.7 Median age for Asian residents57.3 Median age for Other race residents57.8 55.8 41.5 Median age for Two or more races residents26.8 76.2 49.5 Median age for White alone residents47.6 52.2 23.1 Median age for Hispanic or Latino residents27.1 19.5
Owner/renter occupied households by race in Delta
House owners and renters - White residents 2,007 62.0% Owner occupied1,228 38.0% Renter occupiedHouse owners and renters - American Indian / Alaska Native residents 18 52.5% Owner occupied16 47.5% Renter occupiedHouse owners and renters - Asian residents 63 100.0% Owner occupiedHouse owners and renters - Other race residents 61 71.4% Owner occupied24 28.6% Renter occupiedHouse owners and renters - Two or more races residents 78 100.0% Owner occupiedHouse owners and renters - White alone residents 1,920 63.6% Owner occupied1,099 36.4% Renter occupiedHouse owners and renters - Hispanic or Latino residents 223 47.2% Owner occupied249 52.8% Renter occupied
Language usage in Delta
English speakers - Total 86.2% of residents of Delta speak English at home.
11.2% of residents speak Spanish at home 655 67.9% Speak English very well309 32.1% Speak English less than very well2.6% of residents speak other language at home 93 41.7% Speak English very well130 58.3% Speak English less than very well
English speakers - Born in the United States 94.8% of residents of Delta speak English at home.
4.7% of residents speak Spanish at home 154 100.0% Speak English very well0.6% of residents speak other language at home 20 100.0% Speak English very well
English speakers - Native, born elsewhere 52.0% of residents of Delta speak English at home.
38.2% of residents speak other language at home 25 53.2% Speak English very well22 46.8% Speak English less than very well
English speakers - Foreign-born 6.4% of residents of Delta speak English at home.
59.1% of residents speak Spanish at home 74 27.7% Speak English very well193 72.3% Speak English less than very well32.1% of residents speak other language at home 42 29.0% Speak English very well103 71.0% Speak English less than very well
White (Caucasian) - Speak only English Native:
93.4% (6,699)Foreign-born:
14.7% (27)
White (Caucasian) - Speak another language Native:
6.3% (451)Foreign-born:
79.4% (146)
Asian - Speak another language Native:
81.0% (27)Foreign-born:
98.2% (133)
Other race - Speak another language Native:
64.4% (124)Foreign-born:
95.1% (48)
White alone - Speak only English Native:
97.7% (6,053)Foreign-born:
56.0% (17)
White alone - Speak another language Native:
2.3% (140)Foreign-born:
44.6% (13)
Hispanic or Latino - Speak only English Native:
61.6% (1,046)Foreign-born:
6.4% (18)
Hispanic or Latino - Speak another language Native:
38.0% (646)Foreign-born:
93.0% (258)
Foreign-born residents in Delta 454 residents are foreign born (3.3% Latin America , 1.4% Asia ).
This city:
4.9%Colorado:
100.0%
Marital status for residents in Delta Marital status - White (Caucasian) population 15 years and over
Males 28.8% Never married40.4% Now married1.2% Separated12.3% Widowed17.3% DivorcedFemales 15.5% Never married48.2% Now married2.4% Separated12.2% Widowed21.6% DivorcedWomen who gave birth in the past 12 months Now married:
27.8% (24)Unmarried:
72.2% (62)
Women who did not give birth in the past 12 months Now married:
54.2% (655)Unmarried:
45.8% (554)
Marital status - Black or African American population 15 years and over
Males 83.3% Never married0.0% Now married0.0% Separated0.0% Widowed16.7% DivorcedFemales 94.9% Never married5.1% Now married0.0% Separated0.0% Widowed0.0% DivorcedWomen who did not give birth in the past 12 months Now married:
6.7% (2)Unmarried:
93.3% (29)
Marital status - American Indian / Alaska Native population 15 years and over
Males 28.2% Never married42.7% Now married0.0% Separated0.0% Widowed29.1% DivorcedFemales 100.0% Never married0.0% Now married0.0% Separated0.0% Widowed0.0% DivorcedWomen who did not give birth in the past 12 months Now married:
0.0% (0)Unmarried:
100.0% (17)
Marital status - Asian population 15 years and over
Males 0.0% Never married100.0% Now married0.0% Separated0.0% Widowed0.0% DivorcedFemales 2.4% Never married97.6% Now married0.0% Separated0.0% Widowed0.0% DivorcedWomen who did not give birth in the past 12 months Now married:
100.0% (18)Unmarried:
0.0% (0)
Marital status - Other race population 15 years and over
Males 46.5% Never married53.5% Now married0.0% Separated0.0% Widowed0.0% DivorcedFemales 17.4% Never married60.5% Now married0.0% Separated9.3% Widowed12.8% DivorcedWomen who did not give birth in the past 12 months Now married:
48.3% (17)Unmarried:
51.7% (18)
Marital status - Two or more races population 15 years and over
Males 91.0% Never married9.0% Now married0.0% Separated0.0% Widowed0.0% DivorcedFemales 3.2% Never married80.6% Now married0.0% Separated0.0% Widowed16.1% DivorcedWomen who did not give birth in the past 12 months Now married:
88.0% (84)Unmarried:
12.0% (11)
Marital status - White alone, not Hispanic / Latino population 15 years and over
Males 24.9% Never married42.9% Now married1.5% Separated14.5% Widowed16.2% DivorcedFemales 13.2% Never married46.8% Now married2.5% Separated13.4% Widowed24.1% DivorcedWomen who gave birth in the past 12 months Now married:
13.3% (10)Unmarried:
86.7% (66)
Women who did not give birth in the past 12 months Now married:
57.1% (587)Unmarried:
42.9% (442)
Marital status - Hispanic or Latino population 15 years and over
Males 43.8% Never married34.0% Now married0.0% Separated2.8% Widowed19.4% DivorcedFemales 29.7% Never married56.3% Now married1.7% Separated5.1% Widowed7.2% DivorcedWomen who gave birth in the past 12 months Now married:
100.0% (17)Unmarried:
0.0% (0)
Women who did not give birth in the past 12 months Now married:
44.0% (165)Unmarried:
56.0% (211)
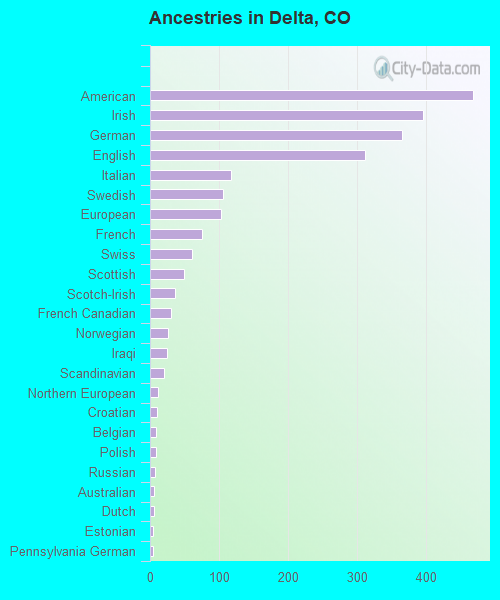
Ancestries in Delta
371 9.7% German370 9.7% American263 6.9% European206 5.4% Irish188 4.9% English82 2.2% Italian55 1.4% Norwegian54 1.4% Northern European42 1.1% Scottish19 0.5% Canadian19 0.5% French Canadian18 0.5% Belgian18 0.5% British16 0.4% Scandinavian14 0.4% Swiss13 0.3% Danish9 0.2% Russian8 0.2% Portuguese7 0.2% Dutch7 0.2% Polish7 0.2% Ukrainian6 0.2% Pennsylvania German6 0.2% Slavic5 0.1% Swedish2 0.05% Croatian1 0.03% African
Children Nativity (place of birth) in Delta
Children under 6 years - Living with two parents Both parents native 325 100.0% NativeBoth parents foreign-born 42 100.0% NativeOne native, one foreign-born parent 65 100.0% NativeChildren under 6 years - Living with one parent Native parent 212 100.0% Native
Children 6 to 17 years - Living with two parents Both parents native 839 100.0% NativeBoth parents foreign-born 22 100.0% NativeOne native, one foreign-born parent 87 100.0% NativeChildren 6 to 17 years - Living with one parent Native parent 379 100.0% Native
Grandparents responsible for own grandchildren in Delta
Grandparents (30 to 59 years) White / Caucasian 68 75.3% Responsible for grandchildren22 24.7% Not responsible for grandchildrenWhite alone, not Hispanic / Latino 48 61.6% Responsible for grandchildren30 38.4% Not responsible for grandchildrenHispanic or Latino 36 100.0% Responsible for grandchildren
Grandparents (60 years and over) White / Caucasian 225 100.0% Not responsible for grandchildrenWhite alone, not Hispanic / Latino 287 100.0% Not responsible for grandchildrenHispanic or Latino 7 100.0% Not responsible for grandchildren