Races in Denison, Texas (TX) Detailed Stats
Data:
Races - White alone (%)
Races - White alone (% change since 2000)
Races - Black alone (%)
Races - Black alone (% change since 2000)
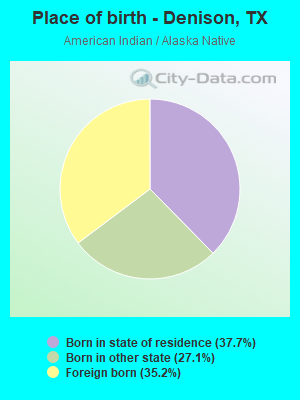
Races - American Indian alone (%)
Races - American Indian alone (% change since 2000)
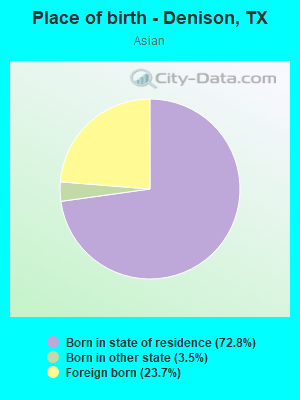
Races - Asian alone (%)
Races - Asian alone (% change since 2000)
Races - Hispanic (%)
Races - Hispanic (% change since 2000)
Races - Native Hawaiian and Other Pacific Islander alone (%)
Races - Native Hawaiian and Other Pacific Islander alone (% change since 2000)
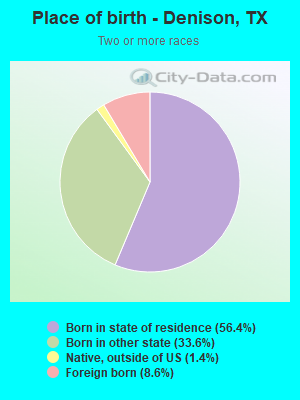
Races - Two or more races(%)
Races - Two or more races(% change since 2000)
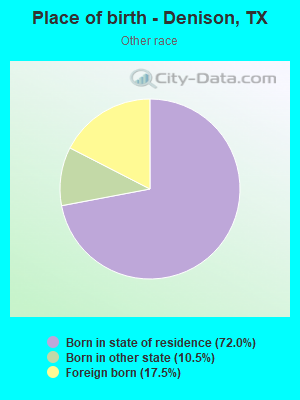
Races - Other race alone (%)
Races - Other race alone (% change since 2000)
Racial diversity
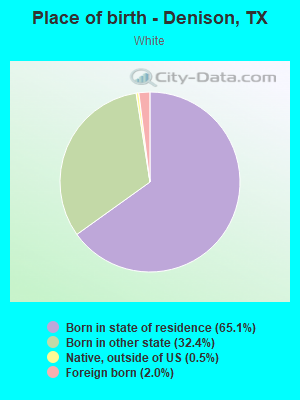
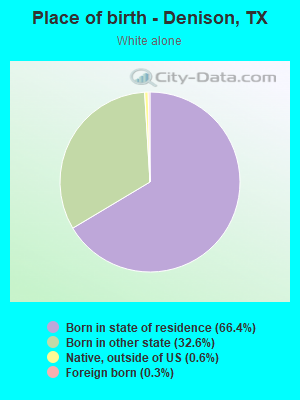
Place of birth - Born in state of residence (%)
Place of birth - Born in state of residence (%) - White
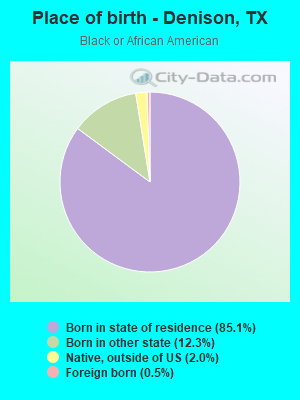
Place of birth - Born in state of residence (%) - Black or African American
Place of birth - Born in state of residence (%) - Asian
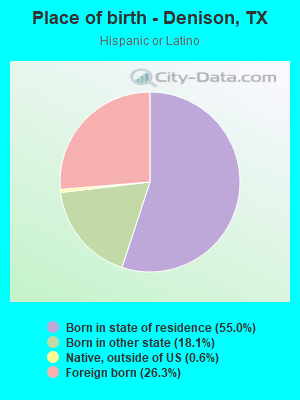
Place of birth - Born in state of residence (%) - Hispanic or Latino
Place of birth - Born in state of residence (%) - American Indian and Alaska Native
Place of birth - Born in state of residence (%) - Multirace
Place of birth - Born in state of residence (%) - Other Race
Place of birth - Born in other state (%)
Place of birth - Born in other state (%) - White
Place of birth - Born in other state (%) - Black or African American
Place of birth - Born in other state (%) - Asian
Place of birth - Born in other state (%) - Hispanic or Latino
Place of birth - Born in other state (%) - American Indian and Alaska Native
Place of birth - Born in other state (%) - Multirace
Place of birth - Born in other state (%) - Other Race
Place of birth - Native, outside of US (%)
Place of birth - Native, outside of US (%) - White
Place of birth - Native, outside of US (%) - Black or African American
Place of birth - Native, outside of US (%) - Asian
Place of birth - Native, outside of US (%) - Hispanic or Latino
Place of birth - Native, outside of US (%) - American Indian and Alaska Native
Place of birth - Native, outside of US (%) - Multirace
Place of birth - Native, outside of US (%) - Other Race
Place of birth - Foreign born (%)
Place of birth - Foreign born (%) - White
Place of birth - Foreign born (%) - Black or African American
Place of birth - Foreign born (%) - Asian
Place of birth - Foreign born (%) - Hispanic or Latino
Place of birth - Foreign born (%) - American Indian and Alaska Native
Place of birth - Foreign born (%) - Multirace
Place of birth - Foreign born (%) - Other Race
Residents speaking English at home (%)
Residents speaking English at home - Born in the United States (%)
Residents speaking English at home - Native, born elsewhere (%)
Residents speaking English at home - Foreign born (%)
Residents speaking Spanish at home (%)
Residents speaking Spanish at home - Born in the United States (%)
Residents speaking Spanish at home - Native, born elsewhere (%)
Residents speaking Spanish at home - Foreign born (%)
Residents speaking other language at home (%)
Residents speaking other language at home - Born in the United States (%)
Residents speaking other language at home - Native, born elsewhere (%)
Residents speaking other language at home - Foreign born (%)
Marital status - Never married (%)
Marital status - Now married (%)
Marital status - Separated (%)
Marital status - Widowed (%)
Marital status - Divorced (%)
Ancestries Reported - Arab (%)
Ancestries Reported - Czech (%)
Ancestries Reported - Danish (%)
Ancestries Reported - Dutch (%)
Ancestries Reported - English (%)
Ancestries Reported - French (%)
Ancestries Reported - French Canadian (%)
Ancestries Reported - German (%)
Ancestries Reported - Greek (%)
Ancestries Reported - Hungarian (%)
Ancestries Reported - Irish (%)
Ancestries Reported - Italian (%)
Ancestries Reported - Lithuanian (%)
Ancestries Reported - Norwegian (%)
Ancestries Reported - Polish (%)
Ancestries Reported - Portuguese (%)
Ancestries Reported - Russian (%)
Ancestries Reported - Scotch-Irish (%)
Ancestries Reported - Scottish (%)
Ancestries Reported - Slovak (%)
Ancestries Reported - Subsaharan African (%)
Ancestries Reported - Swedish (%)
Ancestries Reported - Swiss (%)
Ancestries Reported - Ukrainian (%)
Ancestries Reported - United States (%)
Ancestries Reported - Welsh (%)
Ancestries Reported - West Indian (%)
Ancestries Reported - Other (%)
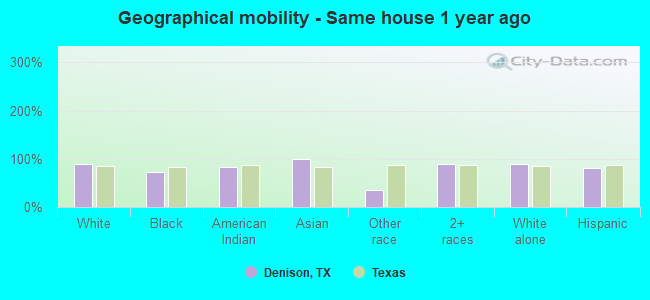
Geographical mobility - Same house 1 year ago (%)
Geographical mobility - Same house 1 year ago (%) - White
Geographical mobility - Same house 1 year ago (%) - Black or African American
Geographical mobility - Same house 1 year ago (%) - Asian
Geographical mobility - Same house 1 year ago (%) - Hispanic or Latino
Geographical mobility - Same house 1 year ago (%) - American Indian and Alaska Native
Geographical mobility - Same house 1 year ago (%) - Multirace
Geographical mobility - Same house 1 year ago (%) - Other Race
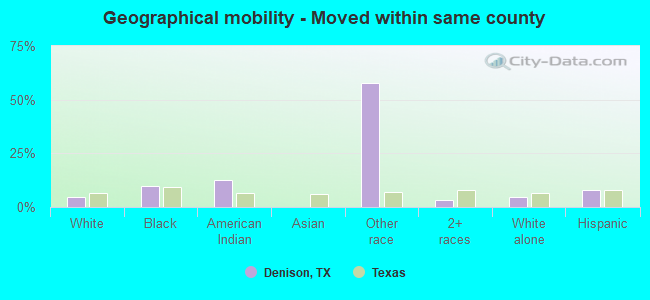
Geographical mobility - Moved within same county (%)
Geographical mobility - Moved within same county (%) - White
Geographical mobility - Moved within same county (%) - Black or African American
Geographical mobility - Moved within same county (%) - Asian
Geographical mobility - Moved within same county (%) - Hispanic or Latino
Geographical mobility - Moved within same county (%) - American Indian and Alaska Native
Geographical mobility - Moved within same county (%) - Multirace
Geographical mobility - Moved within same county (%) - Other Race
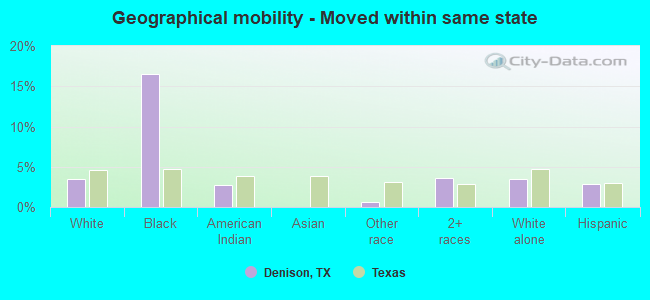
Geographical mobility - Moved from different county within same state (%)
Geographical mobility - Moved from different county within same state (%) - White
Geographical mobility - Moved from different county within same state (%) - Black or African American
Geographical mobility - Moved from different county within same state (%) - Asian
Geographical mobility - Moved from different county within same state (%) - Hispanic or Latino
Geographical mobility - Moved from different county within same state (%) - American Indian and Alaska Native
Geographical mobility - Moved from different county within same state (%) - Multirace
Geographical mobility - Moved from different county within same state (%) - Other Race
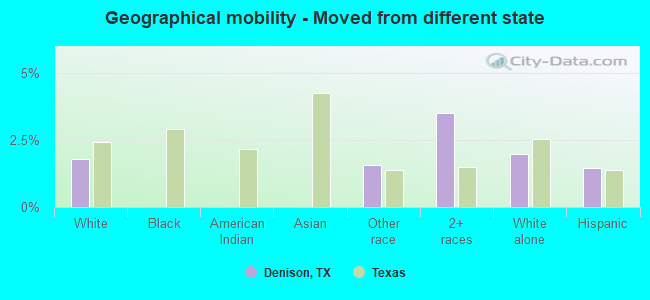
Geographical mobility - Moved from different state (%)
Geographical mobility - Moved from different state (%) - White
Geographical mobility - Moved from different state (%) - Black or African American
Geographical mobility - Moved from different state (%) - Asian
Geographical mobility - Moved from different state (%) - Hispanic or Latino
Geographical mobility - Moved from different state (%) - American Indian and Alaska Native
Geographical mobility - Moved from different state (%) - Multirace
Geographical mobility - Moved from different state (%) - Other Race
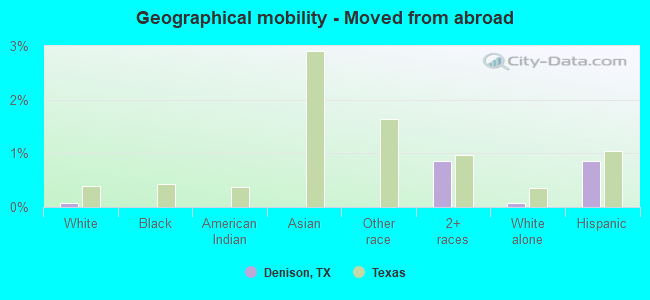
Geographical mobility - Moved from abroad (%)
Geographical mobility - Moved from abroad (%) - White
Geographical mobility - Moved from abroad (%) - Black or African American
Geographical mobility - Moved from abroad (%) - Asian
Geographical mobility - Moved from abroad (%) - Hispanic or Latino
Geographical mobility - Moved from abroad (%) - American Indian and Alaska Native
Geographical mobility - Moved from abroad (%) - Multirace
Geographical mobility - Moved from abroad (%) - Other Race
Place of birth for the foreign-born population - Ireland (%)
Place of birth for the foreign-born population - Denmark (%)
Place of birth for the foreign-born population - Norway (%)
Place of birth for the foreign-born population - Sweden (%)
Place of birth for the foreign-born population - United Kingdom (%)
Place of birth for the foreign-born population - England (%)
Place of birth for the foreign-born population - Scotland (%)
Place of birth for the foreign-born population - Other Northern Europe (%)
Place of birth for the foreign-born population - Austria (%)
Place of birth for the foreign-born population - Belgium (%)
Place of birth for the foreign-born population - France (%)
Place of birth for the foreign-born population - Germany (%)
Place of birth for the foreign-born population - Netherlands (%)
Place of birth for the foreign-born population - Switzerland (%)
Place of birth for the foreign-born population - Other Western Europe (%)
Place of birth for the foreign-born population - Greece (%)
Place of birth for the foreign-born population - Italy (%)
Place of birth for the foreign-born population - Portugal (%)
Place of birth for the foreign-born population - Spain (%)
Place of birth for the foreign-born population - Other Southern Europe (%)
Place of birth for the foreign-born population - Albania (%)
Place of birth for the foreign-born population - Belarus (%)
Place of birth for the foreign-born population - Bosnia and Herzegovina (%)
Place of birth for the foreign-born population - Bulgaria (%)
Place of birth for the foreign-born population - Croatia (%)
Place of birth for the foreign-born population - Czechoslovakia (%)
Place of birth for the foreign-born population - Hungary (%)
Place of birth for the foreign-born population - Latvia (%)
Place of birth for the foreign-born population - Lithuania (%)
Place of birth for the foreign-born population - North Macedonia (Macedonia) (%)
Place of birth for the foreign-born population - Moldova (%)
Place of birth for the foreign-born population - Poland (%)
Place of birth for the foreign-born population - Romania (%)
Place of birth for the foreign-born population - Russia (%)
Place of birth for the foreign-born population - Serbia (%)
Place of birth for the foreign-born population - Ukraine (%)
Place of birth for the foreign-born population - Other Eastern Europe (%)
Place of birth for the foreign-born population - China (%)
Place of birth for the foreign-born population - Hong Kong (%)
Place of birth for the foreign-born population - Taiwan (%)
Place of birth for the foreign-born population - Japan (%)
Place of birth for the foreign-born population - Korea (%)
Place of birth for the foreign-born population - Other Eastern Asia (%)
Place of birth for the foreign-born population - Afghanistan (%)
Place of birth for the foreign-born population - Bangladesh (%)
Place of birth for the foreign-born population - India (%)
Place of birth for the foreign-born population - Iran (%)
Place of birth for the foreign-born population - Kazakhstan (%)
Place of birth for the foreign-born population - Nepal (%)
Place of birth for the foreign-born population - Pakistan (%)
Place of birth for the foreign-born population - Sri Lanka (%)
Place of birth for the foreign-born population - Uzbekistan (%)
Place of birth for the foreign-born population - Other South Central Asia (%)
Place of birth for the foreign-born population - Burma (%)
Place of birth for the foreign-born population - Cambodia (%)
Place of birth for the foreign-born population - Indonesia (%)
Place of birth for the foreign-born population - Laos (%)
Place of birth for the foreign-born population - Malaysia (%)
Place of birth for the foreign-born population - Philippines (%)
Place of birth for the foreign-born population - Singapore (%)
Place of birth for the foreign-born population - Thailand (%)
Place of birth for the foreign-born population - Vietnam (%)
Place of birth for the foreign-born population - Other South Eastern Asia (%)
Place of birth for the foreign-born population - Armenia (%)
Place of birth for the foreign-born population - Iraq (%)
Place of birth for the foreign-born population - Israel (%)
Place of birth for the foreign-born population - Jordan (%)
Place of birth for the foreign-born population - Kuwait (%)
Place of birth for the foreign-born population - Lebanon (%)
Place of birth for the foreign-born population - Saudi Arabia (%)
Place of birth for the foreign-born population - Syria (%)
Place of birth for the foreign-born population - Turkey (%)
Place of birth for the foreign-born population - Yemen (%)
Place of birth for the foreign-born population - Other Western Asia (%)
Place of birth for the foreign-born population - Eritrea (%)
Place of birth for the foreign-born population - Ethiopia (%)
Place of birth for the foreign-born population - Kenya (%)
Place of birth for the foreign-born population - Somalia (%)
Place of birth for the foreign-born population - Uganda (%)
Place of birth for the foreign-born population - Zimbabwe (%)
Place of birth for the foreign-born population - Other Eastern Africa (%)
Place of birth for the foreign-born population - Cameroon (%)
Place of birth for the foreign-born population - Congo (%)
Place of birth for the foreign-born population - Democratic Republic of Congo (Zaire) (%)
Place of birth for the foreign-born population - Other Middle Africa (%)
Place of birth for the foreign-born population - Egypt (%)
Place of birth for the foreign-born population - Morocco (%)
Place of birth for the foreign-born population - Sudan (%)
Place of birth for the foreign-born population - Other Northern Africa (%)
Place of birth for the foreign-born population - South Africa (%)
Place of birth for the foreign-born population - Other Southern Africa (%)
Place of birth for the foreign-born population - Cabo Verde (%)
Place of birth for the foreign-born population - Ghana (%)
Place of birth for the foreign-born population - Liberia (%)
Place of birth for the foreign-born population - Nigeria (%)
Place of birth for the foreign-born population - Senegal (%)
Place of birth for the foreign-born population - Sierra Leone (%)
Place of birth for the foreign-born population - Other Western Africa (%)
Place of birth for the foreign-born population - Australia (%)
Place of birth for the foreign-born population - New Zealand (%)
Place of birth for the foreign-born population - Fiji (%)
Place of birth for the foreign-born population - Micronesia (%)
Place of birth for the foreign-born population - Bahamas (%)
Place of birth for the foreign-born population - Barbados (%)
Place of birth for the foreign-born population - Cuba (%)
Place of birth for the foreign-born population - Dominica (%)
Place of birth for the foreign-born population - Dominican Republic (%)
Place of birth for the foreign-born population - Grenada (%)
Place of birth for the foreign-born population - Haiti (%)
Place of birth for the foreign-born population - Jamaica (%)
Place of birth for the foreign-born population - St. Vincent and the Grenadines (%)
Place of birth for the foreign-born population - Trinidad and Tobago (%)
Place of birth for the foreign-born population - West Indies (%)
Place of birth for the foreign-born population - Other Caribbean (%)
Place of birth for the foreign-born population - Belize (%)
Place of birth for the foreign-born population - Costa Rica (%)
Place of birth for the foreign-born population - El Salvador (%)
Place of birth for the foreign-born population - Guatemala (%)
Place of birth for the foreign-born population - Honduras (%)
Place of birth for the foreign-born population - Mexico (%)
Place of birth for the foreign-born population - Nicaragua (%)
Place of birth for the foreign-born population - Panama (%)
Place of birth for the foreign-born population - Other Central America (%)
Place of birth for the foreign-born population - Argentina (%)
Place of birth for the foreign-born population - Bolivia (%)
Place of birth for the foreign-born population - Brazil (%)
Place of birth for the foreign-born population - Chile (%)
Place of birth for the foreign-born population - Colombia (%)
Place of birth for the foreign-born population - Ecuador (%)
Place of birth for the foreign-born population - Guyana (%)
Place of birth for the foreign-born population - Peru (%)
Place of birth for the foreign-born population - Uruguay (%)
Place of birth for the foreign-born population - Venezuela (%)
Place of birth for the foreign-born population - Other South America (%)
Place of birth for the foreign-born population - Canada (%)
Place of birth for the foreign-born population - Other Northern America (%)
Place of birth for the foreign-born population - Other (%)
Latest news about races in Denison, TX collected exclusively by city-data.com from local newspapers, TV, and radio stations
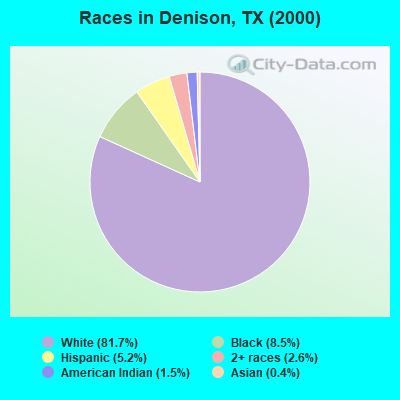
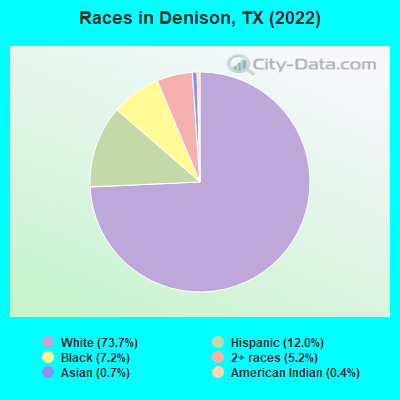
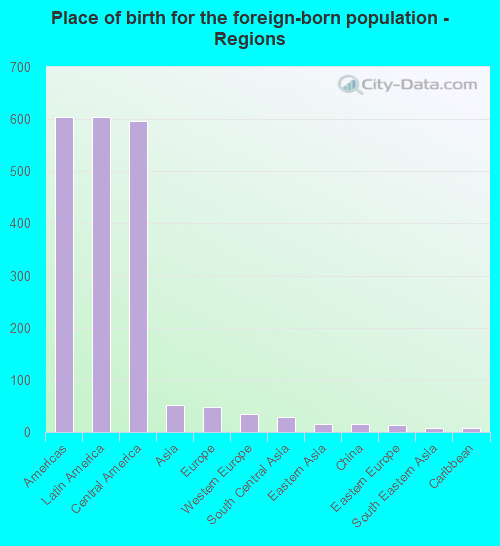
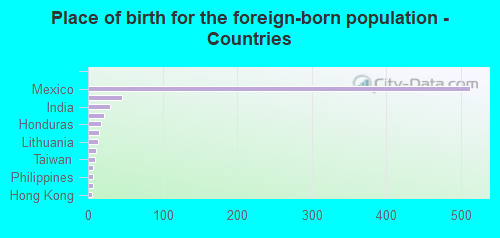
According to 2022 data, the most numerous races in Denison, TX are Hispanic (3,128 residents), White alone (19,152 residents), and Black alone (1,879 residents). 91.6% of Denison residents speak English at home. 2.7% of Denison, TX residents are foreign-born (2.3% born in Latin America), which is 523.9% less than the foreign-born rate of 17.0% across the entire state of Texas.
Race distribution in Denison
2000 2022
10,933,313 52.4% White alone 6,669,666 32.0% Hispanic 2,364,255 11.3% Black alone 554,445 2.7% Asian alone 230,567 1.1% Two or more races 68,859 0.3% American Indian alone 19,958 0.10% Other race alone 10,757 0.05% Native Hawaiian and Other
12,070,642 40.2% Hispanic 11,683,430 38.9% White alone 3,508,706 11.7% Black alone 1,608,173 5.4% Asian alone 956,560 3.2% Two or more races 125,763 0.4% Other race alone 47,023 0.2% American Indian alone 29,275 0.10% Native Hawaiian and Other
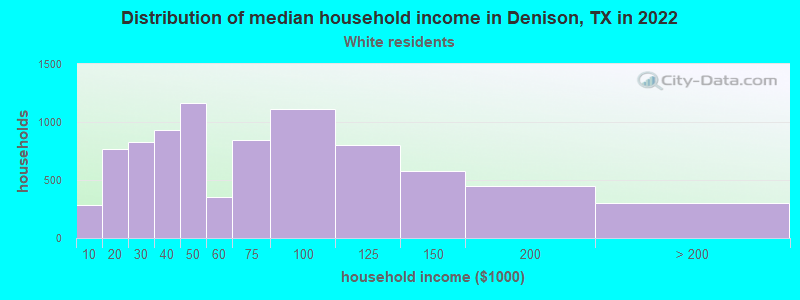
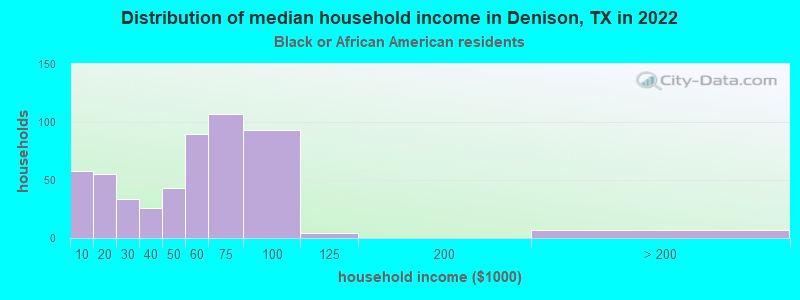
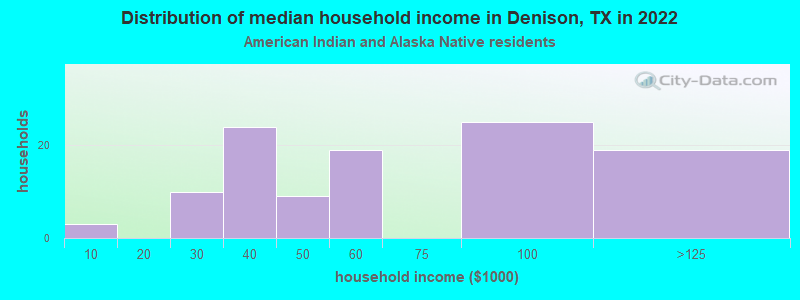
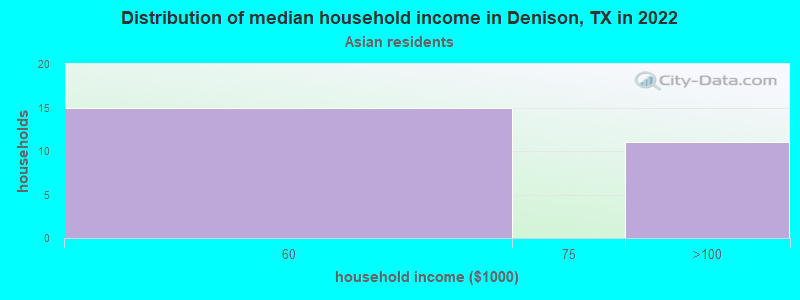
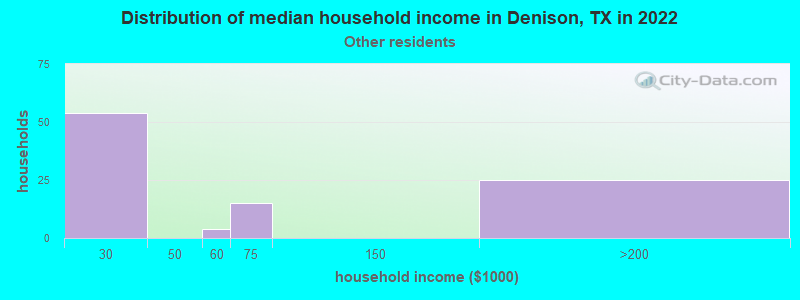
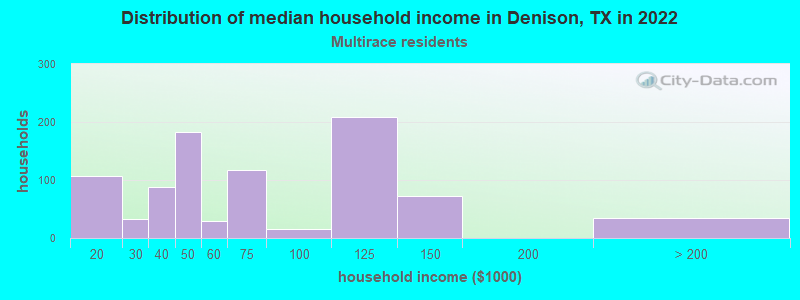
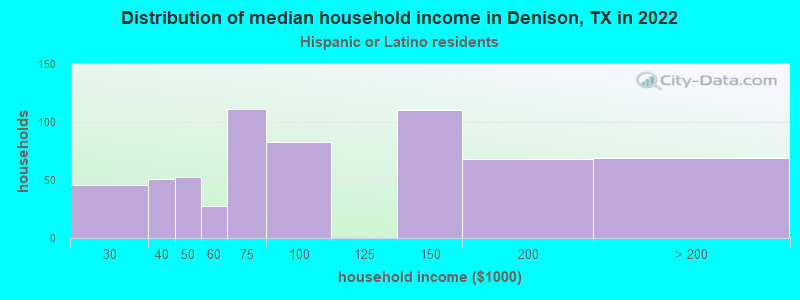
Income and house value in Denison Median household income in 2022 $57,202 White non-Hispanic householders$69,763 Black householders$41,904 American Indian and Alaska Native householders$68,368 Two or more races householders$78,100 Hispanic or Latino race householdersMedian 2022 house value $176,998 White Non-Hispanic householders$159,730 Black or African American householders$137,480 American Indian or Alaska Native householders $373,589 Asian householders$265,663 Native Hawaiian and other Pacific Islander householders$107,925 Some other race householders$160,062 Two or more races householders$174,341 Hispanic or Latino householders
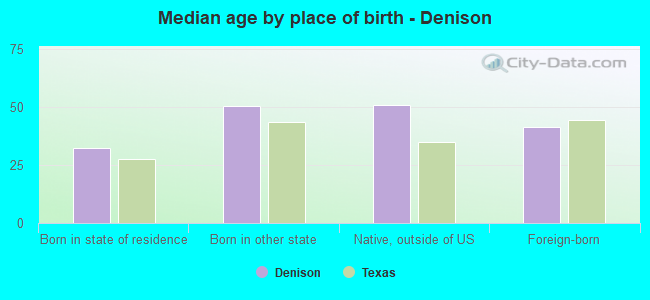
Median age by race in Denison
42.0 Median age for White residents39.4 44.9 35.5 Median age for Black or African American residents28.7 40.3 51.8 Median age for American Indian / Alaska Native residents52.3 20.1 27.5 Median age for Asian residents26.5 26.5 -581,560,283.1 Median age for Native Hawaiian / Pacific Islander residents-666,666,666.0 -577,777,777.2 21.1 Median age for Other race residents17.4 25.2 40.3 Median age for Two or more races residents24.1 59.2 45.0 Median age for White alone residents40.5 48.4 24.1 Median age for Hispanic or Latino residents18.5 26.8
Owner/renter occupied households by race in Denison
House owners and renters - White residents 5,403 65.0% Owner occupied2,905 35.0% Renter occupiedHouse owners and renters - Black or African American residents 250 42.4% Owner occupied340 57.6% Renter occupiedHouse owners and renters - American Indian / Alaska Native residents 34 47.3% Owner occupied37 52.7% Renter occupiedHouse owners and renters - Asian residents 23 63.9% Owner occupied13 36.1% Renter occupiedHouse owners and renters - Other race residents 62 63.7% Owner occupied35 36.3% Renter occupiedHouse owners and renters - Two or more races residents 371 51.6% Owner occupied349 48.4% Renter occupiedHouse owners and renters - White alone residents 5,281 66.9% Owner occupied2,608 33.1% Renter occupiedHouse owners and renters - Hispanic or Latino residents 314 46.5% Owner occupied361 53.5% Renter occupied
Language usage in Denison
English speakers - Total 91.6% of residents of Denison speak English at home.
6.7% of residents speak Spanish at home 890 54.4% Speak English very well746 45.6% Speak English less than very well1.1% of residents speak other language at home 263 100.0% Speak English very well
English speakers - Born in the United States 96.4% of residents of Denison speak English at home.
2.6% of residents speak Spanish at home 194 100.0% Speak English very well0.5% of residents speak other language at home 37 100.0% Speak English very well
All residents speak only English at home
English speakers - Foreign-born 9.5% of residents of Denison speak English at home.
94.3% of residents speak Spanish at home 179 21.7% Speak English very well647 78.3% Speak English less than very well5.6% of residents speak other language at home 49 100.0% Speak English very well
White (Caucasian) - Speak only English Native:
96.6% (18,329)Foreign-born:
22.9% (87)
White (Caucasian) - Speak another language Native:
3.5% (656)Foreign-born:
77.0% (294)
Black or African American - Speak only English Native:
100.0% (1,735)Foreign-born:
90.7% (8)
American Indian / Alaska Native - Speak another language Native:
4.4% (8)Foreign-born:
98.9% (106)
Asian - Speak only English Native:
15.6% (20)Foreign-born:
15.3% (8)
Asian - Speak another language Native:
77.2% (99)Foreign-born:
74.4% (39)
Other race - Speak another language Native:
27.7% (173)Foreign-born:
100.0% (147)
Two or more races - Speak another language Native:
3.3% (52)Foreign-born:
100.0% (169)
White alone - Speak only English Native:
99.6% (17,994)Foreign-born:
100.0% (59)
Hispanic or Latino - Speak only English Native:
61.3% (1,169)Foreign-born:
4.6% (36)
Hispanic or Latino - Speak another language Native:
40.2% (766)Foreign-born:
100.0% (781)
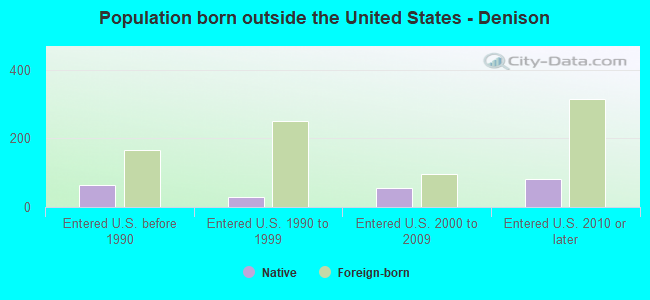
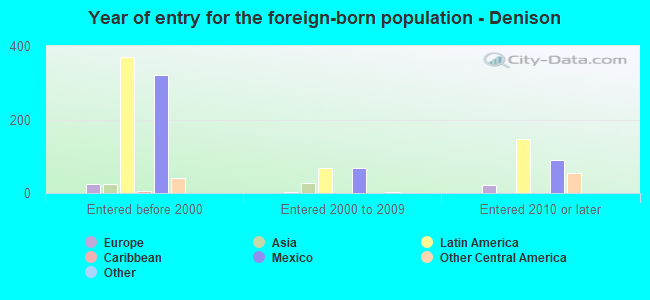
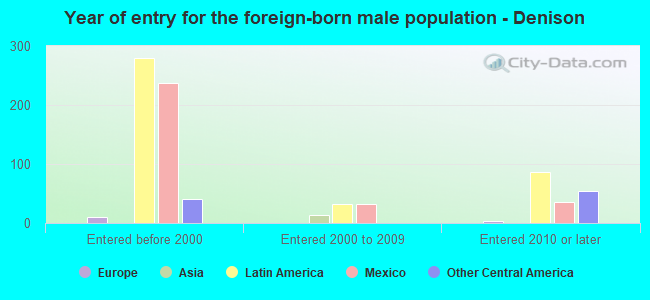
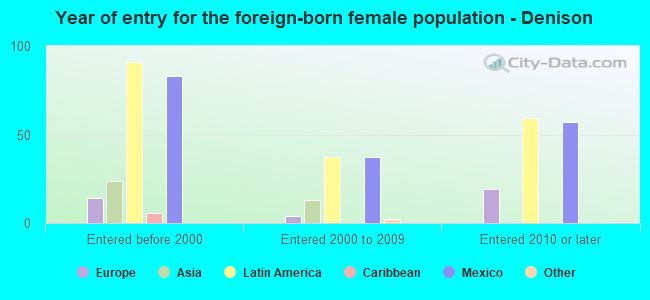
Foreign-born residents in Denison 708 residents are foreign born (2.3% Latin America ).
This city:
2.7%Texas:
17.1%
Marital status for residents in Denison Marital status - White (Caucasian) population 15 years and over
Males 27.9% Never married53.7% Now married1.0% Separated3.4% Widowed13.9% DivorcedFemales 19.2% Never married44.7% Now married3.0% Separated14.1% Widowed19.1% DivorcedWomen who gave birth in the past 12 months Now married:
68.4% (148)Unmarried:
31.6% (68)
Women who did not give birth in the past 12 months Now married:
48.7% (2,099)Unmarried:
51.3% (2,208)
Marital status - Black or African American population 15 years and over
Males 36.7% Never married43.2% Now married0.0% Separated5.1% Widowed15.1% DivorcedFemales 45.8% Never married20.2% Now married11.5% Separated14.5% Widowed8.0% DivorcedWomen who gave birth in the past 12 months Now married:
0.0% (0)Unmarried:
100.0% (7)
Women who did not give birth in the past 12 months Now married:
31.2% (133)Unmarried:
68.8% (294)
Marital status - American Indian / Alaska Native population 15 years and over
Males 5.1% Never married58.1% Now married21.4% Separated0.0% Widowed15.4% DivorcedFemales 41.5% Never married32.3% Now married0.0% Separated4.6% Widowed21.5% DivorcedWomen who gave birth in the past 12 months Now married:
0.0% (0)Unmarried:
100.0% (16)
Women who did not give birth in the past 12 months Now married:
20.0% (6)Unmarried:
80.0% (23)
Marital status - Asian population 15 years and over
Males 52.1% Never married47.9% Now married0.0% Separated0.0% Widowed0.0% DivorcedFemales 58.4% Never married41.6% Now married0.0% Separated0.0% Widowed0.0% DivorcedWomen who did not give birth in the past 12 months Now married:
27.8% (22)Unmarried:
72.2% (56)
Marital status - Other race population 15 years and over
Males 47.8% Never married52.2% Now married0.0% Separated0.0% Widowed0.0% DivorcedFemales 46.1% Never married51.7% Now married0.0% Separated2.2% Widowed0.0% DivorcedWomen who did not give birth in the past 12 months Now married:
39.2% (67)Unmarried:
60.8% (104)
Marital status - Two or more races population 15 years and over
Males 43.1% Never married42.5% Now married0.0% Separated0.7% Widowed13.6% DivorcedFemales 36.9% Never married27.5% Now married1.1% Separated16.7% Widowed17.8% DivorcedWomen who gave birth in the past 12 months Now married:
9.1% (4)Unmarried:
90.9% (44)
Women who did not give birth in the past 12 months Now married:
47.2% (148)Unmarried:
52.8% (165)
Marital status - White alone, not Hispanic / Latino population 15 years and over
Males 26.8% Never married53.3% Now married1.1% Separated3.7% Widowed15.1% DivorcedFemales 18.4% Never married43.8% Now married3.1% Separated14.7% Widowed20.0% DivorcedWomen who gave birth in the past 12 months Now married:
61.8% (109)Unmarried:
38.2% (67)
Women who did not give birth in the past 12 months Now married:
47.9% (1,858)Unmarried:
52.1% (2,022)
Marital status - Hispanic or Latino population 15 years and over
Males 39.2% Never married53.5% Now married2.3% Separated0.2% Widowed4.8% DivorcedFemales 38.5% Never married52.5% Now married0.9% Separated2.3% Widowed5.7% DivorcedWomen who gave birth in the past 12 months Now married:
100.0% (42)Unmarried:
0.0% (0)
Women who did not give birth in the past 12 months Now married:
49.0% (322)Unmarried:
51.0% (335)
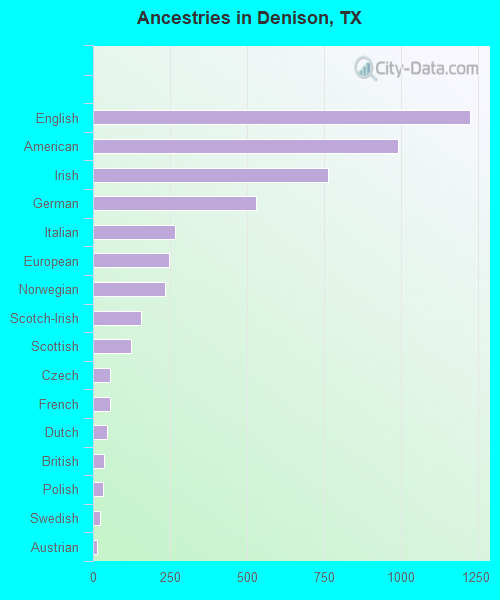
Ancestries in Denison
1,226 13.2% English991 10.7% American764 8.2% Irish529 5.7% German265 2.8% Italian246 2.6% European233 2.5% Norwegian156 1.7% Scotch-Irish124 1.3% Scottish56 0.6% Czech55 0.6% French45 0.5% Dutch37 0.4% British34 0.4% Polish23 0.2% Swedish12 0.1% Austrian11 0.1% Belgian10 0.1% Hungarian8 0.09% French Canadian6 0.06% Cajun6 0.06% British West Indian5 0.05% Northern European
Geographical mobility in Denison Same house 1 year ago 18,307 90.0% White (Caucasian)1,312 73.0% Black or African American236 83.5% American Indian / Alaska Native176 99.3% Asian348 35.2% Other race1,886 89.9% Two or more races16,948 89.2% White alone, not Hispanic / Latino2,475 80.9% Hispanic or LatinoMoved within same county 944 4.6% White / Caucasian179 10.0% Black or African American36 12.7% American Indian / Alaska Native570 57.6% Other race73 3.5% Two or more races926 4.9% White alone, not Hispanic / Latino243 7.9% Hispanic or LatinoMoved within same state 704 3.5% White / Caucasian298 16.6% Black or African American8 2.7% American Indian / Alaska Native6 0.7% Other race75 3.6% Two or more races659 3.5% White alone, not Hispanic / Latino86 2.8% Hispanic or LatinoMoved from different state 364 1.8% White / Caucasian15 1.6% Other race73 3.5% Two or more races376 2.0% White alone, not Hispanic / Latino45 1.5% Hispanic or LatinoMoved from abroad 17 0.1% White18 0.9% Two or more races14 0.1% White alone, not Hispanic / Latino26 0.9% Hispanic or Latino
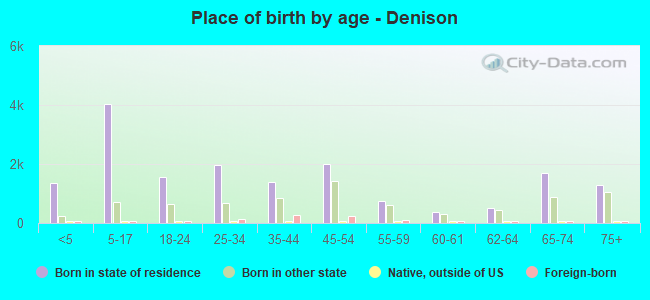
Children Nativity (place of birth) in Denison
Children under 6 years - Living with two parents Both parents native 1,036 100.0% NativeBoth parents foreign-born 50 100.0% NativeOne native, one foreign-born parent 10 100.0% NativeChildren under 6 years - Living with one parent Native parent 547 100.0% NativeChildren 6 to 17 years - Living with two parents Both parents native 1,955 100.0% NativeBoth parents foreign-born 192 100.0% NativeOne native, one foreign-born parent 449 100.0% NativeChildren 6 to 17 years - Living with one parent Native parent 1,647 100.0% NativeForeign-born parent 34 50.5% Native33 49.5% Foreign-born
Grandparents responsible for own grandchildren in Denison
Grandparents (30 to 59 years) White / Caucasian 142 89.6% Responsible for grandchildren16 10.4% Not responsible for grandchildrenBlack or African American 47 94.4% Responsible for grandchildren3 5.6% Not responsible for grandchildrenAmerican Indian / Alaska Native 13 100.0% Responsible for grandchildrenOther race 30 100.0% Not responsible for grandchildrenTwo or more races 28 100.0% Responsible for grandchildrenWhite alone, not Hispanic / Latino 186 87.9% Responsible for grandchildren26 12.1% Not responsible for grandchildrenHispanic or Latino 11 31.2% Responsible for grandchildren23 68.8% Not responsible for grandchildrenGrandparents (60 years and over) White / Caucasian 47 24.0% Responsible for grandchildren150 76.0% Not responsible for grandchildrenBlack or African American 22 100.0% Not responsible for grandchildrenWhite alone, not Hispanic / Latino 45 26.7% Responsible for grandchildren125 73.3% Not responsible for grandchildrenHispanic or Latino 5 100.0% Responsible for grandchildren