Races in District 10, Funkstown, Maryland (MD) Detailed Stats
Ancestries, Foreign-born residents, place of birth
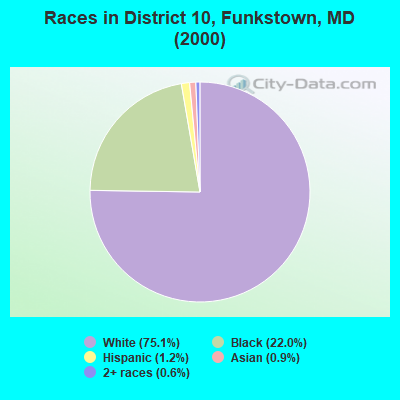
Race distribution in District 10, Funkstown

- 8,55875.1%White alone
- 2,50122.0%Black alone
- 1321.2%Hispanic
- 1040.9%Asian alone
- 700.6%Two or more races
- 100.09%Other race alone
- 100.09%American Indian alone
- 50.04%Native Hawaiian and Other
Pacific Islander alone
2000
2022
-
- 3,286,54762.1%White alone
- 1,464,73527.7%Black alone
- 227,9164.3%Hispanic
- 209,7384.0%Asian alone
- 82,9461.6%Two or more races
- 13,3120.3%American Indian alone
- 9,3790.2%Other race alone
- 1,9130.04%Native Hawaiian and Other
Pacific Islander alone

-
- 2,906,49247.1%White alone
- 1,800,91429.2%Black alone
- 705,84211.4%Hispanic
- 401,8186.5%Asian alone
- 291,3174.7%Two or more races
- 46,9300.8%Other race alone
- 8,9300.1%American Indian alone
- 2,4170.04%Native Hawaiian and Other
Pacific Islander alone

Income and house value in District 10, Funkstown
- Median household income in 2022
- $76,426White non-Hispanic householders
- $112,647Black householders
- $150,930Asian householders
- $52,020Some other race householders
- $71,694Two or more races householders
- $77,675Hispanic or Latino race householders
- Median 2022 house value
- $304,838White Non-Hispanic householders
- $434,270Black or African American householders
- $281,101American Indian or Alaska Native householders
- $562,202Asian householders
- $281,101Hispanic or Latino householders
Household income for White non-Hispanic householders

Household income for Black householders

Household income for American Indian and Alaska Native householders

Household income for Asian householders

Household income for Two or more races householders

Household income for Hispanic or Latino race householders

Zip code: 21740