Races in Duncan, Oklahoma (OK) Detailed Stats
Data:
Races - White alone (%)
Races - White alone (% change since 2000)
Races - Black alone (%)
Races - Black alone (% change since 2000)
Races - American Indian alone (%)
Races - American Indian alone (% change since 2000)
Races - Asian alone (%)
Races - Asian alone (% change since 2000)
Races - Hispanic (%)
Races - Hispanic (% change since 2000)
Races - Native Hawaiian and Other Pacific Islander alone (%)
Races - Native Hawaiian and Other Pacific Islander alone (% change since 2000)
Races - Two or more races(%)
Races - Two or more races(% change since 2000)
Races - Other race alone (%)
Races - Other race alone (% change since 2000)
Racial diversity
Place of birth - Born in state of residence (%)
Place of birth - Born in state of residence (%) - White
Place of birth - Born in state of residence (%) - Black or African American
Place of birth - Born in state of residence (%) - Asian
Place of birth - Born in state of residence (%) - Hispanic or Latino
Place of birth - Born in state of residence (%) - American Indian and Alaska Native
Place of birth - Born in state of residence (%) - Multirace
Place of birth - Born in state of residence (%) - Other Race
Place of birth - Born in other state (%)
Place of birth - Born in other state (%) - White
Place of birth - Born in other state (%) - Black or African American
Place of birth - Born in other state (%) - Asian
Place of birth - Born in other state (%) - Hispanic or Latino
Place of birth - Born in other state (%) - American Indian and Alaska Native
Place of birth - Born in other state (%) - Multirace
Place of birth - Born in other state (%) - Other Race
Place of birth - Native, outside of US (%)
Place of birth - Native, outside of US (%) - White
Place of birth - Native, outside of US (%) - Black or African American
Place of birth - Native, outside of US (%) - Asian
Place of birth - Native, outside of US (%) - Hispanic or Latino
Place of birth - Native, outside of US (%) - American Indian and Alaska Native
Place of birth - Native, outside of US (%) - Multirace
Place of birth - Native, outside of US (%) - Other Race
Place of birth - Foreign born (%)
Place of birth - Foreign born (%) - White
Place of birth - Foreign born (%) - Black or African American
Place of birth - Foreign born (%) - Asian
Place of birth - Foreign born (%) - Hispanic or Latino
Place of birth - Foreign born (%) - American Indian and Alaska Native
Place of birth - Foreign born (%) - Multirace
Place of birth - Foreign born (%) - Other Race
Residents speaking English at home (%)
Residents speaking English at home - Born in the United States (%)
Residents speaking English at home - Native, born elsewhere (%)
Residents speaking English at home - Foreign born (%)
Residents speaking Spanish at home (%)
Residents speaking Spanish at home - Born in the United States (%)
Residents speaking Spanish at home - Native, born elsewhere (%)
Residents speaking Spanish at home - Foreign born (%)
Residents speaking other language at home (%)
Residents speaking other language at home - Born in the United States (%)
Residents speaking other language at home - Native, born elsewhere (%)
Residents speaking other language at home - Foreign born (%)
Marital status - Never married (%)
Marital status - Now married (%)
Marital status - Separated (%)
Marital status - Widowed (%)
Marital status - Divorced (%)
Ancestries Reported - Arab (%)
Ancestries Reported - Czech (%)
Ancestries Reported - Danish (%)
Ancestries Reported - Dutch (%)
Ancestries Reported - English (%)
Ancestries Reported - French (%)
Ancestries Reported - French Canadian (%)
Ancestries Reported - German (%)
Ancestries Reported - Greek (%)
Ancestries Reported - Hungarian (%)
Ancestries Reported - Irish (%)
Ancestries Reported - Italian (%)
Ancestries Reported - Lithuanian (%)
Ancestries Reported - Norwegian (%)
Ancestries Reported - Polish (%)
Ancestries Reported - Portuguese (%)
Ancestries Reported - Russian (%)
Ancestries Reported - Scotch-Irish (%)
Ancestries Reported - Scottish (%)
Ancestries Reported - Slovak (%)
Ancestries Reported - Subsaharan African (%)
Ancestries Reported - Swedish (%)
Ancestries Reported - Swiss (%)
Ancestries Reported - Ukrainian (%)
Ancestries Reported - United States (%)
Ancestries Reported - Welsh (%)
Ancestries Reported - West Indian (%)
Ancestries Reported - Other (%)
Geographical mobility - Same house 1 year ago (%)
Geographical mobility - Same house 1 year ago (%) - White
Geographical mobility - Same house 1 year ago (%) - Black or African American
Geographical mobility - Same house 1 year ago (%) - Asian
Geographical mobility - Same house 1 year ago (%) - Hispanic or Latino
Geographical mobility - Same house 1 year ago (%) - American Indian and Alaska Native
Geographical mobility - Same house 1 year ago (%) - Multirace
Geographical mobility - Same house 1 year ago (%) - Other Race
Geographical mobility - Moved within same county (%)
Geographical mobility - Moved within same county (%) - White
Geographical mobility - Moved within same county (%) - Black or African American
Geographical mobility - Moved within same county (%) - Asian
Geographical mobility - Moved within same county (%) - Hispanic or Latino
Geographical mobility - Moved within same county (%) - American Indian and Alaska Native
Geographical mobility - Moved within same county (%) - Multirace
Geographical mobility - Moved within same county (%) - Other Race
Geographical mobility - Moved from different county within same state (%)
Geographical mobility - Moved from different county within same state (%) - White
Geographical mobility - Moved from different county within same state (%) - Black or African American
Geographical mobility - Moved from different county within same state (%) - Asian
Geographical mobility - Moved from different county within same state (%) - Hispanic or Latino
Geographical mobility - Moved from different county within same state (%) - American Indian and Alaska Native
Geographical mobility - Moved from different county within same state (%) - Multirace
Geographical mobility - Moved from different county within same state (%) - Other Race
Geographical mobility - Moved from different state (%)
Geographical mobility - Moved from different state (%) - White
Geographical mobility - Moved from different state (%) - Black or African American
Geographical mobility - Moved from different state (%) - Asian
Geographical mobility - Moved from different state (%) - Hispanic or Latino
Geographical mobility - Moved from different state (%) - American Indian and Alaska Native
Geographical mobility - Moved from different state (%) - Multirace
Geographical mobility - Moved from different state (%) - Other Race
Geographical mobility - Moved from abroad (%)
Geographical mobility - Moved from abroad (%) - White
Geographical mobility - Moved from abroad (%) - Black or African American
Geographical mobility - Moved from abroad (%) - Asian
Geographical mobility - Moved from abroad (%) - Hispanic or Latino
Geographical mobility - Moved from abroad (%) - American Indian and Alaska Native
Geographical mobility - Moved from abroad (%) - Multirace
Geographical mobility - Moved from abroad (%) - Other Race
Place of birth for the foreign-born population - Ireland (%)
Place of birth for the foreign-born population - Denmark (%)
Place of birth for the foreign-born population - Norway (%)
Place of birth for the foreign-born population - Sweden (%)
Place of birth for the foreign-born population - United Kingdom (%)
Place of birth for the foreign-born population - England (%)
Place of birth for the foreign-born population - Scotland (%)
Place of birth for the foreign-born population - Other Northern Europe (%)
Place of birth for the foreign-born population - Austria (%)
Place of birth for the foreign-born population - Belgium (%)
Place of birth for the foreign-born population - France (%)
Place of birth for the foreign-born population - Germany (%)
Place of birth for the foreign-born population - Netherlands (%)
Place of birth for the foreign-born population - Switzerland (%)
Place of birth for the foreign-born population - Other Western Europe (%)
Place of birth for the foreign-born population - Greece (%)
Place of birth for the foreign-born population - Italy (%)
Place of birth for the foreign-born population - Portugal (%)
Place of birth for the foreign-born population - Spain (%)
Place of birth for the foreign-born population - Other Southern Europe (%)
Place of birth for the foreign-born population - Albania (%)
Place of birth for the foreign-born population - Belarus (%)
Place of birth for the foreign-born population - Bosnia and Herzegovina (%)
Place of birth for the foreign-born population - Bulgaria (%)
Place of birth for the foreign-born population - Croatia (%)
Place of birth for the foreign-born population - Czechoslovakia (%)
Place of birth for the foreign-born population - Hungary (%)
Place of birth for the foreign-born population - Latvia (%)
Place of birth for the foreign-born population - Lithuania (%)
Place of birth for the foreign-born population - North Macedonia (Macedonia) (%)
Place of birth for the foreign-born population - Moldova (%)
Place of birth for the foreign-born population - Poland (%)
Place of birth for the foreign-born population - Romania (%)
Place of birth for the foreign-born population - Russia (%)
Place of birth for the foreign-born population - Serbia (%)
Place of birth for the foreign-born population - Ukraine (%)
Place of birth for the foreign-born population - Other Eastern Europe (%)
Place of birth for the foreign-born population - China (%)
Place of birth for the foreign-born population - Hong Kong (%)
Place of birth for the foreign-born population - Taiwan (%)
Place of birth for the foreign-born population - Japan (%)
Place of birth for the foreign-born population - Korea (%)
Place of birth for the foreign-born population - Other Eastern Asia (%)
Place of birth for the foreign-born population - Afghanistan (%)
Place of birth for the foreign-born population - Bangladesh (%)
Place of birth for the foreign-born population - India (%)
Place of birth for the foreign-born population - Iran (%)
Place of birth for the foreign-born population - Kazakhstan (%)
Place of birth for the foreign-born population - Nepal (%)
Place of birth for the foreign-born population - Pakistan (%)
Place of birth for the foreign-born population - Sri Lanka (%)
Place of birth for the foreign-born population - Uzbekistan (%)
Place of birth for the foreign-born population - Other South Central Asia (%)
Place of birth for the foreign-born population - Burma (%)
Place of birth for the foreign-born population - Cambodia (%)
Place of birth for the foreign-born population - Indonesia (%)
Place of birth for the foreign-born population - Laos (%)
Place of birth for the foreign-born population - Malaysia (%)
Place of birth for the foreign-born population - Philippines (%)
Place of birth for the foreign-born population - Singapore (%)
Place of birth for the foreign-born population - Thailand (%)
Place of birth for the foreign-born population - Vietnam (%)
Place of birth for the foreign-born population - Other South Eastern Asia (%)
Place of birth for the foreign-born population - Armenia (%)
Place of birth for the foreign-born population - Iraq (%)
Place of birth for the foreign-born population - Israel (%)
Place of birth for the foreign-born population - Jordan (%)
Place of birth for the foreign-born population - Kuwait (%)
Place of birth for the foreign-born population - Lebanon (%)
Place of birth for the foreign-born population - Saudi Arabia (%)
Place of birth for the foreign-born population - Syria (%)
Place of birth for the foreign-born population - Turkey (%)
Place of birth for the foreign-born population - Yemen (%)
Place of birth for the foreign-born population - Other Western Asia (%)
Place of birth for the foreign-born population - Eritrea (%)
Place of birth for the foreign-born population - Ethiopia (%)
Place of birth for the foreign-born population - Kenya (%)
Place of birth for the foreign-born population - Somalia (%)
Place of birth for the foreign-born population - Uganda (%)
Place of birth for the foreign-born population - Zimbabwe (%)
Place of birth for the foreign-born population - Other Eastern Africa (%)
Place of birth for the foreign-born population - Cameroon (%)
Place of birth for the foreign-born population - Congo (%)
Place of birth for the foreign-born population - Democratic Republic of Congo (Zaire) (%)
Place of birth for the foreign-born population - Other Middle Africa (%)
Place of birth for the foreign-born population - Egypt (%)
Place of birth for the foreign-born population - Morocco (%)
Place of birth for the foreign-born population - Sudan (%)
Place of birth for the foreign-born population - Other Northern Africa (%)
Place of birth for the foreign-born population - South Africa (%)
Place of birth for the foreign-born population - Other Southern Africa (%)
Place of birth for the foreign-born population - Cabo Verde (%)
Place of birth for the foreign-born population - Ghana (%)
Place of birth for the foreign-born population - Liberia (%)
Place of birth for the foreign-born population - Nigeria (%)
Place of birth for the foreign-born population - Senegal (%)
Place of birth for the foreign-born population - Sierra Leone (%)
Place of birth for the foreign-born population - Other Western Africa (%)
Place of birth for the foreign-born population - Australia (%)
Place of birth for the foreign-born population - New Zealand (%)
Place of birth for the foreign-born population - Fiji (%)
Place of birth for the foreign-born population - Micronesia (%)
Place of birth for the foreign-born population - Bahamas (%)
Place of birth for the foreign-born population - Barbados (%)
Place of birth for the foreign-born population - Cuba (%)
Place of birth for the foreign-born population - Dominica (%)
Place of birth for the foreign-born population - Dominican Republic (%)
Place of birth for the foreign-born population - Grenada (%)
Place of birth for the foreign-born population - Haiti (%)
Place of birth for the foreign-born population - Jamaica (%)
Place of birth for the foreign-born population - St. Vincent and the Grenadines (%)
Place of birth for the foreign-born population - Trinidad and Tobago (%)
Place of birth for the foreign-born population - West Indies (%)
Place of birth for the foreign-born population - Other Caribbean (%)
Place of birth for the foreign-born population - Belize (%)
Place of birth for the foreign-born population - Costa Rica (%)
Place of birth for the foreign-born population - El Salvador (%)
Place of birth for the foreign-born population - Guatemala (%)
Place of birth for the foreign-born population - Honduras (%)
Place of birth for the foreign-born population - Mexico (%)
Place of birth for the foreign-born population - Nicaragua (%)
Place of birth for the foreign-born population - Panama (%)
Place of birth for the foreign-born population - Other Central America (%)
Place of birth for the foreign-born population - Argentina (%)
Place of birth for the foreign-born population - Bolivia (%)
Place of birth for the foreign-born population - Brazil (%)
Place of birth for the foreign-born population - Chile (%)
Place of birth for the foreign-born population - Colombia (%)
Place of birth for the foreign-born population - Ecuador (%)
Place of birth for the foreign-born population - Guyana (%)
Place of birth for the foreign-born population - Peru (%)
Place of birth for the foreign-born population - Uruguay (%)
Place of birth for the foreign-born population - Venezuela (%)
Place of birth for the foreign-born population - Other South America (%)
Place of birth for the foreign-born population - Canada (%)
Place of birth for the foreign-born population - Other Northern America (%)
Place of birth for the foreign-born population - Other (%)
Latest news about races in Duncan, OK collected exclusively by city-data.com from local newspapers, TV, and radio stations
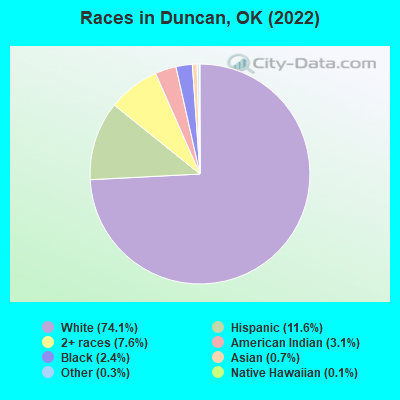
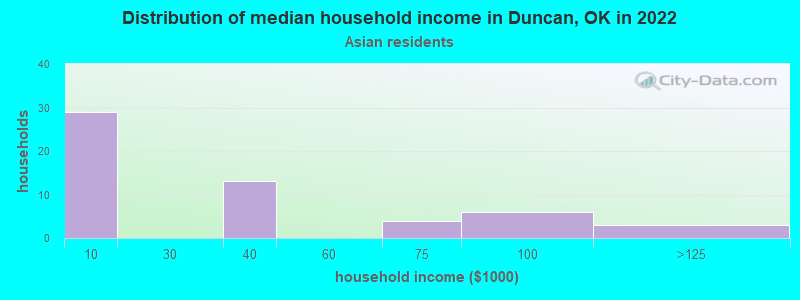
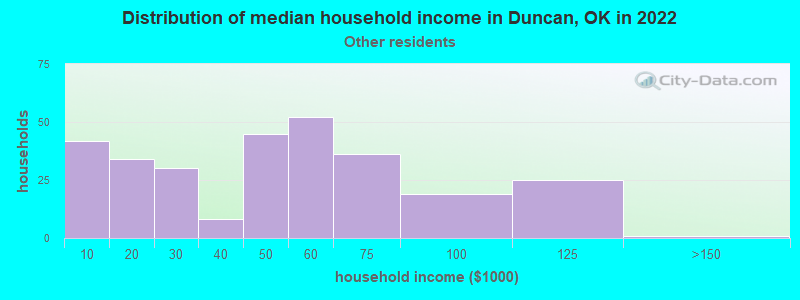
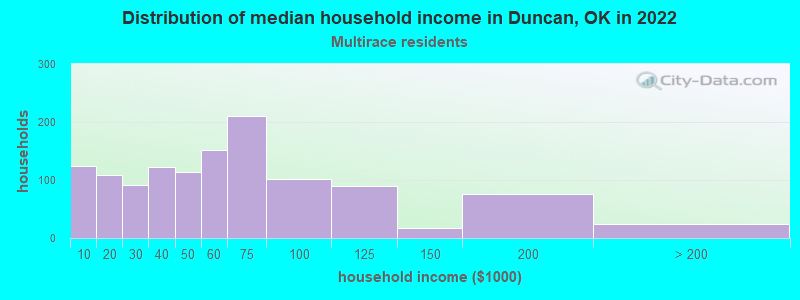
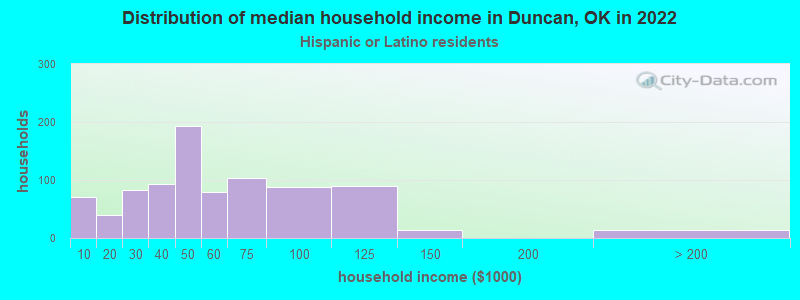
According to 2022 data, the most numerous races in Duncan, OK are White alone (17,077 residents), Hispanic (2,678 residents), and Two or more races (1,753 residents). 92.3% of Duncan residents speak English at home. 3.1% of Duncan, OK residents are foreign-born (2.1% born in Latin America, 0.5% born in Europe, 0.4% born in Asia), which is 92.8% less than the foreign-born rate of 6.0% across the entire state of Oklahoma.
Race distribution in Duncan
2000 2022
2,556,368 74.1% White alone 266,158 7.7% American Indian alone 257,981 7.5% Black alone 179,304 5.2% Hispanic 140,249 4.1% Two or more races 46,172 1.3% Asian alone 2,322 0.07% Other race alone 2,100 0.06% Native Hawaiian and Other
2,517,403 62.6% White alone 486,692 12.1% Hispanic 364,453 9.1% Two or more races 273,650 6.8% American Indian alone 268,543 6.7% Black alone 92,672 2.3% Asian alone 10,786 0.3% Other race alone 5,601 0.1% Native Hawaiian and Other
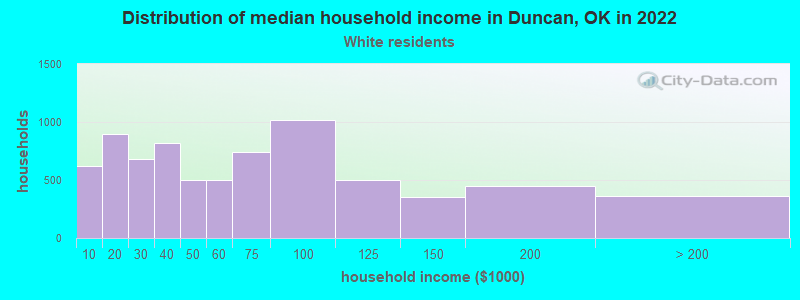
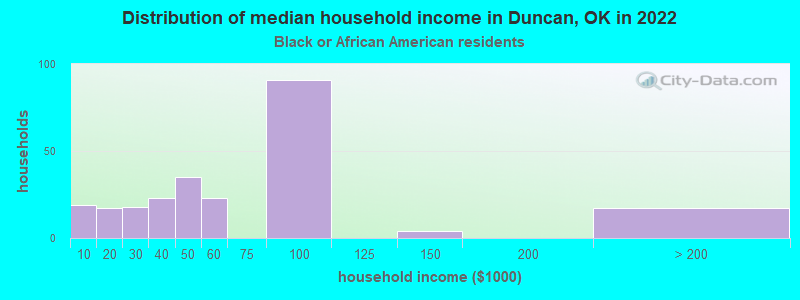
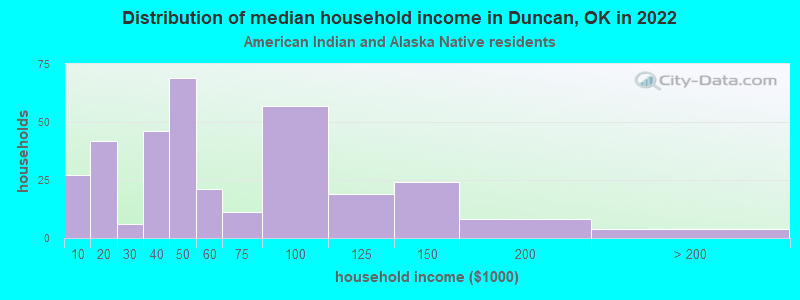
Income and house value in Duncan Median household income in 2022 $54,071 White non-Hispanic householders$50,068 Black householders$44,586 American Indian and Alaska Native householders$2,396 Asian householders$47,612 Some other race householders$55,825 Two or more races householders$46,598 Hispanic or Latino race householdersMedian 2022 house value $143,622 White Non-Hispanic householders$70,298 Black or African American householders$114,292 American Indian or Alaska Native householders$68,203 Some other race householders$152,002 Two or more races householders$72,858 Hispanic or Latino householders
Median age by race in Duncan
43.1 Median age for White residents41.0 46.4 39.9 Median age for Black or African American residents37.3 41.0 31.3 Median age for American Indian / Alaska Native residents30.8 31.9 38.6 Median age for Asian residents24.8 45.2 77.2 Median age for Native Hawaiian / Pacific Islander residents72.0 -767,251,461.2 26.4 Median age for Other race residents19.9 28.3 34.5 Median age for Two or more races residents30.5 38.3 43.8 Median age for White alone residents40.5 46.3 26.0 Median age for Hispanic or Latino residents27.2 26.1
Owner/renter occupied households by race in Duncan
House owners and renters - White residents 5,181 70.2% Owner occupied2,201 29.8% Renter occupiedHouse owners and renters - Black or African American residents 148 58.0% Owner occupied107 42.0% Renter occupiedHouse owners and renters - American Indian / Alaska Native residents 178 53.7% Owner occupied154 46.3% Renter occupiedHouse owners and renters - Asian residents 57 100.0% Owner occupiedHouse owners and renters - Native Hawaiian / Pacific Islander residents 38 100.0% Renter occupiedHouse owners and renters - Other race residents 109 38.4% Owner occupied174 61.6% Renter occupiedHouse owners and renters - Two or more races residents 754 62.5% Owner occupied452 37.5% Renter occupiedHouse owners and renters - White alone residents 5,183 70.8% Owner occupied2,138 29.2% Renter occupiedHouse owners and renters - Hispanic or Latino residents 385 44.8% Owner occupied474 55.2% Renter occupied
Language usage in Duncan
English speakers - Total 92.3% of residents of Duncan speak English at home.
6.3% of residents speak Spanish at home 919 67.6% Speak English very well441 32.4% Speak English less than very well1.4% of residents speak other language at home 197 63.5% Speak English very well113 36.5% Speak English less than very well
English speakers - Born in the United States 94.8% of residents of Duncan speak English at home.
4.7% of residents speak Spanish at home 257 74.9% Speak English very well86 25.1% Speak English less than very well0.6% of residents speak other language at home 46 100.0% Speak English very well
English speakers - Native, born elsewhere 72.4% of residents of Duncan speak English at home.
24.1% of residents speak Spanish at home 35 100.0% Speak English very well
English speakers - Foreign-born 8.5% of residents of Duncan speak English at home.
66.5% of residents speak Spanish at home 140 29.4% Speak English very well336 70.6% Speak English less than very well25.4% of residents speak other language at home 67 36.8% Speak English very well115 63.2% Speak English less than very well
White (Caucasian) - Speak only English Native:
99.5% (16,120)Foreign-born:
32.5% (45)
White (Caucasian) - Speak another language Native:
1.1% (182)Foreign-born:
67.1% (94)
Asian - Speak only English Native:
4.8% (3)Foreign-born:
3.3% (3)
Asian - Speak another language Native:
95.5% (67)Foreign-born:
97.5% (82)
Other race - Speak only English Native:
38.8% (246)Foreign-born:
1.7% (5)
Other race - Speak another language Native:
61.4% (389)Foreign-born:
98.3% (275)
Two or more races - Speak only English Native:
86.5% (2,270)Foreign-born:
3.7% (9)
Two or more races - Speak another language Native:
13.0% (340)Foreign-born:
97.5% (241)
White alone - Speak only English Native:
99.1% (15,869)Foreign-born:
34.3% (49)
White alone - Speak another language Native:
0.9% (149)Foreign-born:
64.8% (93)
Hispanic or Latino - Speak only English Native:
61.5% (1,225)Foreign-born:
2.5% (13)
Hispanic or Latino - Speak another language Native:
38.7% (771)Foreign-born:
97.1% (478)
Foreign-born residents in Duncan 717 residents are foreign born (2.1% Latin America , 0.5% Europe , 0.4% Asia ).
This city:
3.1%Oklahoma:
6.1%
Marital status for residents in Duncan Marital status - White (Caucasian) population 15 years and over
Males 27.3% Never married52.3% Now married2.1% Separated4.0% Widowed14.2% DivorcedFemales 19.0% Never married50.8% Now married1.1% Separated13.3% Widowed15.8% DivorcedWomen who gave birth in the past 12 months Now married:
58.2% (154)Unmarried:
41.8% (111)
Women who did not give birth in the past 12 months Now married:
50.7% (1,708)Unmarried:
49.3% (1,663)
Marital status - Black or African American population 15 years and over
Males 45.7% Never married33.4% Now married0.0% Separated9.3% Widowed11.6% DivorcedFemales 30.4% Never married38.7% Now married8.3% Separated16.1% Widowed6.5% DivorcedWomen who did not give birth in the past 12 months Now married:
40.5% (48)Unmarried:
59.5% (70)
Marital status - American Indian / Alaska Native population 15 years and over
Males 30.1% Never married41.2% Now married2.7% Separated4.0% Widowed22.1% DivorcedFemales 30.7% Never married46.1% Now married5.4% Separated6.3% Widowed11.5% DivorcedWomen who gave birth in the past 12 months Now married:
39.1% (18)Unmarried:
60.9% (29)
Women who did not give birth in the past 12 months Now married:
40.2% (82)Unmarried:
59.8% (121)
Marital status - Asian population 15 years and over
Males 46.9% Never married53.1% Now married0.0% Separated0.0% Widowed0.0% DivorcedFemales 16.2% Never married83.8% Now married0.0% Separated0.0% Widowed0.0% DivorcedWomen who did not give birth in the past 12 months Now married:
82.6% (19)Unmarried:
17.4% (4)
Marital status - Native Hawaiian / Pacific Islander population 15 years and over
Males 36.5% Never married63.5% Now married0.0% Separated0.0% Widowed0.0% DivorcedFemales 0.0% Never married0.0% Now married0.0% Separated100.0% Widowed0.0% DivorcedWomen who did not give birth in the past 12 months Now married:
0.0% (0)Unmarried:
100.0% (6)
Marital status - Other race population 15 years and over
Males 37.5% Never married48.1% Now married4.5% Separated8.3% Widowed1.6% DivorcedFemales 28.4% Never married48.7% Now married2.9% Separated19.9% Widowed0.0% DivorcedWomen who gave birth in the past 12 months Now married:
100.0% (24)Unmarried:
0.0% (0)
Women who did not give birth in the past 12 months Now married:
55.6% (155)Unmarried:
44.4% (124)
Marital status - Two or more races population 15 years and over
Males 41.6% Never married36.0% Now married1.1% Separated2.3% Widowed18.9% DivorcedFemales 27.3% Never married37.3% Now married1.4% Separated8.5% Widowed25.5% DivorcedWomen who gave birth in the past 12 months Now married:
69.2% (24)Unmarried:
30.8% (11)
Women who did not give birth in the past 12 months Now married:
41.9% (264)Unmarried:
58.1% (367)
Marital status - White alone, not Hispanic / Latino population 15 years and over
Males 27.0% Never married52.6% Now married2.2% Separated4.2% Widowed14.1% DivorcedFemales 18.2% Never married51.2% Now married0.9% Separated13.7% Widowed16.0% DivorcedWomen who gave birth in the past 12 months Now married:
58.0% (145)Unmarried:
42.0% (105)
Women who did not give birth in the past 12 months Now married:
51.8% (1,723)Unmarried:
48.2% (1,604)
Marital status - Hispanic or Latino population 15 years and over
Males 41.5% Never married45.9% Now married1.6% Separated3.0% Widowed7.9% DivorcedFemales 33.9% Never married42.9% Now married3.0% Separated6.2% Widowed14.0% DivorcedWomen who gave birth in the past 12 months Now married:
78.3% (39)Unmarried:
21.7% (11)
Women who did not give birth in the past 12 months Now married:
44.2% (304)Unmarried:
55.8% (384)
Ancestries in Duncan
1,802 15.2% American1,550 13.1% English1,164 9.8% Irish626 5.3% German172 1.5% European128 1.1% Welsh122 1.0% French111 0.9% Scotch-Irish82 0.7% Albanian73 0.6% Dutch66 0.6% Norwegian41 0.3% Scottish40 0.3% Northern European31 0.3% Israeli28 0.2% African26 0.2% Italian24 0.2% Eastern European22 0.2% Jamaican20 0.2% Scandinavian19 0.2% South African17 0.1% Swedish13 0.1% Polish10 0.08% British6 0.05% Cajun6 0.05% Portuguese5 0.04% Slovak1 0.01% Russian
Geographical mobility in Duncan Same house 1 year ago 14,550 85.8% White (Caucasian)528 86.0% Black or African American683 77.9% American Indian / Alaska Native155 100.0% Asian76 100.0% Native Hawaiian / Pacific Islander838 84.2% Other race2,516 82.9% Two or more races14,554 86.1% White alone, not Hispanic / Latino2,206 84.7% Hispanic or LatinoMoved within same county 1,206 7.1% White / Caucasian64 10.4% Black or African American77 8.8% American Indian / Alaska Native137 13.8% Other race330 10.9% Two or more races1,209 7.2% White alone, not Hispanic / Latino256 9.8% Hispanic or LatinoMoved within same state 558 3.3% White / Caucasian14 2.3% Black or African American39 4.5% American Indian / Alaska Native124 4.1% Two or more races546 3.2% White alone, not Hispanic / Latino34 1.3% Hispanic or LatinoMoved from different state 541 3.2% White / Caucasian3 0.5% Black or African American84 9.5% American Indian / Alaska Native44 1.4% Two or more races483 2.9% White alone, not Hispanic / Latino98 3.8% Hispanic or LatinoMoved from abroad 78 0.5% White97 0.6% White alone, not Hispanic / Latino
Children Nativity (place of birth) in Duncan
Children under 6 years - Living with two parents Both parents native 723 100.0% NativeBoth parents foreign-born 55 100.0% NativeOne native, one foreign-born parent 56 100.0% NativeChildren under 6 years - Living with one parent Native parent 799 100.0% NativeChildren 6 to 17 years - Living with two parents Both parents native 1,951 99.9% Native1 0.1% Foreign-bornBoth parents foreign-born 148 77.0% Native44 23.0% Foreign-bornOne native, one foreign-born parent 151 100.0% NativeChildren 6 to 17 years - Living with one parent Native parent 856 100.0% Native
Grandparents responsible for own grandchildren in Duncan
Grandparents (30 to 59 years) White / Caucasian 74 47.2% Responsible for grandchildren83 52.8% Not responsible for grandchildrenAmerican Indian / Alaska Native 23 100.0% Not responsible for grandchildrenTwo or more races 30 100.0% Responsible for grandchildrenWhite alone, not Hispanic / Latino 77 45.8% Responsible for grandchildren91 54.2% Not responsible for grandchildrenGrandparents (60 years and over) White / Caucasian 16 20.9% Responsible for grandchildren60 79.1% Not responsible for grandchildrenAmerican Indian / Alaska Native 20 67.0% Responsible for grandchildren10 33.0% Not responsible for grandchildrenTwo or more races 16 100.0% Not responsible for grandchildrenWhite alone, not Hispanic / Latino 16 20.2% Responsible for grandchildren63 79.8% Not responsible for grandchildren