Races in Dunellen, New Jersey (NJ) Detailed Stats
Data:
Races - White alone (%)
Races - White alone (% change since 2000)
Races - Black alone (%)
Races - Black alone (% change since 2000)
Races - American Indian alone (%)
Races - American Indian alone (% change since 2000)
Races - Asian alone (%)
Races - Asian alone (% change since 2000)
Races - Hispanic (%)
Races - Hispanic (% change since 2000)
Races - Native Hawaiian and Other Pacific Islander alone (%)
Races - Native Hawaiian and Other Pacific Islander alone (% change since 2000)
Races - Two or more races(%)
Races - Two or more races(% change since 2000)
Races - Other race alone (%)
Races - Other race alone (% change since 2000)
Racial diversity
Place of birth - Born in state of residence (%)
Place of birth - Born in state of residence (%) - White
Place of birth - Born in state of residence (%) - Black or African American
Place of birth - Born in state of residence (%) - Asian
Place of birth - Born in state of residence (%) - Hispanic or Latino
Place of birth - Born in state of residence (%) - American Indian and Alaska Native
Place of birth - Born in state of residence (%) - Multirace
Place of birth - Born in state of residence (%) - Other Race
Place of birth - Born in other state (%)
Place of birth - Born in other state (%) - White
Place of birth - Born in other state (%) - Black or African American
Place of birth - Born in other state (%) - Asian
Place of birth - Born in other state (%) - Hispanic or Latino
Place of birth - Born in other state (%) - American Indian and Alaska Native
Place of birth - Born in other state (%) - Multirace
Place of birth - Born in other state (%) - Other Race
Place of birth - Native, outside of US (%)
Place of birth - Native, outside of US (%) - White
Place of birth - Native, outside of US (%) - Black or African American
Place of birth - Native, outside of US (%) - Asian
Place of birth - Native, outside of US (%) - Hispanic or Latino
Place of birth - Native, outside of US (%) - American Indian and Alaska Native
Place of birth - Native, outside of US (%) - Multirace
Place of birth - Native, outside of US (%) - Other Race
Place of birth - Foreign born (%)
Place of birth - Foreign born (%) - White
Place of birth - Foreign born (%) - Black or African American
Place of birth - Foreign born (%) - Asian
Place of birth - Foreign born (%) - Hispanic or Latino
Place of birth - Foreign born (%) - American Indian and Alaska Native
Place of birth - Foreign born (%) - Multirace
Place of birth - Foreign born (%) - Other Race
Residents speaking English at home (%)
Residents speaking English at home - Born in the United States (%)
Residents speaking English at home - Native, born elsewhere (%)
Residents speaking English at home - Foreign born (%)
Residents speaking Spanish at home (%)
Residents speaking Spanish at home - Born in the United States (%)
Residents speaking Spanish at home - Native, born elsewhere (%)
Residents speaking Spanish at home - Foreign born (%)
Residents speaking other language at home (%)
Residents speaking other language at home - Born in the United States (%)
Residents speaking other language at home - Native, born elsewhere (%)
Residents speaking other language at home - Foreign born (%)
Marital status - Never married (%)
Marital status - Now married (%)
Marital status - Separated (%)
Marital status - Widowed (%)
Marital status - Divorced (%)
Ancestries Reported - Arab (%)
Ancestries Reported - Czech (%)
Ancestries Reported - Danish (%)
Ancestries Reported - Dutch (%)
Ancestries Reported - English (%)
Ancestries Reported - French (%)
Ancestries Reported - French Canadian (%)
Ancestries Reported - German (%)
Ancestries Reported - Greek (%)
Ancestries Reported - Hungarian (%)
Ancestries Reported - Irish (%)
Ancestries Reported - Italian (%)
Ancestries Reported - Lithuanian (%)
Ancestries Reported - Norwegian (%)
Ancestries Reported - Polish (%)
Ancestries Reported - Portuguese (%)
Ancestries Reported - Russian (%)
Ancestries Reported - Scotch-Irish (%)
Ancestries Reported - Scottish (%)
Ancestries Reported - Slovak (%)
Ancestries Reported - Subsaharan African (%)
Ancestries Reported - Swedish (%)
Ancestries Reported - Swiss (%)
Ancestries Reported - Ukrainian (%)
Ancestries Reported - United States (%)
Ancestries Reported - Welsh (%)
Ancestries Reported - West Indian (%)
Ancestries Reported - Other (%)
Geographical mobility - Same house 1 year ago (%)
Geographical mobility - Same house 1 year ago (%) - White
Geographical mobility - Same house 1 year ago (%) - Black or African American
Geographical mobility - Same house 1 year ago (%) - Asian
Geographical mobility - Same house 1 year ago (%) - Hispanic or Latino
Geographical mobility - Same house 1 year ago (%) - American Indian and Alaska Native
Geographical mobility - Same house 1 year ago (%) - Multirace
Geographical mobility - Same house 1 year ago (%) - Other Race
Geographical mobility - Moved within same county (%)
Geographical mobility - Moved within same county (%) - White
Geographical mobility - Moved within same county (%) - Black or African American
Geographical mobility - Moved within same county (%) - Asian
Geographical mobility - Moved within same county (%) - Hispanic or Latino
Geographical mobility - Moved within same county (%) - American Indian and Alaska Native
Geographical mobility - Moved within same county (%) - Multirace
Geographical mobility - Moved within same county (%) - Other Race
Geographical mobility - Moved from different county within same state (%)
Geographical mobility - Moved from different county within same state (%) - White
Geographical mobility - Moved from different county within same state (%) - Black or African American
Geographical mobility - Moved from different county within same state (%) - Asian
Geographical mobility - Moved from different county within same state (%) - Hispanic or Latino
Geographical mobility - Moved from different county within same state (%) - American Indian and Alaska Native
Geographical mobility - Moved from different county within same state (%) - Multirace
Geographical mobility - Moved from different county within same state (%) - Other Race
Geographical mobility - Moved from different state (%)
Geographical mobility - Moved from different state (%) - White
Geographical mobility - Moved from different state (%) - Black or African American
Geographical mobility - Moved from different state (%) - Asian
Geographical mobility - Moved from different state (%) - Hispanic or Latino
Geographical mobility - Moved from different state (%) - American Indian and Alaska Native
Geographical mobility - Moved from different state (%) - Multirace
Geographical mobility - Moved from different state (%) - Other Race
Geographical mobility - Moved from abroad (%)
Geographical mobility - Moved from abroad (%) - White
Geographical mobility - Moved from abroad (%) - Black or African American
Geographical mobility - Moved from abroad (%) - Asian
Geographical mobility - Moved from abroad (%) - Hispanic or Latino
Geographical mobility - Moved from abroad (%) - American Indian and Alaska Native
Geographical mobility - Moved from abroad (%) - Multirace
Geographical mobility - Moved from abroad (%) - Other Race
Place of birth for the foreign-born population - Ireland (%)
Place of birth for the foreign-born population - Denmark (%)
Place of birth for the foreign-born population - Norway (%)
Place of birth for the foreign-born population - Sweden (%)
Place of birth for the foreign-born population - United Kingdom (%)
Place of birth for the foreign-born population - England (%)
Place of birth for the foreign-born population - Scotland (%)
Place of birth for the foreign-born population - Other Northern Europe (%)
Place of birth for the foreign-born population - Austria (%)
Place of birth for the foreign-born population - Belgium (%)
Place of birth for the foreign-born population - France (%)
Place of birth for the foreign-born population - Germany (%)
Place of birth for the foreign-born population - Netherlands (%)
Place of birth for the foreign-born population - Switzerland (%)
Place of birth for the foreign-born population - Other Western Europe (%)
Place of birth for the foreign-born population - Greece (%)
Place of birth for the foreign-born population - Italy (%)
Place of birth for the foreign-born population - Portugal (%)
Place of birth for the foreign-born population - Spain (%)
Place of birth for the foreign-born population - Other Southern Europe (%)
Place of birth for the foreign-born population - Albania (%)
Place of birth for the foreign-born population - Belarus (%)
Place of birth for the foreign-born population - Bosnia and Herzegovina (%)
Place of birth for the foreign-born population - Bulgaria (%)
Place of birth for the foreign-born population - Croatia (%)
Place of birth for the foreign-born population - Czechoslovakia (%)
Place of birth for the foreign-born population - Hungary (%)
Place of birth for the foreign-born population - Latvia (%)
Place of birth for the foreign-born population - Lithuania (%)
Place of birth for the foreign-born population - North Macedonia (Macedonia) (%)
Place of birth for the foreign-born population - Moldova (%)
Place of birth for the foreign-born population - Poland (%)
Place of birth for the foreign-born population - Romania (%)
Place of birth for the foreign-born population - Russia (%)
Place of birth for the foreign-born population - Serbia (%)
Place of birth for the foreign-born population - Ukraine (%)
Place of birth for the foreign-born population - Other Eastern Europe (%)
Place of birth for the foreign-born population - China (%)
Place of birth for the foreign-born population - Hong Kong (%)
Place of birth for the foreign-born population - Taiwan (%)
Place of birth for the foreign-born population - Japan (%)
Place of birth for the foreign-born population - Korea (%)
Place of birth for the foreign-born population - Other Eastern Asia (%)
Place of birth for the foreign-born population - Afghanistan (%)
Place of birth for the foreign-born population - Bangladesh (%)
Place of birth for the foreign-born population - India (%)
Place of birth for the foreign-born population - Iran (%)
Place of birth for the foreign-born population - Kazakhstan (%)
Place of birth for the foreign-born population - Nepal (%)
Place of birth for the foreign-born population - Pakistan (%)
Place of birth for the foreign-born population - Sri Lanka (%)
Place of birth for the foreign-born population - Uzbekistan (%)
Place of birth for the foreign-born population - Other South Central Asia (%)
Place of birth for the foreign-born population - Burma (%)
Place of birth for the foreign-born population - Cambodia (%)
Place of birth for the foreign-born population - Indonesia (%)
Place of birth for the foreign-born population - Laos (%)
Place of birth for the foreign-born population - Malaysia (%)
Place of birth for the foreign-born population - Philippines (%)
Place of birth for the foreign-born population - Singapore (%)
Place of birth for the foreign-born population - Thailand (%)
Place of birth for the foreign-born population - Vietnam (%)
Place of birth for the foreign-born population - Other South Eastern Asia (%)
Place of birth for the foreign-born population - Armenia (%)
Place of birth for the foreign-born population - Iraq (%)
Place of birth for the foreign-born population - Israel (%)
Place of birth for the foreign-born population - Jordan (%)
Place of birth for the foreign-born population - Kuwait (%)
Place of birth for the foreign-born population - Lebanon (%)
Place of birth for the foreign-born population - Saudi Arabia (%)
Place of birth for the foreign-born population - Syria (%)
Place of birth for the foreign-born population - Turkey (%)
Place of birth for the foreign-born population - Yemen (%)
Place of birth for the foreign-born population - Other Western Asia (%)
Place of birth for the foreign-born population - Eritrea (%)
Place of birth for the foreign-born population - Ethiopia (%)
Place of birth for the foreign-born population - Kenya (%)
Place of birth for the foreign-born population - Somalia (%)
Place of birth for the foreign-born population - Uganda (%)
Place of birth for the foreign-born population - Zimbabwe (%)
Place of birth for the foreign-born population - Other Eastern Africa (%)
Place of birth for the foreign-born population - Cameroon (%)
Place of birth for the foreign-born population - Congo (%)
Place of birth for the foreign-born population - Democratic Republic of Congo (Zaire) (%)
Place of birth for the foreign-born population - Other Middle Africa (%)
Place of birth for the foreign-born population - Egypt (%)
Place of birth for the foreign-born population - Morocco (%)
Place of birth for the foreign-born population - Sudan (%)
Place of birth for the foreign-born population - Other Northern Africa (%)
Place of birth for the foreign-born population - South Africa (%)
Place of birth for the foreign-born population - Other Southern Africa (%)
Place of birth for the foreign-born population - Cabo Verde (%)
Place of birth for the foreign-born population - Ghana (%)
Place of birth for the foreign-born population - Liberia (%)
Place of birth for the foreign-born population - Nigeria (%)
Place of birth for the foreign-born population - Senegal (%)
Place of birth for the foreign-born population - Sierra Leone (%)
Place of birth for the foreign-born population - Other Western Africa (%)
Place of birth for the foreign-born population - Australia (%)
Place of birth for the foreign-born population - New Zealand (%)
Place of birth for the foreign-born population - Fiji (%)
Place of birth for the foreign-born population - Micronesia (%)
Place of birth for the foreign-born population - Bahamas (%)
Place of birth for the foreign-born population - Barbados (%)
Place of birth for the foreign-born population - Cuba (%)
Place of birth for the foreign-born population - Dominica (%)
Place of birth for the foreign-born population - Dominican Republic (%)
Place of birth for the foreign-born population - Grenada (%)
Place of birth for the foreign-born population - Haiti (%)
Place of birth for the foreign-born population - Jamaica (%)
Place of birth for the foreign-born population - St. Vincent and the Grenadines (%)
Place of birth for the foreign-born population - Trinidad and Tobago (%)
Place of birth for the foreign-born population - West Indies (%)
Place of birth for the foreign-born population - Other Caribbean (%)
Place of birth for the foreign-born population - Belize (%)
Place of birth for the foreign-born population - Costa Rica (%)
Place of birth for the foreign-born population - El Salvador (%)
Place of birth for the foreign-born population - Guatemala (%)
Place of birth for the foreign-born population - Honduras (%)
Place of birth for the foreign-born population - Mexico (%)
Place of birth for the foreign-born population - Nicaragua (%)
Place of birth for the foreign-born population - Panama (%)
Place of birth for the foreign-born population - Other Central America (%)
Place of birth for the foreign-born population - Argentina (%)
Place of birth for the foreign-born population - Bolivia (%)
Place of birth for the foreign-born population - Brazil (%)
Place of birth for the foreign-born population - Chile (%)
Place of birth for the foreign-born population - Colombia (%)
Place of birth for the foreign-born population - Ecuador (%)
Place of birth for the foreign-born population - Guyana (%)
Place of birth for the foreign-born population - Peru (%)
Place of birth for the foreign-born population - Uruguay (%)
Place of birth for the foreign-born population - Venezuela (%)
Place of birth for the foreign-born population - Other South America (%)
Place of birth for the foreign-born population - Canada (%)
Place of birth for the foreign-born population - Other Northern America (%)
Place of birth for the foreign-born population - Other (%)
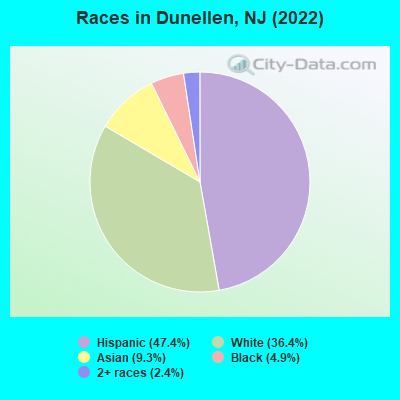
According to 2022 data, the most numerous races in Dunellen, NJ are White alone (2,767 residents), Hispanic (3,608 residents), and Black alone (370 residents). 46.7% of Dunellen residents speak English at home. 36.6% of Dunellen, NJ residents are foreign-born (26.0% born in Latin America, 7.8% born in Asia), which is 37.1% greater than the foreign-born rate of 23.0% across the entire state of New Jersey.
Race distribution in Dunellen
2000 2022
5,557,209 66.0% White alone 1,117,191 13.3% Hispanic 1,096,171 13.0% Black alone 477,012 5.7% Asian alone 133,689 1.6% Two or more races 19,565 0.2% Other race alone 11,338 0.1% American Indian alone 2,175 0.03% Native Hawaiian and Other
4,766,476 51.5% White alone 2,028,470 21.9% Hispanic 1,111,632 12.0% Black alone 923,546 10.0% Asian alone 332,237 3.6% Two or more races 89,847 1.0% Other race alone 8,557 0.09% American Indian alone 934 0.01% Native Hawaiian and Other
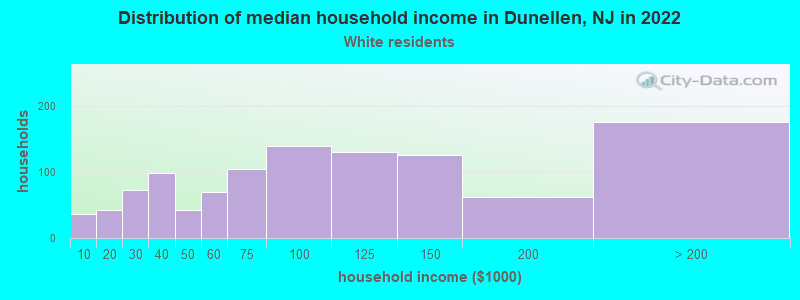
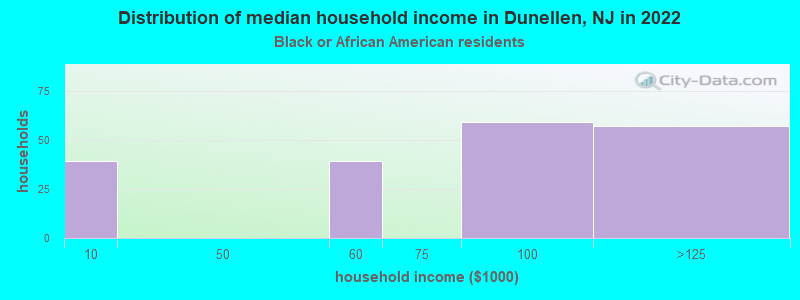
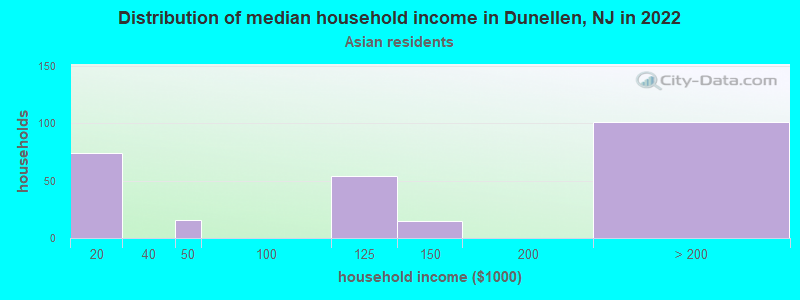
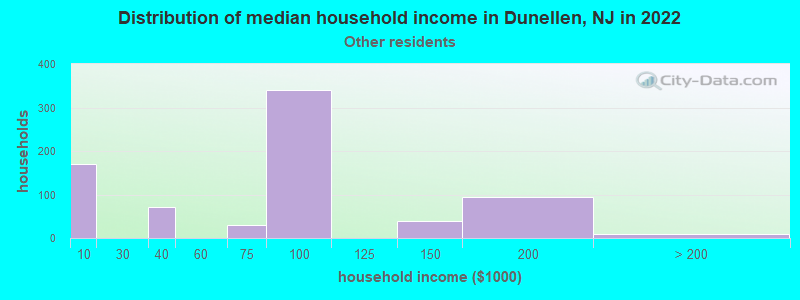
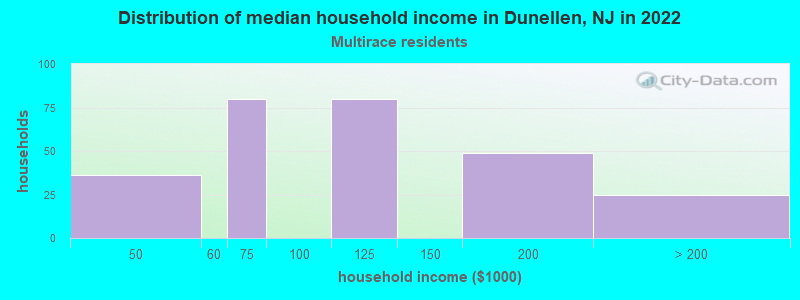
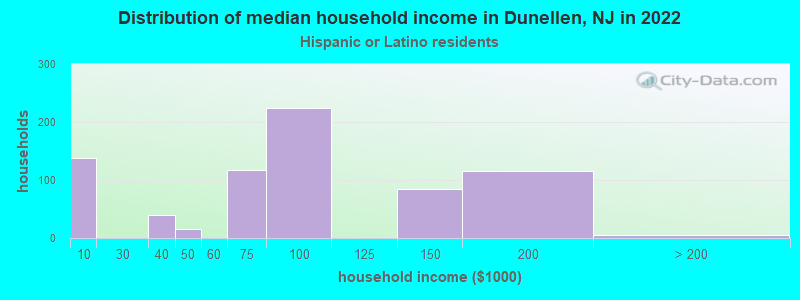
Income and house value in Dunellen Median household income in 2022 $86,727 White non-Hispanic householders$88,675 Black householders$77,409 Some other race householders$108,530 Two or more races householders$81,800 Hispanic or Latino race householdersMedian 2022 house value $383,727 White Non-Hispanic householders$460,325 Black or African American householders $328,488 Asian householders$342,236 Some other race householders$377,835 Hispanic or Latino householders
Median age by race in Dunellen
44.7 Median age for White residents40.7 45.6 50.7 Median age for Black or African American residents37.6 52.1 -673,036,092.7 Median age for American Indian / Alaska Native residents-624,624,624.0 -739,999,999.3 59.5 Median age for Asian residents59.7 59.3 -939,393,938.5 Median age for Native Hawaiian / Pacific Islander residents-860,335,194.7 -713,070,378.3 37.0 Median age for Other race residents35.9 36.9 13.8 Median age for Two or more races residents13.9 40.0 43.4 Median age for White alone residents42.0 50.6 32.9 Median age for Hispanic or Latino residents24.1 36.2
Owner/renter occupied households by race in Dunellen
House owners and renters - White residents 920 81.8% Owner occupied205 18.2% Renter occupiedHouse owners and renters - Black or African American residents 80 45.7% Owner occupied95 54.3% Renter occupiedHouse owners and renters - Asian residents 173 61.8% Owner occupied107 38.2% Renter occupiedHouse owners and renters - Other race residents 211 26.2% Owner occupied595 73.8% Renter occupiedHouse owners and renters - Two or more races residents 278 93.8% Owner occupied18 6.2% Renter occupiedHouse owners and renters - White alone residents 909 80.6% Owner occupied218 19.4% Renter occupiedHouse owners and renters - Hispanic or Latino residents 331 44.2% Owner occupied418 55.8% Renter occupied
Language usage in Dunellen
English speakers - Total 46.7% of residents of Dunellen speak English at home.
35.3% of residents speak Spanish at home 1,521 58.6% Speak English very well1,073 41.4% Speak English less than very well17.1% of residents speak other language at home 702 55.8% Speak English very well555 44.2% Speak English less than very well
English speakers - Born in the United States 58.3% of residents of Dunellen speak English at home.
33.7% of residents speak Spanish at home 240 95.2% Speak English very well12 4.8% Speak English less than very well4.3% of residents speak other language at home 32 100.0% Speak English very well
English speakers - Foreign-born 14.5% of residents of Dunellen speak English at home.
63.7% of residents speak Spanish at home 742 40.6% Speak English very well1,086 59.4% Speak English less than very well24.9% of residents speak other language at home 170 23.8% Speak English very well544 76.2% Speak English less than very well
White (Caucasian) - Speak another language Native:
9.4% (241)Foreign-born:
92.9% (152)
Black or African American - Speak only English Native:
100.0% (153)Foreign-born:
82.2% (188)
Asian - Speak only English Native:
19.3% (28)Foreign-born:
3.0% (17)
Asian - Speak another language Native:
81.6% (120)Foreign-born:
96.4% (523)
Other race - Speak only English Native:
27.8% (237)Foreign-born:
11.3% (286)
Other race - Speak another language Native:
71.4% (608)Foreign-born:
90.0% (2,274)
Two or more races - Speak only English Native:
39.1% (356)Foreign-born:
23.9% (52)
Two or more races - Speak another language Native:
61.8% (564)Foreign-born:
75.7% (165)
White alone - Speak another language Native:
11.3% (286)Foreign-born:
97.9% (163)
Hispanic or Latino - Speak only English Native:
39.4% (549)Foreign-born:
13.6% (289)
Hispanic or Latino - Speak another language Native:
60.6% (843)Foreign-born:
88.6% (1,879)
Foreign-born residents in Dunellen 2,782 residents are foreign born (26.0% Latin America , 7.8% Asia ).
This city:
36.6%New Jersey:
23.2%
Marital status for residents in Dunellen Marital status - White (Caucasian) population 15 years and over
Males 39.6% Never married42.4% Now married1.6% Separated0.9% Widowed15.5% DivorcedFemales 34.1% Never married41.6% Now married0.0% Separated15.1% Widowed9.2% DivorcedWomen who gave birth in the past 12 months Now married:
100.0% (18)Unmarried:
0.0% (0)
Women who did not give birth in the past 12 months Now married:
47.2% (272)Unmarried:
52.8% (304)
Marital status - Black or African American population 15 years and over
Males 25.0% Never married28.7% Now married0.0% Separated9.7% Widowed36.6% DivorcedFemales 29.0% Never married40.2% Now married0.0% Separated22.4% Widowed8.4% DivorcedWomen who did not give birth in the past 12 months Now married:
31.1% (15)Unmarried:
68.9% (33)
Marital status - Asian population 15 years and over
Males 0.7% Never married99.3% Now married0.0% Separated0.0% Widowed0.0% DivorcedFemales 9.3% Never married90.7% Now married0.0% Separated0.0% Widowed0.0% DivorcedWomen who gave birth in the past 12 months Now married:
100.0% (16)Unmarried:
0.0% (0)
Women who did not give birth in the past 12 months Now married:
100.0% (56)Unmarried:
0.0% (0)
Marital status - Other race population 15 years and over
Males 73.6% Never married26.4% Now married0.0% Separated0.0% Widowed0.0% DivorcedFemales 43.7% Never married40.0% Now married4.4% Separated2.9% Widowed8.9% DivorcedWomen who did not give birth in the past 12 months Now married:
43.8% (367)Unmarried:
56.2% (471)
Marital status - Two or more races population 15 years and over
Males 33.0% Never married67.0% Now married0.0% Separated0.0% Widowed0.0% DivorcedFemales 35.7% Never married34.9% Now married0.0% Separated0.0% Widowed29.5% DivorcedWomen who did not give birth in the past 12 months Now married:
37.0% (36)Unmarried:
63.0% (61)
Marital status - White alone, not Hispanic / Latino population 15 years and over
Males 40.2% Never married44.0% Now married1.6% Separated1.0% Widowed13.2% DivorcedFemales 34.7% Never married38.6% Now married0.0% Separated16.6% Widowed10.1% DivorcedWomen who gave birth in the past 12 months Now married:
100.0% (21)Unmarried:
0.0% (0)
Women who did not give birth in the past 12 months Now married:
42.0% (242)Unmarried:
58.0% (335)
Marital status - Hispanic or Latino population 15 years and over
Males 66.3% Never married31.3% Now married0.0% Separated0.0% Widowed2.4% DivorcedFemales 41.5% Never married42.4% Now married3.4% Separated2.3% Widowed10.3% DivorcedWomen who did not give birth in the past 12 months Now married:
48.0% (387)Unmarried:
52.0% (419)
Ancestries in Dunellen
391 8.6% Italian361 7.9% Egyptian230 5.1% American128 2.8% Jamaican118 2.6% Polish37 0.8% Slovak28 0.6% Irish21 0.5% Guyanese20 0.4% German20 0.4% African12 0.3% English12 0.3% Russian
Children Nativity (place of birth) in Dunellen
Children under 6 years - Living with two parents Both parents native 52 100.0% NativeOne native, one foreign-born parent 75 100.0% NativeChildren under 6 years - Living with one parent Native parent 109 100.0% NativeForeign-born parent 119 100.0% NativeChildren 6 to 17 years - Living with two parents Both parents native 626 100.0% NativeBoth parents foreign-born 307 69.2% Native137 30.8% Foreign-bornOne native, one foreign-born parent 103 100.0% NativeChildren 6 to 17 years - Living with one parent Native parent 73 100.0% NativeForeign-born parent 256 52.6% Native230 47.4% Foreign-born
Grandparents responsible for own grandchildren in Dunellen
Grandparents (30 to 59 years) White / Caucasian 20 100.0% Not responsible for grandchildrenOther race 11 100.0% Not responsible for grandchildrenWhite alone, not Hispanic / Latino 24 100.0% Not responsible for grandchildrenHispanic or Latino 10 100.0% Not responsible for grandchildren
Grandparents (60 years and over) Hispanic or Latino 20 100.0% Responsible for grandchildren