Races in Dunwoody, Georgia (GA) Detailed Stats
Data:
Races - White alone (%)
Races - White alone (% change since 2000)
Races - Black alone (%)
Races - Black alone (% change since 2000)
Races - American Indian alone (%)
Races - American Indian alone (% change since 2000)
Races - Asian alone (%)
Races - Asian alone (% change since 2000)
Races - Hispanic (%)
Races - Hispanic (% change since 2000)
Races - Native Hawaiian and Other Pacific Islander alone (%)
Races - Native Hawaiian and Other Pacific Islander alone (% change since 2000)
Races - Two or more races(%)
Races - Two or more races(% change since 2000)
Races - Other race alone (%)
Races - Other race alone (% change since 2000)
Racial diversity
Place of birth - Born in state of residence (%)
Place of birth - Born in state of residence (%) - White
Place of birth - Born in state of residence (%) - Black or African American
Place of birth - Born in state of residence (%) - Asian
Place of birth - Born in state of residence (%) - Hispanic or Latino
Place of birth - Born in state of residence (%) - American Indian and Alaska Native
Place of birth - Born in state of residence (%) - Multirace
Place of birth - Born in state of residence (%) - Other Race
Place of birth - Born in other state (%)
Place of birth - Born in other state (%) - White
Place of birth - Born in other state (%) - Black or African American
Place of birth - Born in other state (%) - Asian
Place of birth - Born in other state (%) - Hispanic or Latino
Place of birth - Born in other state (%) - American Indian and Alaska Native
Place of birth - Born in other state (%) - Multirace
Place of birth - Born in other state (%) - Other Race
Place of birth - Native, outside of US (%)
Place of birth - Native, outside of US (%) - White
Place of birth - Native, outside of US (%) - Black or African American
Place of birth - Native, outside of US (%) - Asian
Place of birth - Native, outside of US (%) - Hispanic or Latino
Place of birth - Native, outside of US (%) - American Indian and Alaska Native
Place of birth - Native, outside of US (%) - Multirace
Place of birth - Native, outside of US (%) - Other Race
Place of birth - Foreign born (%)
Place of birth - Foreign born (%) - White
Place of birth - Foreign born (%) - Black or African American
Place of birth - Foreign born (%) - Asian
Place of birth - Foreign born (%) - Hispanic or Latino
Place of birth - Foreign born (%) - American Indian and Alaska Native
Place of birth - Foreign born (%) - Multirace
Place of birth - Foreign born (%) - Other Race
Residents speaking English at home (%)
Residents speaking English at home - Born in the United States (%)
Residents speaking English at home - Native, born elsewhere (%)
Residents speaking English at home - Foreign born (%)
Residents speaking Spanish at home (%)
Residents speaking Spanish at home - Born in the United States (%)
Residents speaking Spanish at home - Native, born elsewhere (%)
Residents speaking Spanish at home - Foreign born (%)
Residents speaking other language at home (%)
Residents speaking other language at home - Born in the United States (%)
Residents speaking other language at home - Native, born elsewhere (%)
Residents speaking other language at home - Foreign born (%)
Marital status - Never married (%)
Marital status - Now married (%)
Marital status - Separated (%)
Marital status - Widowed (%)
Marital status - Divorced (%)
Ancestries Reported - Arab (%)
Ancestries Reported - Czech (%)
Ancestries Reported - Danish (%)
Ancestries Reported - Dutch (%)
Ancestries Reported - English (%)
Ancestries Reported - French (%)
Ancestries Reported - French Canadian (%)
Ancestries Reported - German (%)
Ancestries Reported - Greek (%)
Ancestries Reported - Hungarian (%)
Ancestries Reported - Irish (%)
Ancestries Reported - Italian (%)
Ancestries Reported - Lithuanian (%)
Ancestries Reported - Norwegian (%)
Ancestries Reported - Polish (%)
Ancestries Reported - Portuguese (%)
Ancestries Reported - Russian (%)
Ancestries Reported - Scotch-Irish (%)
Ancestries Reported - Scottish (%)
Ancestries Reported - Slovak (%)
Ancestries Reported - Subsaharan African (%)
Ancestries Reported - Swedish (%)
Ancestries Reported - Swiss (%)
Ancestries Reported - Ukrainian (%)
Ancestries Reported - United States (%)
Ancestries Reported - Welsh (%)
Ancestries Reported - West Indian (%)
Ancestries Reported - Other (%)
Geographical mobility - Same house 1 year ago (%)
Geographical mobility - Same house 1 year ago (%) - White
Geographical mobility - Same house 1 year ago (%) - Black or African American
Geographical mobility - Same house 1 year ago (%) - Asian
Geographical mobility - Same house 1 year ago (%) - Hispanic or Latino
Geographical mobility - Same house 1 year ago (%) - American Indian and Alaska Native
Geographical mobility - Same house 1 year ago (%) - Multirace
Geographical mobility - Same house 1 year ago (%) - Other Race
Geographical mobility - Moved within same county (%)
Geographical mobility - Moved within same county (%) - White
Geographical mobility - Moved within same county (%) - Black or African American
Geographical mobility - Moved within same county (%) - Asian
Geographical mobility - Moved within same county (%) - Hispanic or Latino
Geographical mobility - Moved within same county (%) - American Indian and Alaska Native
Geographical mobility - Moved within same county (%) - Multirace
Geographical mobility - Moved within same county (%) - Other Race
Geographical mobility - Moved from different county within same state (%)
Geographical mobility - Moved from different county within same state (%) - White
Geographical mobility - Moved from different county within same state (%) - Black or African American
Geographical mobility - Moved from different county within same state (%) - Asian
Geographical mobility - Moved from different county within same state (%) - Hispanic or Latino
Geographical mobility - Moved from different county within same state (%) - American Indian and Alaska Native
Geographical mobility - Moved from different county within same state (%) - Multirace
Geographical mobility - Moved from different county within same state (%) - Other Race
Geographical mobility - Moved from different state (%)
Geographical mobility - Moved from different state (%) - White
Geographical mobility - Moved from different state (%) - Black or African American
Geographical mobility - Moved from different state (%) - Asian
Geographical mobility - Moved from different state (%) - Hispanic or Latino
Geographical mobility - Moved from different state (%) - American Indian and Alaska Native
Geographical mobility - Moved from different state (%) - Multirace
Geographical mobility - Moved from different state (%) - Other Race
Geographical mobility - Moved from abroad (%)
Geographical mobility - Moved from abroad (%) - White
Geographical mobility - Moved from abroad (%) - Black or African American
Geographical mobility - Moved from abroad (%) - Asian
Geographical mobility - Moved from abroad (%) - Hispanic or Latino
Geographical mobility - Moved from abroad (%) - American Indian and Alaska Native
Geographical mobility - Moved from abroad (%) - Multirace
Geographical mobility - Moved from abroad (%) - Other Race
Place of birth for the foreign-born population - Ireland (%)
Place of birth for the foreign-born population - Denmark (%)
Place of birth for the foreign-born population - Norway (%)
Place of birth for the foreign-born population - Sweden (%)
Place of birth for the foreign-born population - United Kingdom (%)
Place of birth for the foreign-born population - England (%)
Place of birth for the foreign-born population - Scotland (%)
Place of birth for the foreign-born population - Other Northern Europe (%)
Place of birth for the foreign-born population - Austria (%)
Place of birth for the foreign-born population - Belgium (%)
Place of birth for the foreign-born population - France (%)
Place of birth for the foreign-born population - Germany (%)
Place of birth for the foreign-born population - Netherlands (%)
Place of birth for the foreign-born population - Switzerland (%)
Place of birth for the foreign-born population - Other Western Europe (%)
Place of birth for the foreign-born population - Greece (%)
Place of birth for the foreign-born population - Italy (%)
Place of birth for the foreign-born population - Portugal (%)
Place of birth for the foreign-born population - Spain (%)
Place of birth for the foreign-born population - Other Southern Europe (%)
Place of birth for the foreign-born population - Albania (%)
Place of birth for the foreign-born population - Belarus (%)
Place of birth for the foreign-born population - Bosnia and Herzegovina (%)
Place of birth for the foreign-born population - Bulgaria (%)
Place of birth for the foreign-born population - Croatia (%)
Place of birth for the foreign-born population - Czechoslovakia (%)
Place of birth for the foreign-born population - Hungary (%)
Place of birth for the foreign-born population - Latvia (%)
Place of birth for the foreign-born population - Lithuania (%)
Place of birth for the foreign-born population - North Macedonia (Macedonia) (%)
Place of birth for the foreign-born population - Moldova (%)
Place of birth for the foreign-born population - Poland (%)
Place of birth for the foreign-born population - Romania (%)
Place of birth for the foreign-born population - Russia (%)
Place of birth for the foreign-born population - Serbia (%)
Place of birth for the foreign-born population - Ukraine (%)
Place of birth for the foreign-born population - Other Eastern Europe (%)
Place of birth for the foreign-born population - China (%)
Place of birth for the foreign-born population - Hong Kong (%)
Place of birth for the foreign-born population - Taiwan (%)
Place of birth for the foreign-born population - Japan (%)
Place of birth for the foreign-born population - Korea (%)
Place of birth for the foreign-born population - Other Eastern Asia (%)
Place of birth for the foreign-born population - Afghanistan (%)
Place of birth for the foreign-born population - Bangladesh (%)
Place of birth for the foreign-born population - India (%)
Place of birth for the foreign-born population - Iran (%)
Place of birth for the foreign-born population - Kazakhstan (%)
Place of birth for the foreign-born population - Nepal (%)
Place of birth for the foreign-born population - Pakistan (%)
Place of birth for the foreign-born population - Sri Lanka (%)
Place of birth for the foreign-born population - Uzbekistan (%)
Place of birth for the foreign-born population - Other South Central Asia (%)
Place of birth for the foreign-born population - Burma (%)
Place of birth for the foreign-born population - Cambodia (%)
Place of birth for the foreign-born population - Indonesia (%)
Place of birth for the foreign-born population - Laos (%)
Place of birth for the foreign-born population - Malaysia (%)
Place of birth for the foreign-born population - Philippines (%)
Place of birth for the foreign-born population - Singapore (%)
Place of birth for the foreign-born population - Thailand (%)
Place of birth for the foreign-born population - Vietnam (%)
Place of birth for the foreign-born population - Other South Eastern Asia (%)
Place of birth for the foreign-born population - Armenia (%)
Place of birth for the foreign-born population - Iraq (%)
Place of birth for the foreign-born population - Israel (%)
Place of birth for the foreign-born population - Jordan (%)
Place of birth for the foreign-born population - Kuwait (%)
Place of birth for the foreign-born population - Lebanon (%)
Place of birth for the foreign-born population - Saudi Arabia (%)
Place of birth for the foreign-born population - Syria (%)
Place of birth for the foreign-born population - Turkey (%)
Place of birth for the foreign-born population - Yemen (%)
Place of birth for the foreign-born population - Other Western Asia (%)
Place of birth for the foreign-born population - Eritrea (%)
Place of birth for the foreign-born population - Ethiopia (%)
Place of birth for the foreign-born population - Kenya (%)
Place of birth for the foreign-born population - Somalia (%)
Place of birth for the foreign-born population - Uganda (%)
Place of birth for the foreign-born population - Zimbabwe (%)
Place of birth for the foreign-born population - Other Eastern Africa (%)
Place of birth for the foreign-born population - Cameroon (%)
Place of birth for the foreign-born population - Congo (%)
Place of birth for the foreign-born population - Democratic Republic of Congo (Zaire) (%)
Place of birth for the foreign-born population - Other Middle Africa (%)
Place of birth for the foreign-born population - Egypt (%)
Place of birth for the foreign-born population - Morocco (%)
Place of birth for the foreign-born population - Sudan (%)
Place of birth for the foreign-born population - Other Northern Africa (%)
Place of birth for the foreign-born population - South Africa (%)
Place of birth for the foreign-born population - Other Southern Africa (%)
Place of birth for the foreign-born population - Cabo Verde (%)
Place of birth for the foreign-born population - Ghana (%)
Place of birth for the foreign-born population - Liberia (%)
Place of birth for the foreign-born population - Nigeria (%)
Place of birth for the foreign-born population - Senegal (%)
Place of birth for the foreign-born population - Sierra Leone (%)
Place of birth for the foreign-born population - Other Western Africa (%)
Place of birth for the foreign-born population - Australia (%)
Place of birth for the foreign-born population - New Zealand (%)
Place of birth for the foreign-born population - Fiji (%)
Place of birth for the foreign-born population - Micronesia (%)
Place of birth for the foreign-born population - Bahamas (%)
Place of birth for the foreign-born population - Barbados (%)
Place of birth for the foreign-born population - Cuba (%)
Place of birth for the foreign-born population - Dominica (%)
Place of birth for the foreign-born population - Dominican Republic (%)
Place of birth for the foreign-born population - Grenada (%)
Place of birth for the foreign-born population - Haiti (%)
Place of birth for the foreign-born population - Jamaica (%)
Place of birth for the foreign-born population - St. Vincent and the Grenadines (%)
Place of birth for the foreign-born population - Trinidad and Tobago (%)
Place of birth for the foreign-born population - West Indies (%)
Place of birth for the foreign-born population - Other Caribbean (%)
Place of birth for the foreign-born population - Belize (%)
Place of birth for the foreign-born population - Costa Rica (%)
Place of birth for the foreign-born population - El Salvador (%)
Place of birth for the foreign-born population - Guatemala (%)
Place of birth for the foreign-born population - Honduras (%)
Place of birth for the foreign-born population - Mexico (%)
Place of birth for the foreign-born population - Nicaragua (%)
Place of birth for the foreign-born population - Panama (%)
Place of birth for the foreign-born population - Other Central America (%)
Place of birth for the foreign-born population - Argentina (%)
Place of birth for the foreign-born population - Bolivia (%)
Place of birth for the foreign-born population - Brazil (%)
Place of birth for the foreign-born population - Chile (%)
Place of birth for the foreign-born population - Colombia (%)
Place of birth for the foreign-born population - Ecuador (%)
Place of birth for the foreign-born population - Guyana (%)
Place of birth for the foreign-born population - Peru (%)
Place of birth for the foreign-born population - Uruguay (%)
Place of birth for the foreign-born population - Venezuela (%)
Place of birth for the foreign-born population - Other South America (%)
Place of birth for the foreign-born population - Canada (%)
Place of birth for the foreign-born population - Other Northern America (%)
Place of birth for the foreign-born population - Other (%)
Latest news about races in Dunwoody, GA collected exclusively by city-data.com from local newspapers, TV, and radio stations
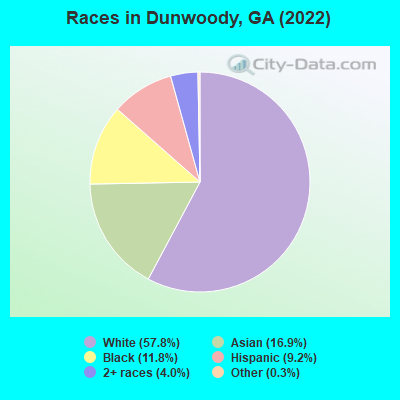
According to 2022 data, the most numerous races in Dunwoody, GA are White alone (29,817 residents), Black alone (6,084 residents), and Hispanic (4,764 residents). 73.7% of Dunwoody residents speak English at home. 21.3% of Dunwoody, GA residents are foreign-born (13.3% born in Asia, 3.3% born in Latin America, 2.4% born in Europe), which is 53.0% greater than the foreign-born rate of 10.0% across the entire state of Georgia.
Race distribution in Dunwoody
2000 2022
5,128,661 62.6% White alone 2,331,465 28.5% Black alone 435,227 5.3% Hispanic 171,513 2.1% Asian alone 87,364 1.1% Two or more races 17,670 0.2% American Indian alone 11,275 0.1% Other race alone 3,278 0.04% Native Hawaiian and Other
5,415,657 49.6% White alone 3,349,240 30.7% Black alone 1,132,604 10.4% Hispanic 479,156 4.4% Asian alone 462,923 4.2% Two or more races 54,416 0.5% Other race alone 11,923 0.1% American Indian alone 6,957 0.06% Native Hawaiian and Other
Income and house value in Dunwoody Median household income in 2022 $155,595 White non-Hispanic householders$58,319 Black householders$105,953 Asian householders$39,101 Some other race householders$71,265 Two or more races householders$51,314 Hispanic or Latino race householdersMedian 2022 house value $650,075 White Non-Hispanic householders$560,602 Black or African American householders $637,027 Asian householders$221,351 Native Hawaiian and other Pacific Islander householders$236,264 Some other race householders$302,902 Two or more races householders$375,366 Hispanic or Latino householders
Median age by race in Dunwoody
43.4 Median age for White residents41.6 46.0 33.3 Median age for Black or African American residents33.7 34.0 27.7 Median age for American Indian / Alaska Native residents-658,914,728.0 -565,432,098.2 34.4 Median age for Asian residents34.4 34.8 -657,243,815.6 Median age for Native Hawaiian / Pacific Islander residents-693,227,090.9 -776,776,776.0 17.5 Median age for Other race residents19.5 13.7 24.9 Median age for Two or more races residents14.8 29.9 44.1 Median age for White alone residents42.4 46.2 19.2 Median age for Hispanic or Latino residents17.7 20.0
Owner/renter occupied households by race in Dunwoody
House owners and renters - White residents 9,633 77.4% Owner occupied2,811 22.6% Renter occupiedHouse owners and renters - Black or African American residents 525 15.3% Owner occupied2,903 84.7% Renter occupiedHouse owners and renters - American Indian / Alaska Native residents 34 100.0% Renter occupiedHouse owners and renters - Asian residents 1,385 39.5% Owner occupied2,122 60.5% Renter occupiedHouse owners and renters - Other race residents 47 9.5% Owner occupied450 90.5% Renter occupiedHouse owners and renters - Two or more races residents 546 45.0% Owner occupied666 55.0% Renter occupiedHouse owners and renters - White alone residents 9,545 77.7% Owner occupied2,743 22.3% Renter occupiedHouse owners and renters - Hispanic or Latino residents 340 27.6% Owner occupied894 72.4% Renter occupied
Language usage in Dunwoody
English speakers - Total 73.7% of residents of Dunwoody speak English at home.
6.4% of residents speak Spanish at home 1,695 54.9% Speak English very well1,393 45.1% Speak English less than very well20.7% of residents speak other language at home 7,886 79.3% Speak English very well2,059 20.7% Speak English less than very well
English speakers - Born in the United States 94.5% of residents of Dunwoody speak English at home.
1.7% of residents speak Spanish at home 341 100.0% Speak English very well3.7% of residents speak other language at home 737 100.0% Speak English very well
English speakers - Native, born elsewhere 67.3% of residents of Dunwoody speak English at home.
11.7% of residents speak Spanish at home 88 72.7% Speak English very well33 27.3% Speak English less than very well16.3% of residents speak other language at home 165 97.6% Speak English very well4 2.4% Speak English less than very well
English speakers - Foreign-born 14.9% of residents of Dunwoody speak English at home.
13.1% of residents speak Spanish at home 455 34.4% Speak English very well869 65.6% Speak English less than very well76.0% of residents speak other language at home 5,837 76.2% Speak English very well1,826 23.8% Speak English less than very well
White (Caucasian) - Speak only English Native:
98.6% (27,031)Foreign-born:
37.4% (474)
White (Caucasian) - Speak another language Native:
2.4% (656)Foreign-born:
65.0% (822)
Black or African American - Speak only English Native:
94.2% (5,110)Foreign-born:
61.5% (300)
Black or African American - Speak another language Native:
6.2% (334)Foreign-born:
39.2% (191)
American Indian / Alaska Native - Speak another language Native:
53.9% (11)Foreign-born:
99.9% (30)
Asian - Speak only English Native:
30.8% (562)Foreign-born:
6.4% (382)
Asian - Speak another language Native:
68.5% (1,249)Foreign-born:
94.0% (5,598)
Other race - Speak another language Native:
96.3% (1,519)Foreign-born:
100.0% (730)
Two or more races - Speak only English Native:
72.7% (1,697)Foreign-born:
8.1% (47)
Two or more races - Speak another language Native:
26.6% (622)Foreign-born:
89.4% (512)
White alone - Speak only English Native:
98.4% (26,501)Foreign-born:
31.2% (485)
White alone - Speak another language Native:
1.9% (504)Foreign-born:
69.4% (1,079)
Hispanic or Latino - Speak only English Native:
31.1% (865)Foreign-born:
3.4% (46)
Hispanic or Latino - Speak another language Native:
66.4% (1,844)Foreign-born:
96.0% (1,289)
Foreign-born residents in Dunwoody 10,965 residents are foreign born (13.3% Asia , 3.3% Latin America , 2.4% Europe ).
This city:
21.3%Georgia:
10.4%
Marital status for residents in Dunwoody Marital status - White (Caucasian) population 15 years and over
Males 29.5% Never married63.7% Now married0.1% Separated3.4% Widowed3.3% DivorcedFemales 24.5% Never married55.1% Now married0.7% Separated9.5% Widowed10.1% DivorcedWomen who gave birth in the past 12 months Now married:
78.4% (168)Unmarried:
21.6% (46)
Women who did not give birth in the past 12 months Now married:
50.4% (3,265)Unmarried:
49.6% (3,216)
Marital status - Black or African American population 15 years and over
Males 60.2% Never married30.7% Now married0.0% Separated0.0% Widowed9.1% DivorcedFemales 51.8% Never married23.9% Now married0.9% Separated1.8% Widowed21.7% DivorcedWomen who gave birth in the past 12 months Now married:
36.8% (14)Unmarried:
63.2% (24)
Women who did not give birth in the past 12 months Now married:
27.1% (549)Unmarried:
72.9% (1,480)
Marital status - American Indian / Alaska Native population 15 years and over
Males 0.0% Never married100.0% Now married0.0% Separated0.0% Widowed0.0% DivorcedFemales 100.0% Never married0.0% Now married0.0% Separated0.0% Widowed0.0% DivorcedWomen who did not give birth in the past 12 months Now married:
0.0% (0)Unmarried:
100.0% (70)
Marital status - Asian population 15 years and over
Males 20.6% Never married65.6% Now married3.5% Separated0.7% Widowed9.6% DivorcedFemales 23.6% Never married69.2% Now married0.0% Separated2.4% Widowed4.8% DivorcedWomen who gave birth in the past 12 months Now married:
100.0% (126)Unmarried:
0.0% (0)
Women who did not give birth in the past 12 months Now married:
68.3% (1,805)Unmarried:
31.7% (838)
Marital status - Other race population 15 years and over
Males 54.3% Never married43.3% Now married0.0% Separated0.0% Widowed2.4% DivorcedFemales 43.0% Never married46.1% Now married5.2% Separated2.6% Widowed3.1% DivorcedWomen who did not give birth in the past 12 months Now married:
53.6% (323)Unmarried:
46.4% (280)
Marital status - Two or more races population 15 years and over
Males 60.9% Never married27.5% Now married10.2% Separated0.1% Widowed1.2% DivorcedFemales 47.4% Never married33.9% Now married4.7% Separated2.0% Widowed12.0% DivorcedWomen who gave birth in the past 12 months Now married:
100.0% (95)Unmarried:
0.0% (0)
Women who did not give birth in the past 12 months Now married:
23.2% (173)Unmarried:
76.8% (574)
Marital status - White alone, not Hispanic / Latino population 15 years and over
Males 28.2% Never married64.8% Now married0.1% Separated3.5% Widowed3.4% DivorcedFemales 23.3% Never married56.1% Now married0.6% Separated9.8% Widowed10.2% DivorcedWomen who gave birth in the past 12 months Now married:
77.3% (166)Unmarried:
22.7% (49)
Women who did not give birth in the past 12 months Now married:
51.3% (3,207)Unmarried:
48.7% (3,038)
Marital status - Hispanic or Latino population 15 years and over
Males 57.0% Never married36.0% Now married6.6% Separated0.0% Widowed0.4% DivorcedFemales 51.7% Never married33.3% Now married5.1% Separated2.0% Widowed8.0% DivorcedWomen who gave birth in the past 12 months Now married:
71.4% (62)Unmarried:
28.6% (25)
Women who did not give birth in the past 12 months Now married:
34.1% (499)Unmarried:
65.9% (966)
Ancestries in Dunwoody
3,912 12.9% American2,879 9.5% English976 3.2% German875 2.9% European861 2.8% Irish590 1.9% Eastern European419 1.4% Italian389 1.3% Polish369 1.2% Scotch-Irish363 1.2% British295 1.0% Greek276 0.9% French226 0.7% Russian167 0.6% Scottish146 0.5% Haitian141 0.5% Israeli137 0.5% Lebanese128 0.4% Ethiopian116 0.4% Norwegian103 0.3% Kenyan100 0.3% Swedish87 0.3% French Canadian84 0.3% Czech82 0.3% Iranian70 0.2% African61 0.2% Ghanaian59 0.2% Trinidadian and Tobagonian57 0.2% Turkish47 0.2% Canadian44 0.1% Hungarian41 0.1% Scandinavian40 0.1% Finnish33 0.1% U.S. Virgin Islander29 0.10% Dutch27 0.09% South African27 0.09% Lithuanian22 0.07% Northern European21 0.07% Welsh19 0.06% Jamaican18 0.06% Armenian17 0.06% Slavic15 0.05% Egyptian15 0.05% Liberian14 0.05% Romanian13 0.04% Czechoslovakian12 0.04% Syrian11 0.04% Austrian10 0.03% Moroccan8 0.03% Portuguese8 0.03% Yugoslavian6 0.02% Macedonian6 0.02% Swiss4 0.01% Nigerian
Geographical mobility in Dunwoody Same house 1 year ago 26,996 91.2% White (Caucasian)5,449 87.0% Black or African American71 87.7% American Indian / Alaska Native6,799 80.4% Asian2,334 86.3% Other race2,854 85.5% Two or more races26,943 91.1% White alone, not Hispanic / Latino4,122 87.7% Hispanic or LatinoMoved within same county 925 3.1% White / Caucasian121 1.9% Black or African American195 2.3% Asian23 0.9% Other race93 2.8% Two or more races1,007 3.4% White alone, not Hispanic / Latino22 0.5% Hispanic or LatinoMoved within same state 812 2.7% White / Caucasian699 11.1% Black or African American597 7.1% Asian202 7.5% Other race259 7.8% Two or more races729 2.5% White alone, not Hispanic / Latino612 13.0% Hispanic or LatinoMoved from different state 772 2.6% White / Caucasian86 1.4% Black or African American317 3.7% Asian41 1.2% Two or more races786 2.7% White alone, not Hispanic / Latino35 0.7% Hispanic or LatinoMoved from abroad 57 0.2% White38 0.6% Black or African American661 7.8% Asian133 4.0% Two or more races74 0.3% White alone, not Hispanic / Latino22 0.5% Hispanic or Latino
Children Nativity (place of birth) in Dunwoody
Children under 6 years - Living with two parents Both parents native 2,075 100.0% NativeBoth parents foreign-born 814 86.3% Native129 13.7% Foreign-bornOne native, one foreign-born parent 497 100.0% NativeChildren under 6 years - Living with one parent Native parent 251 100.0% NativeForeign-born parent 354 100.0% NativeChildren 6 to 17 years - Living with two parents Both parents native 4,285 99.1% Native38 0.9% Foreign-bornBoth parents foreign-born 560 48.8% Native587 51.2% Foreign-bornOne native, one foreign-born parent 734 95.6% Native34 4.4% Foreign-bornChildren 6 to 17 years - Living with one parent Native parent 991 100.0% NativeForeign-born parent 887 47.8% Native968 52.2% Foreign-born
Grandparents responsible for own grandchildren in Dunwoody
Grandparents (30 to 59 years) White / Caucasian 44 65.3% Responsible for grandchildren23 34.7% Not responsible for grandchildrenAsian 18 100.0% Not responsible for grandchildrenTwo or more races 19 100.0% Not responsible for grandchildrenWhite alone, not Hispanic / Latino 45 64.4% Responsible for grandchildren25 35.6% Not responsible for grandchildrenHispanic or Latino 13 100.0% Not responsible for grandchildrenGrandparents (60 years and over) White / Caucasian 107 34.1% Responsible for grandchildren207 65.9% Not responsible for grandchildrenAsian 82 100.0% Not responsible for grandchildrenWhite alone, not Hispanic / Latino 108 33.1% Responsible for grandchildren219 66.9% Not responsible for grandchildren