Races in East Bell, Texas (TX) Detailed Stats
Ancestries, Foreign-born residents, place of birth
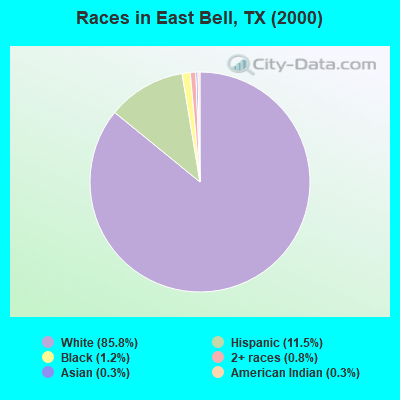
Race distribution in East Bell

- 4,29885.8%White alone
- 57711.5%Hispanic
- 621.2%Black alone
- 410.8%Two or more races
- 150.3%Asian alone
- 130.3%American Indian alone
- 10.02%Native Hawaiian and Other
Pacific Islander alone
2000
2022
-
- 10,933,31352.4%White alone
- 6,669,66632.0%Hispanic
- 2,364,25511.3%Black alone
- 554,4452.7%Asian alone
- 230,5671.1%Two or more races
- 68,8590.3%American Indian alone
- 19,9580.10%Other race alone
- 10,7570.05%Native Hawaiian and Other
Pacific Islander alone

-
- 12,070,64240.2%Hispanic
- 11,683,43038.9%White alone
- 3,508,70611.7%Black alone
- 1,608,1735.4%Asian alone
- 956,5603.2%Two or more races
- 125,7630.4%Other race alone
- 47,0230.2%American Indian alone
- 29,2750.10%Native Hawaiian and Other
Pacific Islander alone

Income and house value in East Bell
- Median household income in 2022
- $73,172White non-Hispanic householders
- $64,429Black householders
- over $200,000American Indian and Alaska Native householders
- $30,352Asian householders
- $61,137Some other race householders
- $139,660Two or more races householders
- $91,479Hispanic or Latino race householders
- Median 2022 house value
- $232,664White Non-Hispanic householders
- $169,940Black or African American householders
- $139,042American Indian or Alaska Native householders
- $169,940Asian householders
- $208,563Some other race householders
- $262,635Two or more races householders
- $198,366Hispanic or Latino householders
Household income for White non-Hispanic householders

Household income for Black householders

Household income for American Indian and Alaska Native householders

Household income for Asian householders

Household income for Two or more races householders

Household income for Hispanic or Latino race householders

Zip code: 76579