Races in East Lewis, Tennessee (TN) Detailed Stats
Ancestries, Foreign-born residents, place of birth
Race distribution in East Lewis

- 3,94995.5%White alone
- 681.6%Black alone
- 641.5%Hispanic
- 310.8%Two or more races
- 110.3%American Indian alone
- 80.2%Asian alone
- 20.05%Other race alone

2000
2022
-
- 4,505,93079.2%White alone
- 928,20416.3%Black alone
- 123,8382.2%Hispanic
- 54,8241.0%Two or more races
- 56,0771.0%Asian alone
- 13,8200.2%American Indian alone
- 4,7800.08%Other race alone
- 1,8100.03%Native Hawaiian and Other
Pacific Islander alone

-
- 5,070,02671.9%White alone
- 1,089,73815.5%Black alone
- 442,6296.3%Hispanic
- 279,3814.0%Two or more races
- 131,8171.9%Asian alone
- 26,9720.4%Other race alone
- 6,3870.09%American Indian alone
- 4,3890.06%Native Hawaiian and Other
Pacific Islander alone

Income and house value in East Lewis
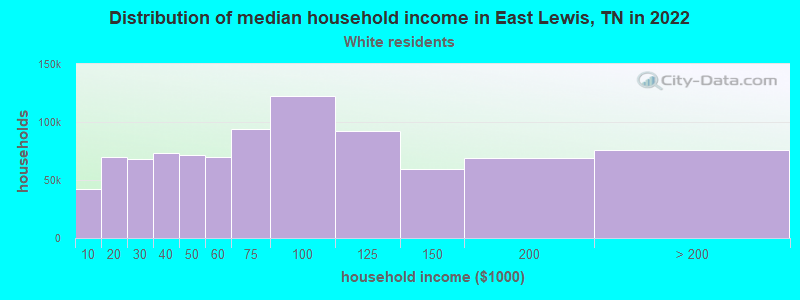
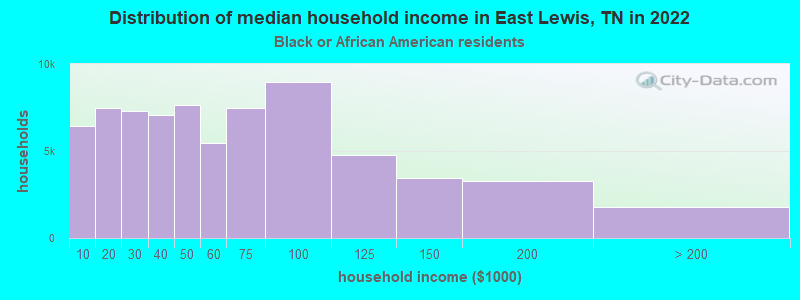
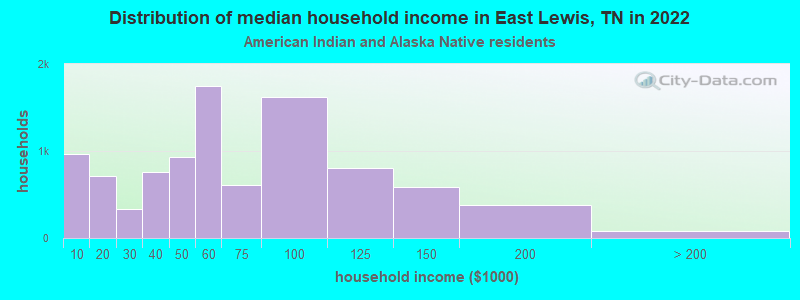
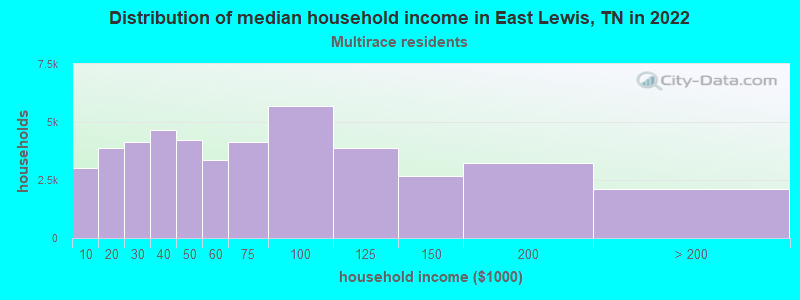
- Median household income in 2022
- $56,589White non-Hispanic householders
- $18,913Black householders
- $108,433American Indian and Alaska Native householders
- $113,485Some other race householders
- $35,413Two or more races householders
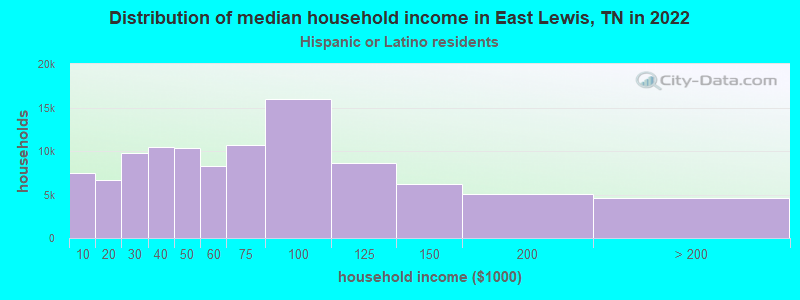
- $134,640Hispanic or Latino race householders
- Median 2022 house value
- $226,468White Non-Hispanic householders
- $381,609Two or more races householders
- $263,657Hispanic or Latino householders
Household income for White non-Hispanic householders
Household income for Black householders
Household income for American Indian and Alaska Native householders
Household income for Two or more races householders
Household income for Hispanic or Latino race householders
Zip code: 38462