Races in East Tillman, Oklahoma (OK) Detailed Stats
Ancestries, Foreign-born residents, place of birth
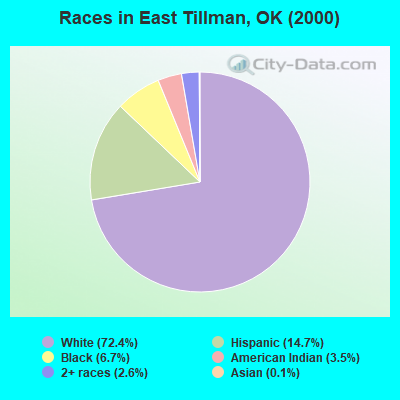
Race distribution in East Tillman

- 1,16272.4%White alone
- 23614.7%Hispanic
- 1076.7%Black alone
- 563.5%American Indian alone
- 412.6%Two or more races
- 20.1%Asian alone
2000
2022
-
- 2,556,36874.1%White alone
- 266,1587.7%American Indian alone
- 257,9817.5%Black alone
- 179,3045.2%Hispanic
- 140,2494.1%Two or more races
- 46,1721.3%Asian alone
- 2,3220.07%Other race alone
- 2,1000.06%Native Hawaiian and Other
Pacific Islander alone

-
- 2,517,40362.6%White alone
- 486,69212.1%Hispanic
- 364,4539.1%Two or more races
- 273,6506.8%American Indian alone
- 268,5436.7%Black alone
- 92,6722.3%Asian alone
- 10,7860.3%Other race alone
- 5,6010.1%Native Hawaiian and Other
Pacific Islander alone

Income and house value in East Tillman
- Median household income in 2022
- $48,804White non-Hispanic householders
- $44,174Black householders
- $45,117American Indian and Alaska Native householders
- $9,325Asian householders
- $69,554Some other race householders
- $34,814Two or more races householders
- $40,858Hispanic or Latino race householders
- Median 2022 house value
- $84,600White Non-Hispanic householders
- $60,586Black or African American householders
- $38,555American Indian or Alaska Native householders
- $27,539Asian householders
- $33,047Some other race householders
- $22,029Two or more races householders
- $32,165Hispanic or Latino householders
Household income for White non-Hispanic householders

Household income for Black householders

Household income for American Indian and Alaska Native householders

Household income for Asian householders

Household income for Two or more races householders

Household income for Hispanic or Latino race householders

Zip code: 73553