Races in Ecorse, Michigan (MI) Detailed Stats
Data:
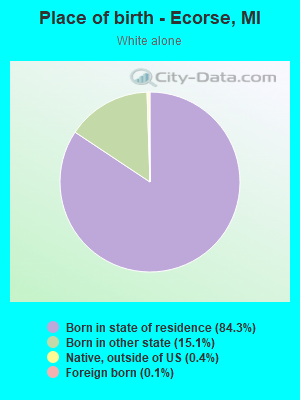
Races - White alone (%)
Races - White alone (% change since 2000)
Races - Black alone (%)
Races - Black alone (% change since 2000)
Races - American Indian alone (%)
Races - American Indian alone (% change since 2000)
Races - Asian alone (%)
Races - Asian alone (% change since 2000)
Races - Hispanic (%)
Races - Hispanic (% change since 2000)
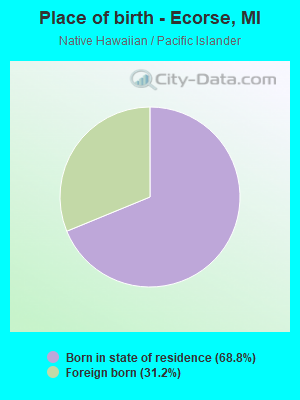
Races - Native Hawaiian and Other Pacific Islander alone (%)
Races - Native Hawaiian and Other Pacific Islander alone (% change since 2000)
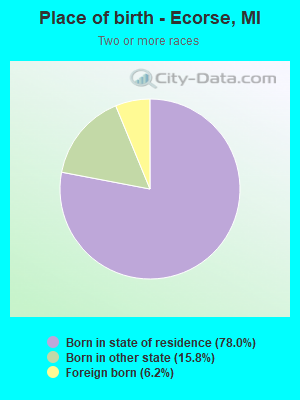
Races - Two or more races(%)
Races - Two or more races(% change since 2000)
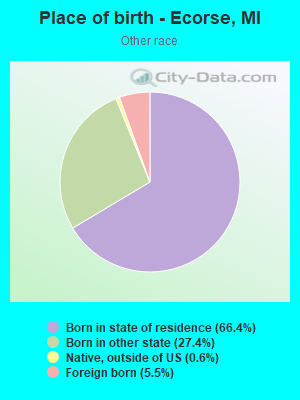
Races - Other race alone (%)
Races - Other race alone (% change since 2000)
Racial diversity
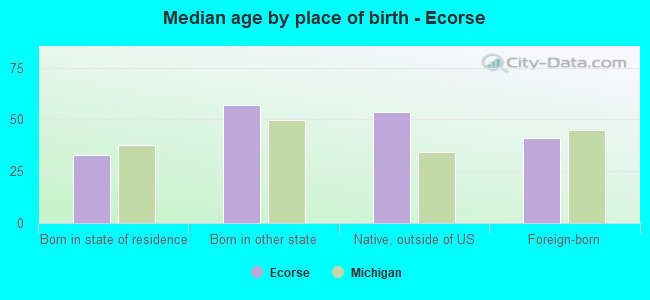
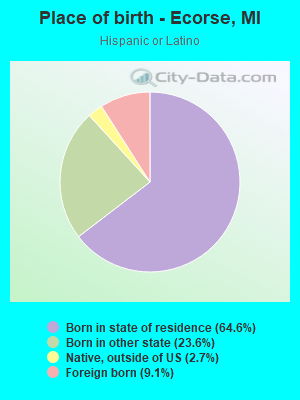
Place of birth - Born in state of residence (%)
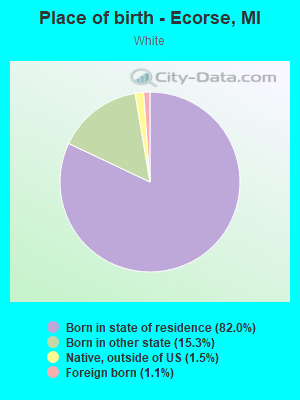
Place of birth - Born in state of residence (%) - White
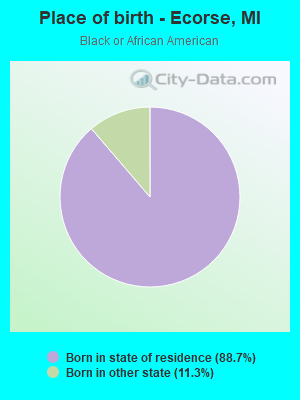
Place of birth - Born in state of residence (%) - Black or African American
Place of birth - Born in state of residence (%) - Asian
Place of birth - Born in state of residence (%) - Hispanic or Latino
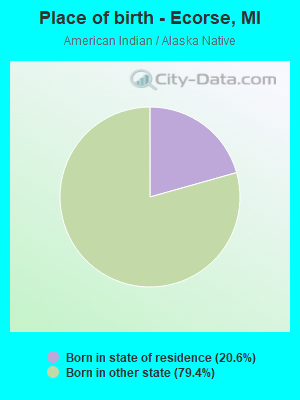
Place of birth - Born in state of residence (%) - American Indian and Alaska Native
Place of birth - Born in state of residence (%) - Multirace
Place of birth - Born in state of residence (%) - Other Race
Place of birth - Born in other state (%)
Place of birth - Born in other state (%) - White
Place of birth - Born in other state (%) - Black or African American
Place of birth - Born in other state (%) - Asian
Place of birth - Born in other state (%) - Hispanic or Latino
Place of birth - Born in other state (%) - American Indian and Alaska Native
Place of birth - Born in other state (%) - Multirace
Place of birth - Born in other state (%) - Other Race
Place of birth - Native, outside of US (%)
Place of birth - Native, outside of US (%) - White
Place of birth - Native, outside of US (%) - Black or African American
Place of birth - Native, outside of US (%) - Asian
Place of birth - Native, outside of US (%) - Hispanic or Latino
Place of birth - Native, outside of US (%) - American Indian and Alaska Native
Place of birth - Native, outside of US (%) - Multirace
Place of birth - Native, outside of US (%) - Other Race
Place of birth - Foreign born (%)
Place of birth - Foreign born (%) - White
Place of birth - Foreign born (%) - Black or African American
Place of birth - Foreign born (%) - Asian
Place of birth - Foreign born (%) - Hispanic or Latino
Place of birth - Foreign born (%) - American Indian and Alaska Native
Place of birth - Foreign born (%) - Multirace
Place of birth - Foreign born (%) - Other Race
Residents speaking English at home (%)
Residents speaking English at home - Born in the United States (%)
Residents speaking English at home - Native, born elsewhere (%)
Residents speaking English at home - Foreign born (%)
Residents speaking Spanish at home (%)
Residents speaking Spanish at home - Born in the United States (%)
Residents speaking Spanish at home - Native, born elsewhere (%)
Residents speaking Spanish at home - Foreign born (%)
Residents speaking other language at home (%)
Residents speaking other language at home - Born in the United States (%)
Residents speaking other language at home - Native, born elsewhere (%)
Residents speaking other language at home - Foreign born (%)
Marital status - Never married (%)
Marital status - Now married (%)
Marital status - Separated (%)
Marital status - Widowed (%)
Marital status - Divorced (%)
Ancestries Reported - Arab (%)
Ancestries Reported - Czech (%)
Ancestries Reported - Danish (%)
Ancestries Reported - Dutch (%)
Ancestries Reported - English (%)
Ancestries Reported - French (%)
Ancestries Reported - French Canadian (%)
Ancestries Reported - German (%)
Ancestries Reported - Greek (%)
Ancestries Reported - Hungarian (%)
Ancestries Reported - Irish (%)
Ancestries Reported - Italian (%)
Ancestries Reported - Lithuanian (%)
Ancestries Reported - Norwegian (%)
Ancestries Reported - Polish (%)
Ancestries Reported - Portuguese (%)
Ancestries Reported - Russian (%)
Ancestries Reported - Scotch-Irish (%)
Ancestries Reported - Scottish (%)
Ancestries Reported - Slovak (%)
Ancestries Reported - Subsaharan African (%)
Ancestries Reported - Swedish (%)
Ancestries Reported - Swiss (%)
Ancestries Reported - Ukrainian (%)
Ancestries Reported - United States (%)
Ancestries Reported - Welsh (%)
Ancestries Reported - West Indian (%)
Ancestries Reported - Other (%)
Geographical mobility - Same house 1 year ago (%)
Geographical mobility - Same house 1 year ago (%) - White
Geographical mobility - Same house 1 year ago (%) - Black or African American
Geographical mobility - Same house 1 year ago (%) - Asian
Geographical mobility - Same house 1 year ago (%) - Hispanic or Latino
Geographical mobility - Same house 1 year ago (%) - American Indian and Alaska Native
Geographical mobility - Same house 1 year ago (%) - Multirace
Geographical mobility - Same house 1 year ago (%) - Other Race
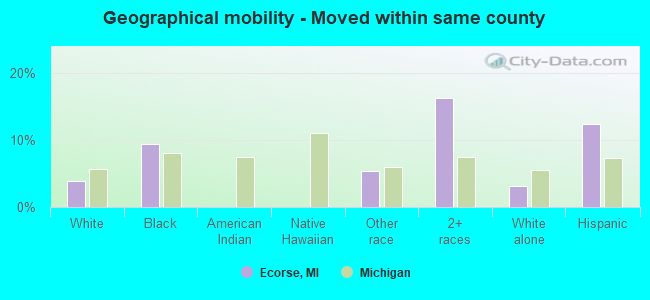
Geographical mobility - Moved within same county (%)
Geographical mobility - Moved within same county (%) - White
Geographical mobility - Moved within same county (%) - Black or African American
Geographical mobility - Moved within same county (%) - Asian
Geographical mobility - Moved within same county (%) - Hispanic or Latino
Geographical mobility - Moved within same county (%) - American Indian and Alaska Native
Geographical mobility - Moved within same county (%) - Multirace
Geographical mobility - Moved within same county (%) - Other Race
Geographical mobility - Moved from different county within same state (%)
Geographical mobility - Moved from different county within same state (%) - White
Geographical mobility - Moved from different county within same state (%) - Black or African American
Geographical mobility - Moved from different county within same state (%) - Asian
Geographical mobility - Moved from different county within same state (%) - Hispanic or Latino
Geographical mobility - Moved from different county within same state (%) - American Indian and Alaska Native
Geographical mobility - Moved from different county within same state (%) - Multirace
Geographical mobility - Moved from different county within same state (%) - Other Race
Geographical mobility - Moved from different state (%)
Geographical mobility - Moved from different state (%) - White
Geographical mobility - Moved from different state (%) - Black or African American
Geographical mobility - Moved from different state (%) - Asian
Geographical mobility - Moved from different state (%) - Hispanic or Latino
Geographical mobility - Moved from different state (%) - American Indian and Alaska Native
Geographical mobility - Moved from different state (%) - Multirace
Geographical mobility - Moved from different state (%) - Other Race
Geographical mobility - Moved from abroad (%)
Geographical mobility - Moved from abroad (%) - White
Geographical mobility - Moved from abroad (%) - Black or African American
Geographical mobility - Moved from abroad (%) - Asian
Geographical mobility - Moved from abroad (%) - Hispanic or Latino
Geographical mobility - Moved from abroad (%) - American Indian and Alaska Native
Geographical mobility - Moved from abroad (%) - Multirace
Geographical mobility - Moved from abroad (%) - Other Race
Place of birth for the foreign-born population - Ireland (%)
Place of birth for the foreign-born population - Denmark (%)
Place of birth for the foreign-born population - Norway (%)
Place of birth for the foreign-born population - Sweden (%)
Place of birth for the foreign-born population - United Kingdom (%)
Place of birth for the foreign-born population - England (%)
Place of birth for the foreign-born population - Scotland (%)
Place of birth for the foreign-born population - Other Northern Europe (%)
Place of birth for the foreign-born population - Austria (%)
Place of birth for the foreign-born population - Belgium (%)
Place of birth for the foreign-born population - France (%)
Place of birth for the foreign-born population - Germany (%)
Place of birth for the foreign-born population - Netherlands (%)
Place of birth for the foreign-born population - Switzerland (%)
Place of birth for the foreign-born population - Other Western Europe (%)
Place of birth for the foreign-born population - Greece (%)
Place of birth for the foreign-born population - Italy (%)
Place of birth for the foreign-born population - Portugal (%)
Place of birth for the foreign-born population - Spain (%)
Place of birth for the foreign-born population - Other Southern Europe (%)
Place of birth for the foreign-born population - Albania (%)
Place of birth for the foreign-born population - Belarus (%)
Place of birth for the foreign-born population - Bosnia and Herzegovina (%)
Place of birth for the foreign-born population - Bulgaria (%)
Place of birth for the foreign-born population - Croatia (%)
Place of birth for the foreign-born population - Czechoslovakia (%)
Place of birth for the foreign-born population - Hungary (%)
Place of birth for the foreign-born population - Latvia (%)
Place of birth for the foreign-born population - Lithuania (%)
Place of birth for the foreign-born population - North Macedonia (Macedonia) (%)
Place of birth for the foreign-born population - Moldova (%)
Place of birth for the foreign-born population - Poland (%)
Place of birth for the foreign-born population - Romania (%)
Place of birth for the foreign-born population - Russia (%)
Place of birth for the foreign-born population - Serbia (%)
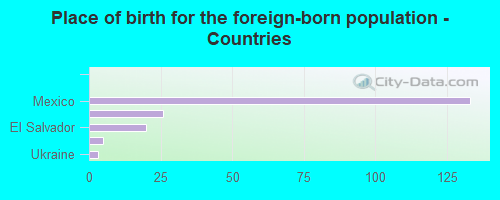
Place of birth for the foreign-born population - Ukraine (%)
Place of birth for the foreign-born population - Other Eastern Europe (%)
Place of birth for the foreign-born population - China (%)
Place of birth for the foreign-born population - Hong Kong (%)
Place of birth for the foreign-born population - Taiwan (%)
Place of birth for the foreign-born population - Japan (%)
Place of birth for the foreign-born population - Korea (%)
Place of birth for the foreign-born population - Other Eastern Asia (%)
Place of birth for the foreign-born population - Afghanistan (%)
Place of birth for the foreign-born population - Bangladesh (%)
Place of birth for the foreign-born population - India (%)
Place of birth for the foreign-born population - Iran (%)
Place of birth for the foreign-born population - Kazakhstan (%)
Place of birth for the foreign-born population - Nepal (%)
Place of birth for the foreign-born population - Pakistan (%)
Place of birth for the foreign-born population - Sri Lanka (%)
Place of birth for the foreign-born population - Uzbekistan (%)
Place of birth for the foreign-born population - Other South Central Asia (%)
Place of birth for the foreign-born population - Burma (%)
Place of birth for the foreign-born population - Cambodia (%)
Place of birth for the foreign-born population - Indonesia (%)
Place of birth for the foreign-born population - Laos (%)
Place of birth for the foreign-born population - Malaysia (%)
Place of birth for the foreign-born population - Philippines (%)
Place of birth for the foreign-born population - Singapore (%)
Place of birth for the foreign-born population - Thailand (%)
Place of birth for the foreign-born population - Vietnam (%)
Place of birth for the foreign-born population - Other South Eastern Asia (%)
Place of birth for the foreign-born population - Armenia (%)
Place of birth for the foreign-born population - Iraq (%)
Place of birth for the foreign-born population - Israel (%)
Place of birth for the foreign-born population - Jordan (%)
Place of birth for the foreign-born population - Kuwait (%)
Place of birth for the foreign-born population - Lebanon (%)
Place of birth for the foreign-born population - Saudi Arabia (%)
Place of birth for the foreign-born population - Syria (%)
Place of birth for the foreign-born population - Turkey (%)
Place of birth for the foreign-born population - Yemen (%)
Place of birth for the foreign-born population - Other Western Asia (%)
Place of birth for the foreign-born population - Eritrea (%)
Place of birth for the foreign-born population - Ethiopia (%)
Place of birth for the foreign-born population - Kenya (%)
Place of birth for the foreign-born population - Somalia (%)
Place of birth for the foreign-born population - Uganda (%)
Place of birth for the foreign-born population - Zimbabwe (%)
Place of birth for the foreign-born population - Other Eastern Africa (%)
Place of birth for the foreign-born population - Cameroon (%)
Place of birth for the foreign-born population - Congo (%)
Place of birth for the foreign-born population - Democratic Republic of Congo (Zaire) (%)
Place of birth for the foreign-born population - Other Middle Africa (%)
Place of birth for the foreign-born population - Egypt (%)
Place of birth for the foreign-born population - Morocco (%)
Place of birth for the foreign-born population - Sudan (%)
Place of birth for the foreign-born population - Other Northern Africa (%)
Place of birth for the foreign-born population - South Africa (%)
Place of birth for the foreign-born population - Other Southern Africa (%)
Place of birth for the foreign-born population - Cabo Verde (%)
Place of birth for the foreign-born population - Ghana (%)
Place of birth for the foreign-born population - Liberia (%)
Place of birth for the foreign-born population - Nigeria (%)
Place of birth for the foreign-born population - Senegal (%)
Place of birth for the foreign-born population - Sierra Leone (%)
Place of birth for the foreign-born population - Other Western Africa (%)
Place of birth for the foreign-born population - Australia (%)
Place of birth for the foreign-born population - New Zealand (%)
Place of birth for the foreign-born population - Fiji (%)
Place of birth for the foreign-born population - Micronesia (%)
Place of birth for the foreign-born population - Bahamas (%)
Place of birth for the foreign-born population - Barbados (%)
Place of birth for the foreign-born population - Cuba (%)
Place of birth for the foreign-born population - Dominica (%)
Place of birth for the foreign-born population - Dominican Republic (%)
Place of birth for the foreign-born population - Grenada (%)
Place of birth for the foreign-born population - Haiti (%)
Place of birth for the foreign-born population - Jamaica (%)
Place of birth for the foreign-born population - St. Vincent and the Grenadines (%)
Place of birth for the foreign-born population - Trinidad and Tobago (%)
Place of birth for the foreign-born population - West Indies (%)
Place of birth for the foreign-born population - Other Caribbean (%)
Place of birth for the foreign-born population - Belize (%)
Place of birth for the foreign-born population - Costa Rica (%)
Place of birth for the foreign-born population - El Salvador (%)
Place of birth for the foreign-born population - Guatemala (%)
Place of birth for the foreign-born population - Honduras (%)
Place of birth for the foreign-born population - Mexico (%)
Place of birth for the foreign-born population - Nicaragua (%)
Place of birth for the foreign-born population - Panama (%)
Place of birth for the foreign-born population - Other Central America (%)
Place of birth for the foreign-born population - Argentina (%)
Place of birth for the foreign-born population - Bolivia (%)
Place of birth for the foreign-born population - Brazil (%)
Place of birth for the foreign-born population - Chile (%)
Place of birth for the foreign-born population - Colombia (%)
Place of birth for the foreign-born population - Ecuador (%)
Place of birth for the foreign-born population - Guyana (%)
Place of birth for the foreign-born population - Peru (%)
Place of birth for the foreign-born population - Uruguay (%)
Place of birth for the foreign-born population - Venezuela (%)
Place of birth for the foreign-born population - Other South America (%)
Place of birth for the foreign-born population - Canada (%)
Place of birth for the foreign-born population - Other Northern America (%)
Place of birth for the foreign-born population - Other (%)
Latest news about races in Ecorse, MI collected exclusively by city-data.com from local newspapers, TV, and radio stations
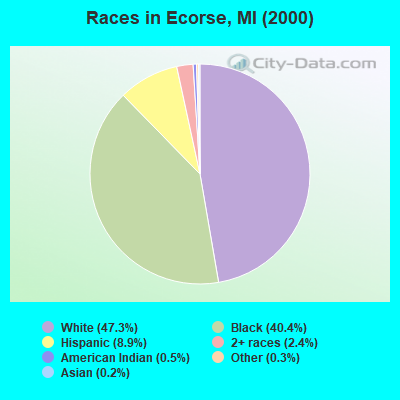
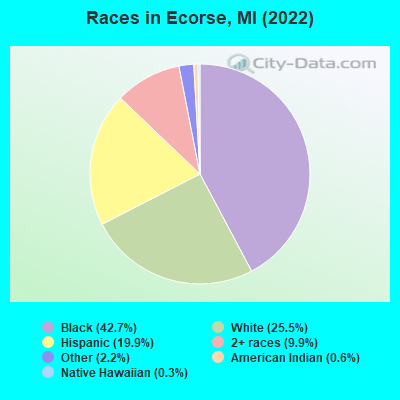
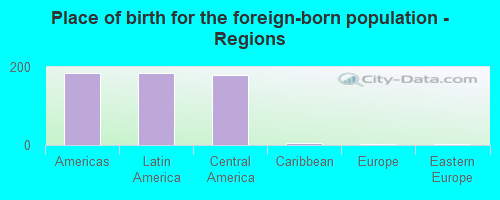
According to 2022 data, the most numerous races in Ecorse, MI are White alone (2,340 residents), Black alone (3,915 residents), and Hispanic (1,827 residents). 89.6% of Ecorse residents speak English at home. 2.1% of Ecorse, MI residents are foreign-born (2.0% born in Latin America), which is 192.5% less than the foreign-born rate of 6.0% across the entire state of Michigan.
Race distribution in Ecorse
2000 2022
7,806,691 78.6% White alone 1,402,047 14.1% Black alone 323,877 3.3% Hispanic 175,311 1.8% Asian alone 163,487 1.6% Two or more races 53,421 0.5% American Indian alone 11,465 0.1% Other race alone 2,145 0.02% Native Hawaiian and Other
7,289,051 72.6% White alone 1,310,464 13.1% Black alone 572,405 5.7% Hispanic 450,031 4.5% Two or more races 335,732 3.3% Asian alone 45,217 0.5% Other race alone 29,011 0.3% American Indian alone 2,207 0.02% Native Hawaiian and Other
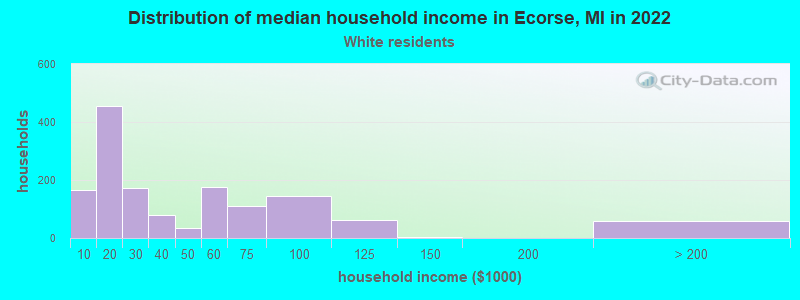
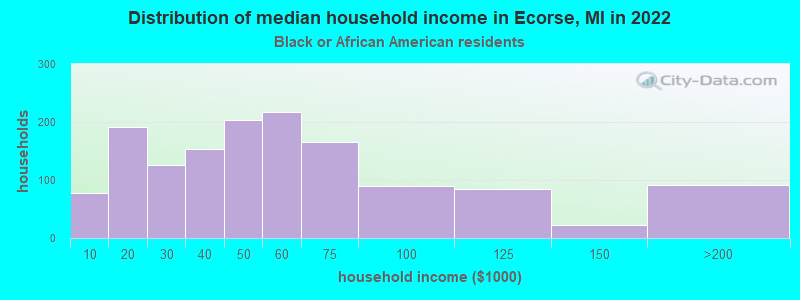
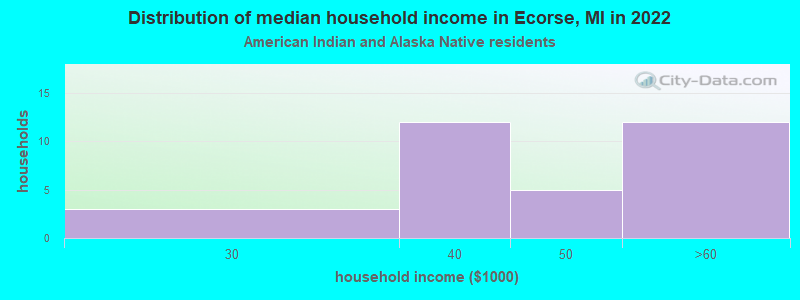
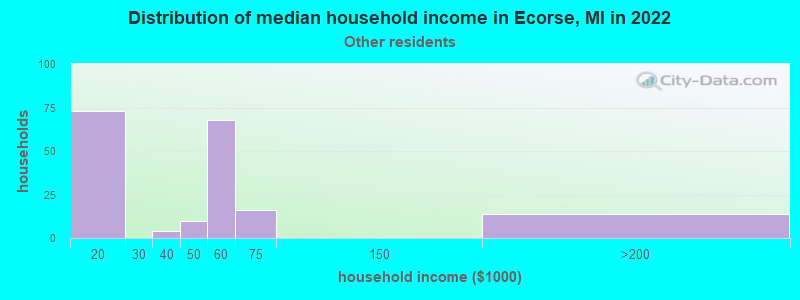
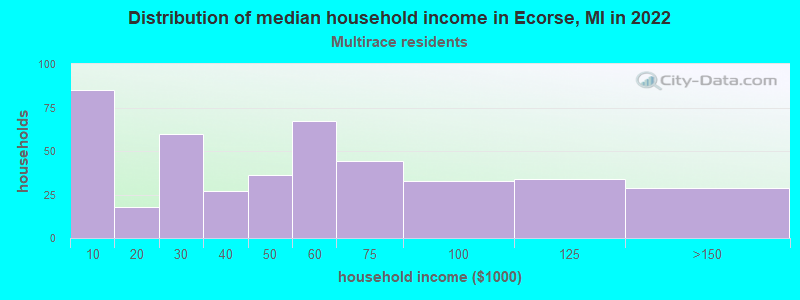
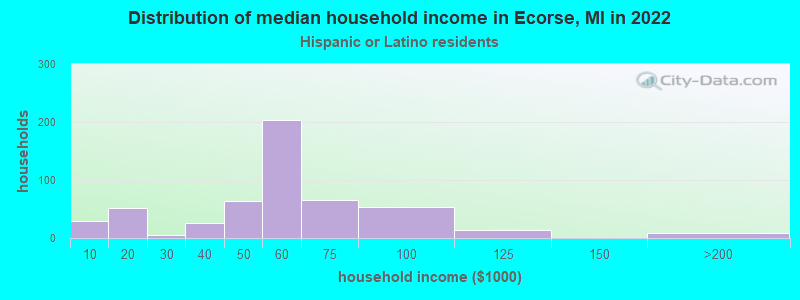
Income and house value in Ecorse Median household income in 2022 $24,648 White non-Hispanic householders$47,687 Black householders$38,496 American Indian and Alaska Native householders$55,486 Some other race householders$43,410 Two or more races householders$54,068 Hispanic or Latino race householdersMedian 2022 house value $55,058 White Non-Hispanic householders$61,321 Black or African American householders$49,839 Some other race householders$69,019 Two or more races householders$50,883 Hispanic or Latino householders
Median age by race in Ecorse
54.6 Median age for White residents57.3 50.8 33.5 Median age for Black or African American residents33.5 34.9 23.0 Median age for American Indian / Alaska Native residents20.2 21.4 -668,478,260.2 Median age for Asian residents-655,555,554.9 -693,333,332.6 58.3 Median age for Native Hawaiian / Pacific Islander residents-674,772,035.8 -699,588,476.7 14.7 Median age for Other race residents23.4 9.5 20.8 Median age for Two or more races residents19.7 21.3 57.0 Median age for White alone residents61.8 51.7 23.8 Median age for Hispanic or Latino residents24.9 21.6
Owner/renter occupied households by race in Ecorse
House owners and renters - White residents 1,078 76.9% Owner occupied323 23.1% Renter occupiedHouse owners and renters - Black or African American residents 848 58.1% Owner occupied611 41.9% Renter occupiedHouse owners and renters - American Indian / Alaska Native residents 14 43.3% Owner occupied18 56.7% Renter occupiedHouse owners and renters - Native Hawaiian / Pacific Islander residents 12 100.0% Owner occupiedHouse owners and renters - Other race residents 110 60.6% Owner occupied72 39.4% Renter occupiedHouse owners and renters - Two or more races residents 239 51.2% Owner occupied228 48.8% Renter occupiedHouse owners and renters - White alone residents 1,009 77.9% Owner occupied287 22.1% Renter occupiedHouse owners and renters - Hispanic or Latino residents 306 62.2% Owner occupied186 37.8% Renter occupied
Language usage in Ecorse
English speakers - Total 89.6% of residents of Ecorse speak English at home.
9.2% of residents speak Spanish at home 616 79.9% Speak English very well155 20.1% Speak English less than very well0.8% of residents speak other language at home 62 98.4% Speak English very well1 1.6% Speak English less than very well
English speakers - Born in the United States 82.3% of residents of Ecorse speak English at home.
18.7% of residents speak Spanish at home 238 92.2% Speak English very well20 7.8% Speak English less than very well
English speakers - Native, born elsewhere 34.0% of residents of Ecorse speak English at home.
82.0% of residents speak Spanish at home 19 46.3% Speak English very well22 53.7% Speak English less than very well
English speakers - Foreign-born 4.7% of residents of Ecorse speak English at home.
85.4% of residents speak Spanish at home 69 42.1% Speak English very well95 57.9% Speak English less than very well0.5% of residents speak other language at home 1 100.0% Speak English less than very well
White (Caucasian) - Speak only English Native:
95.2% (2,493)Foreign-born:
30.5% (9)
White (Caucasian) - Speak another language Native:
5.2% (135)Foreign-born:
69.8% (21)
Other race - Speak another language Native:
16.2% (103)Foreign-born:
100.0% (38)
Two or more races - Speak another language Native:
35.8% (626)Foreign-born:
100.0% (119)
White alone - Speak only English Native:
99.4% (2,239)Foreign-born:
97.2% (3)
Hispanic or Latino - Speak only English Native:
63.1% (1,006)Foreign-born:
2.6% (4)
Hispanic or Latino - Speak another language Native:
36.6% (583)Foreign-born:
98.2% (167)
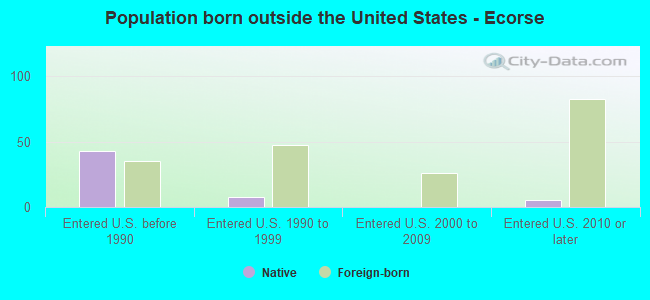
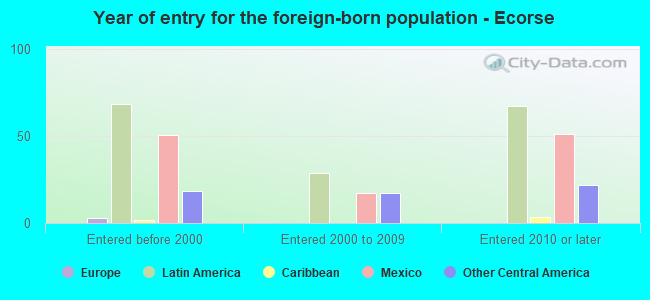
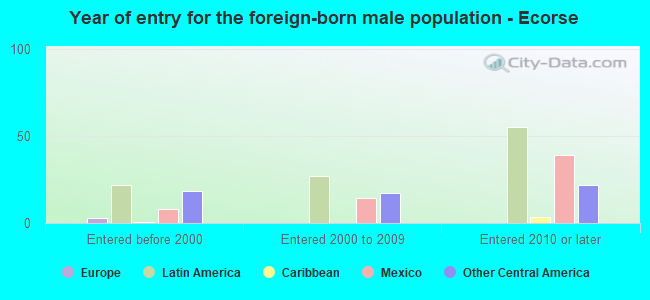
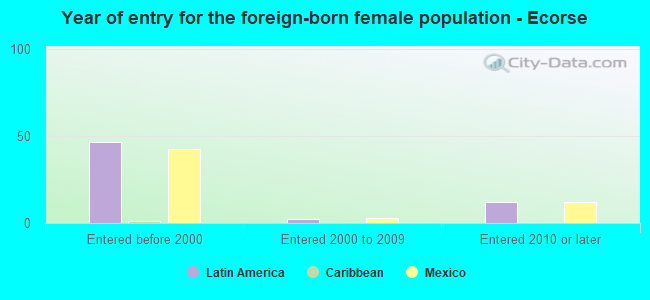
Foreign-born residents in Ecorse 188 residents are foreign born (2.0% Latin America ).
This city:
2.1%Michigan:
6.9%
Marital status for residents in Ecorse Marital status - White (Caucasian) population 15 years and over
Males 36.0% Never married25.2% Now married0.6% Separated7.8% Widowed30.3% DivorcedFemales 32.6% Never married30.4% Now married0.7% Separated14.5% Widowed21.7% DivorcedWomen who gave birth in the past 12 months Now married:
100.0% (16)Unmarried:
0.0% (0)
Women who did not give birth in the past 12 months Now married:
28.5% (167)Unmarried:
71.5% (418)
Marital status - Black or African American population 15 years and over
Males 62.5% Never married21.0% Now married0.6% Separated3.0% Widowed12.8% DivorcedFemales 51.5% Never married21.5% Now married3.6% Separated13.5% Widowed9.9% DivorcedWomen who gave birth in the past 12 months Now married:
70.6% (91)Unmarried:
29.4% (38)
Women who did not give birth in the past 12 months Now married:
22.3% (136)Unmarried:
77.7% (473)
Marital status - American Indian / Alaska Native population 15 years and over
Males 94.7% Never married0.0% Now married5.3% Separated0.0% Widowed0.0% DivorcedFemales 60.2% Never married0.0% Now married0.0% Separated20.4% Widowed19.4% DivorcedWomen who did not give birth in the past 12 months Now married:
0.0% (0)Unmarried:
100.0% (86)
Marital status - Native Hawaiian / Pacific Islander population 15 years and over
Males 0.0% Never married0.0% Now married55.6% Separated0.0% Widowed44.4% DivorcedFemales 100.0% Never married0.0% Now married0.0% Separated0.0% Widowed0.0% DivorcedMarital status - Other race population 15 years and over
Males 62.3% Never married5.9% Now married0.0% Separated3.4% Widowed28.4% DivorcedFemales 57.6% Never married18.5% Now married0.0% Separated1.1% Widowed22.8% DivorcedWomen who did not give birth in the past 12 months Now married:
20.0% (18)Unmarried:
80.0% (73)
Marital status - Two or more races population 15 years and over
Males 61.2% Never married33.8% Now married0.0% Separated0.0% Widowed5.0% DivorcedFemales 46.8% Never married22.9% Now married17.4% Separated1.3% Widowed11.6% DivorcedWomen who did not give birth in the past 12 months Now married:
35.2% (203)Unmarried:
64.8% (373)
Marital status - White alone, not Hispanic / Latino population 15 years and over
Males 34.5% Never married25.4% Now married0.7% Separated8.6% Widowed30.8% DivorcedFemales 27.8% Never married34.1% Now married0.8% Separated12.5% Widowed24.8% DivorcedWomen who gave birth in the past 12 months Now married:
100.0% (16)Unmarried:
0.0% (0)
Women who did not give birth in the past 12 months Now married:
33.7% (151)Unmarried:
66.3% (297)
Marital status - Hispanic or Latino population 15 years and over
Males 59.4% Never married17.9% Now married0.0% Separated1.9% Widowed20.9% DivorcedFemales 58.0% Never married10.8% Now married10.0% Separated10.2% Widowed11.0% DivorcedWomen who did not give birth in the past 12 months Now married:
22.9% (102)Unmarried:
77.1% (345)
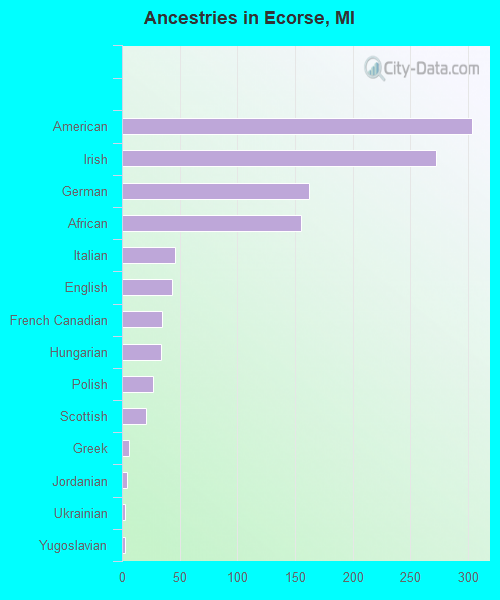
Ancestries in Ecorse
303 6.4% American272 5.7% Irish162 3.4% German155 3.3% African46 1.0% Italian43 0.9% English35 0.7% French Canadian34 0.7% Hungarian27 0.6% Polish21 0.4% Scottish6 0.1% Greek4 0.08% Jordanian3 0.06% Ukrainian3 0.06% Yugoslavian2 0.04% British
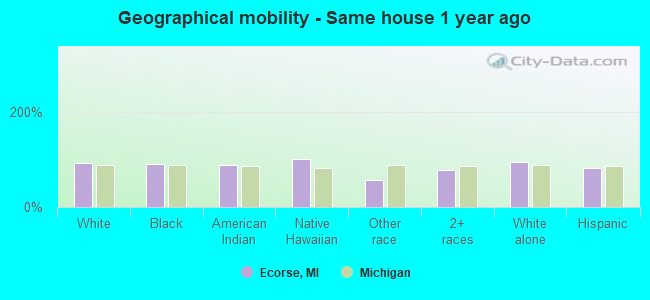
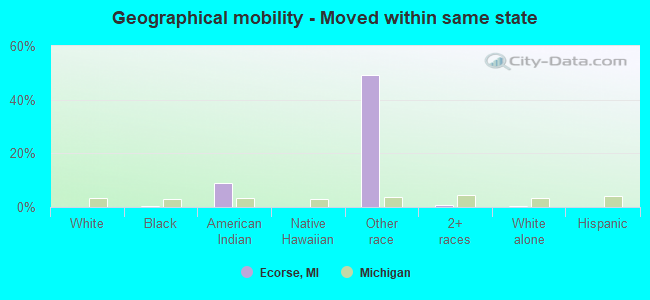
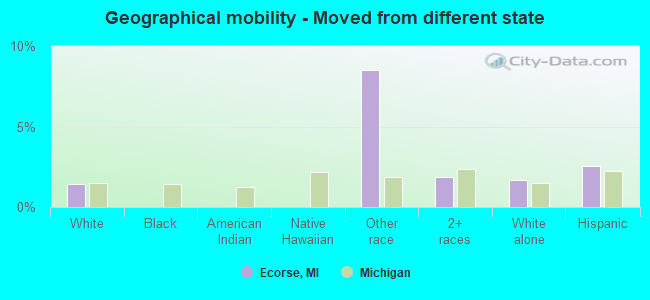
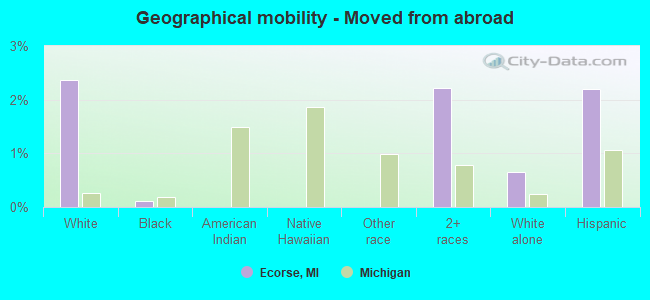
Geographical mobility in Ecorse Same house 1 year ago 2,524 92.7% White (Caucasian)3,365 89.9% Black or African American162 89.3% American Indian / Alaska Native78 100.0% Native Hawaiian / Pacific Islander383 56.5% Other race1,537 77.8% Two or more races2,194 94.5% White alone, not Hispanic / Latino1,477 80.9% Hispanic or LatinoMoved within same county 106 3.9% White / Caucasian354 9.4% Black or African American36 5.3% Other race322 16.3% Two or more races72 3.1% White alone, not Hispanic / Latino225 12.3% Hispanic or LatinoMoved within same state 4 0.2% White / Caucasian11 0.3% Black or African American16 8.9% American Indian / Alaska Native333 49.1% Other race13 0.6% Two or more races4 0.2% White alone, not Hispanic / LatinoMoved from different state 39 1.4% White / Caucasian58 8.5% Other race37 1.9% Two or more races38 1.7% White alone, not Hispanic / Latino46 2.5% Hispanic or LatinoMoved from abroad 65 2.4% White4 0.1% Black or African American44 2.2% Two or more races15 0.7% White alone, not Hispanic / Latino40 2.2% Hispanic or Latino
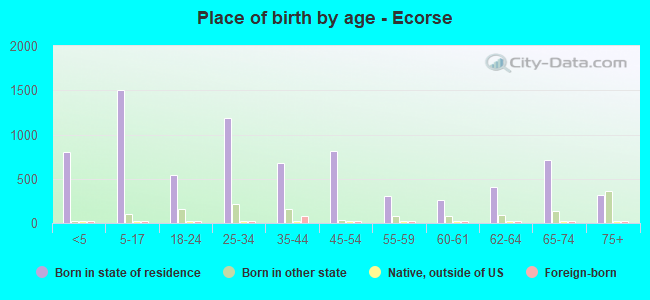
Children Nativity (place of birth) in Ecorse
Children under 6 years - Living with two parents Both parents native 496 100.0% NativeBoth parents foreign-born 13 100.0% NativeOne native, one foreign-born parent 70 100.0% NativeChildren under 6 years - Living with one parent Native parent 369 100.0% NativeForeign-born parent 30 100.0% NativeChildren 6 to 17 years - Living with two parents Both parents native 313 100.0% NativeBoth parents foreign-born 14 100.0% NativeOne native, one foreign-born parent 106 100.0% NativeChildren 6 to 17 years - Living with one parent Native parent 825 100.0% NativeForeign-born parent 54 51.4% Native51 48.6% Foreign-born
Grandparents responsible for own grandchildren in Ecorse
Grandparents (30 to 59 years) White / Caucasian 13 100.0% Responsible for grandchildrenBlack or African American 18 100.0% Responsible for grandchildrenNative Hawaiian / Pacific Islander 36 100.0% Responsible for grandchildrenTwo or more races 17 100.0% Responsible for grandchildrenWhite alone, not Hispanic / Latino 13 100.0% Responsible for grandchildrenHispanic or Latino 16 100.0% Responsible for grandchildrenGrandparents (60 years and over) White / Caucasian 40 67.2% Responsible for grandchildren20 32.8% Not responsible for grandchildrenBlack or African American 17 100.0% Not responsible for grandchildrenWhite alone, not Hispanic / Latino 18 46.3% Responsible for grandchildren20 53.7% Not responsible for grandchildrenHispanic or Latino 23 72.6% Responsible for grandchildren9 27.4% Not responsible for grandchildren