Races in El Reno, Oklahoma (OK) Detailed Stats
Data:
Races - White alone (%)
Races - White alone (% change since 2000)
Races - Black alone (%)
Races - Black alone (% change since 2000)
Races - American Indian alone (%)
Races - American Indian alone (% change since 2000)
Races - Asian alone (%)
Races - Asian alone (% change since 2000)
Races - Hispanic (%)
Races - Hispanic (% change since 2000)
Races - Native Hawaiian and Other Pacific Islander alone (%)
Races - Native Hawaiian and Other Pacific Islander alone (% change since 2000)
Races - Two or more races(%)
Races - Two or more races(% change since 2000)
Races - Other race alone (%)
Races - Other race alone (% change since 2000)
Racial diversity
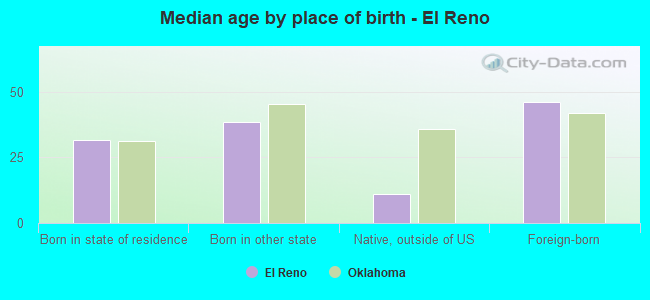
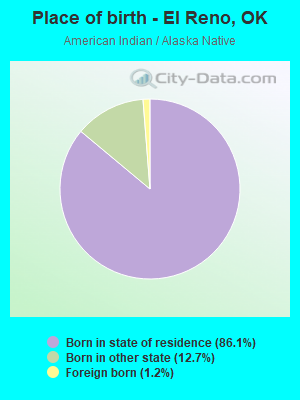
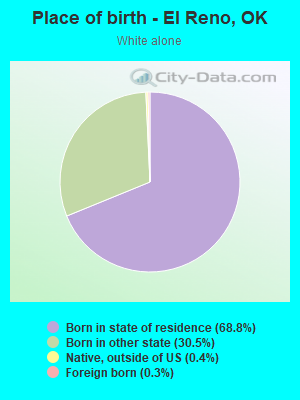
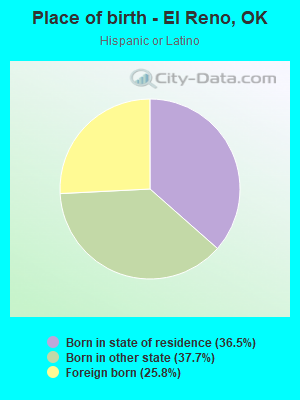
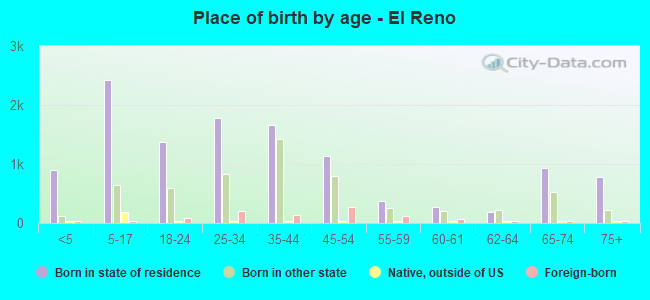
Place of birth - Born in state of residence (%)
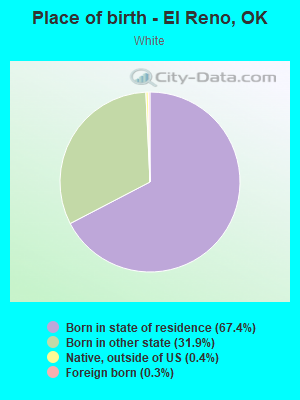
Place of birth - Born in state of residence (%) - White
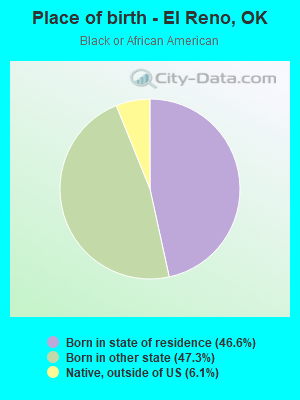
Place of birth - Born in state of residence (%) - Black or African American
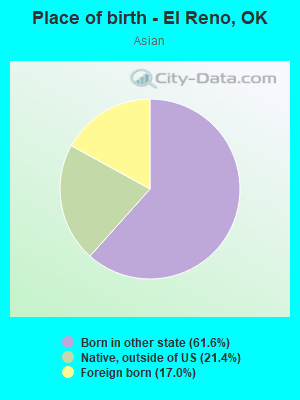
Place of birth - Born in state of residence (%) - Asian
Place of birth - Born in state of residence (%) - Hispanic or Latino
Place of birth - Born in state of residence (%) - American Indian and Alaska Native
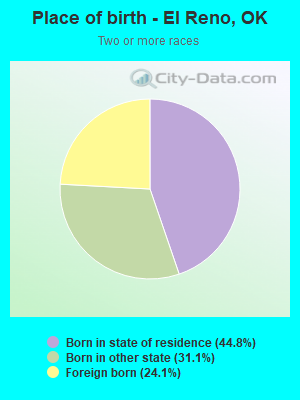
Place of birth - Born in state of residence (%) - Multirace
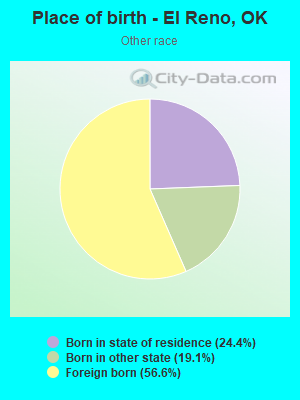
Place of birth - Born in state of residence (%) - Other Race
Place of birth - Born in other state (%)
Place of birth - Born in other state (%) - White
Place of birth - Born in other state (%) - Black or African American
Place of birth - Born in other state (%) - Asian
Place of birth - Born in other state (%) - Hispanic or Latino
Place of birth - Born in other state (%) - American Indian and Alaska Native
Place of birth - Born in other state (%) - Multirace
Place of birth - Born in other state (%) - Other Race
Place of birth - Native, outside of US (%)
Place of birth - Native, outside of US (%) - White
Place of birth - Native, outside of US (%) - Black or African American
Place of birth - Native, outside of US (%) - Asian
Place of birth - Native, outside of US (%) - Hispanic or Latino
Place of birth - Native, outside of US (%) - American Indian and Alaska Native
Place of birth - Native, outside of US (%) - Multirace
Place of birth - Native, outside of US (%) - Other Race
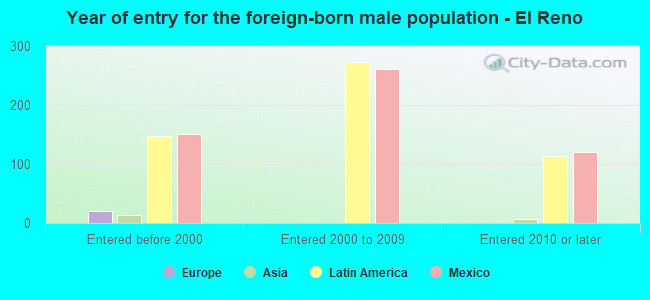
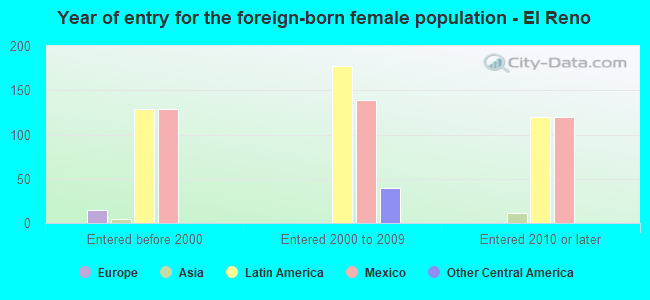
Place of birth - Foreign born (%)
Place of birth - Foreign born (%) - White
Place of birth - Foreign born (%) - Black or African American
Place of birth - Foreign born (%) - Asian
Place of birth - Foreign born (%) - Hispanic or Latino
Place of birth - Foreign born (%) - American Indian and Alaska Native
Place of birth - Foreign born (%) - Multirace
Place of birth - Foreign born (%) - Other Race
Residents speaking English at home (%)
Residents speaking English at home - Born in the United States (%)
Residents speaking English at home - Native, born elsewhere (%)
Residents speaking English at home - Foreign born (%)
Residents speaking Spanish at home (%)
Residents speaking Spanish at home - Born in the United States (%)
Residents speaking Spanish at home - Native, born elsewhere (%)
Residents speaking Spanish at home - Foreign born (%)
Residents speaking other language at home (%)
Residents speaking other language at home - Born in the United States (%)
Residents speaking other language at home - Native, born elsewhere (%)
Residents speaking other language at home - Foreign born (%)
Marital status - Never married (%)
Marital status - Now married (%)
Marital status - Separated (%)
Marital status - Widowed (%)
Marital status - Divorced (%)
Ancestries Reported - Arab (%)
Ancestries Reported - Czech (%)
Ancestries Reported - Danish (%)
Ancestries Reported - Dutch (%)
Ancestries Reported - English (%)
Ancestries Reported - French (%)
Ancestries Reported - French Canadian (%)
Ancestries Reported - German (%)
Ancestries Reported - Greek (%)
Ancestries Reported - Hungarian (%)
Ancestries Reported - Irish (%)
Ancestries Reported - Italian (%)
Ancestries Reported - Lithuanian (%)
Ancestries Reported - Norwegian (%)
Ancestries Reported - Polish (%)
Ancestries Reported - Portuguese (%)
Ancestries Reported - Russian (%)
Ancestries Reported - Scotch-Irish (%)
Ancestries Reported - Scottish (%)
Ancestries Reported - Slovak (%)
Ancestries Reported - Subsaharan African (%)
Ancestries Reported - Swedish (%)
Ancestries Reported - Swiss (%)
Ancestries Reported - Ukrainian (%)
Ancestries Reported - United States (%)
Ancestries Reported - Welsh (%)
Ancestries Reported - West Indian (%)
Ancestries Reported - Other (%)
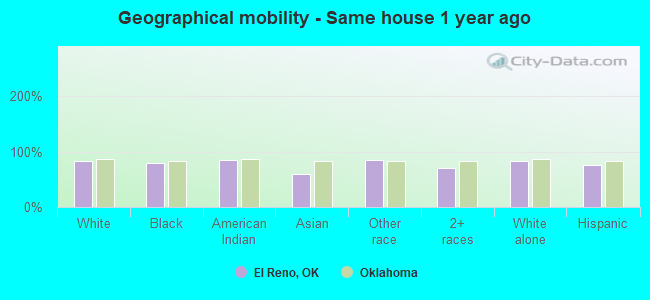
Geographical mobility - Same house 1 year ago (%)
Geographical mobility - Same house 1 year ago (%) - White
Geographical mobility - Same house 1 year ago (%) - Black or African American
Geographical mobility - Same house 1 year ago (%) - Asian
Geographical mobility - Same house 1 year ago (%) - Hispanic or Latino
Geographical mobility - Same house 1 year ago (%) - American Indian and Alaska Native
Geographical mobility - Same house 1 year ago (%) - Multirace
Geographical mobility - Same house 1 year ago (%) - Other Race
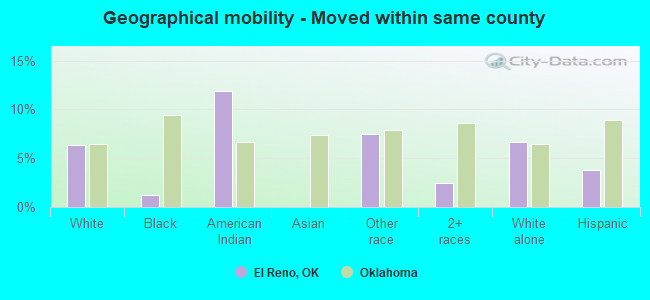
Geographical mobility - Moved within same county (%)
Geographical mobility - Moved within same county (%) - White
Geographical mobility - Moved within same county (%) - Black or African American
Geographical mobility - Moved within same county (%) - Asian
Geographical mobility - Moved within same county (%) - Hispanic or Latino
Geographical mobility - Moved within same county (%) - American Indian and Alaska Native
Geographical mobility - Moved within same county (%) - Multirace
Geographical mobility - Moved within same county (%) - Other Race
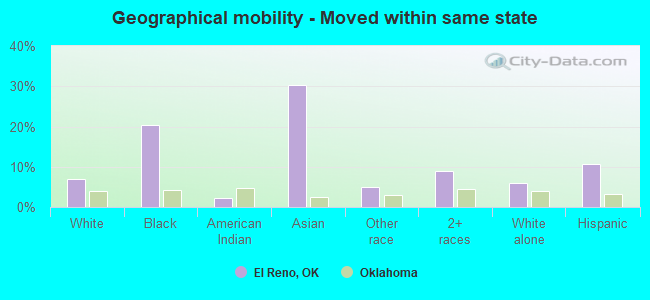
Geographical mobility - Moved from different county within same state (%)
Geographical mobility - Moved from different county within same state (%) - White
Geographical mobility - Moved from different county within same state (%) - Black or African American
Geographical mobility - Moved from different county within same state (%) - Asian
Geographical mobility - Moved from different county within same state (%) - Hispanic or Latino
Geographical mobility - Moved from different county within same state (%) - American Indian and Alaska Native
Geographical mobility - Moved from different county within same state (%) - Multirace
Geographical mobility - Moved from different county within same state (%) - Other Race
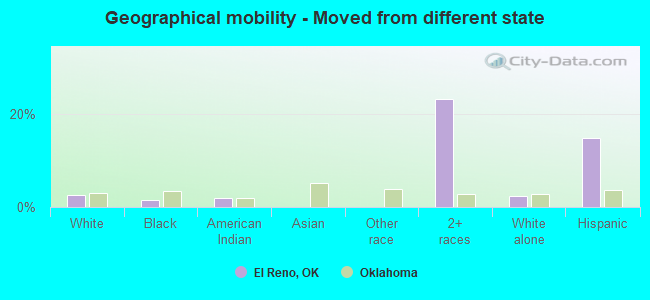
Geographical mobility - Moved from different state (%)
Geographical mobility - Moved from different state (%) - White
Geographical mobility - Moved from different state (%) - Black or African American
Geographical mobility - Moved from different state (%) - Asian
Geographical mobility - Moved from different state (%) - Hispanic or Latino
Geographical mobility - Moved from different state (%) - American Indian and Alaska Native
Geographical mobility - Moved from different state (%) - Multirace
Geographical mobility - Moved from different state (%) - Other Race
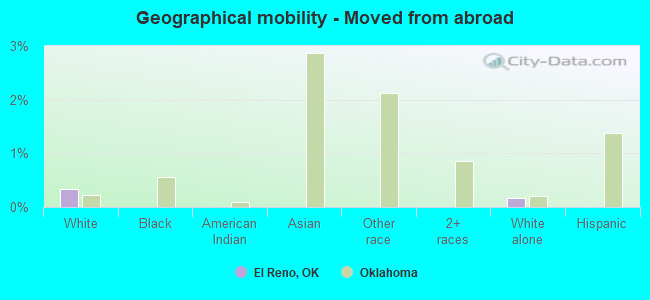
Geographical mobility - Moved from abroad (%)
Geographical mobility - Moved from abroad (%) - White
Geographical mobility - Moved from abroad (%) - Black or African American
Geographical mobility - Moved from abroad (%) - Asian
Geographical mobility - Moved from abroad (%) - Hispanic or Latino
Geographical mobility - Moved from abroad (%) - American Indian and Alaska Native
Geographical mobility - Moved from abroad (%) - Multirace
Geographical mobility - Moved from abroad (%) - Other Race
Place of birth for the foreign-born population - Ireland (%)
Place of birth for the foreign-born population - Denmark (%)
Place of birth for the foreign-born population - Norway (%)
Place of birth for the foreign-born population - Sweden (%)
Place of birth for the foreign-born population - United Kingdom (%)
Place of birth for the foreign-born population - England (%)
Place of birth for the foreign-born population - Scotland (%)
Place of birth for the foreign-born population - Other Northern Europe (%)
Place of birth for the foreign-born population - Austria (%)
Place of birth for the foreign-born population - Belgium (%)
Place of birth for the foreign-born population - France (%)
Place of birth for the foreign-born population - Germany (%)
Place of birth for the foreign-born population - Netherlands (%)
Place of birth for the foreign-born population - Switzerland (%)
Place of birth for the foreign-born population - Other Western Europe (%)
Place of birth for the foreign-born population - Greece (%)
Place of birth for the foreign-born population - Italy (%)
Place of birth for the foreign-born population - Portugal (%)
Place of birth for the foreign-born population - Spain (%)
Place of birth for the foreign-born population - Other Southern Europe (%)
Place of birth for the foreign-born population - Albania (%)
Place of birth for the foreign-born population - Belarus (%)
Place of birth for the foreign-born population - Bosnia and Herzegovina (%)
Place of birth for the foreign-born population - Bulgaria (%)
Place of birth for the foreign-born population - Croatia (%)
Place of birth for the foreign-born population - Czechoslovakia (%)
Place of birth for the foreign-born population - Hungary (%)
Place of birth for the foreign-born population - Latvia (%)
Place of birth for the foreign-born population - Lithuania (%)
Place of birth for the foreign-born population - North Macedonia (Macedonia) (%)
Place of birth for the foreign-born population - Moldova (%)
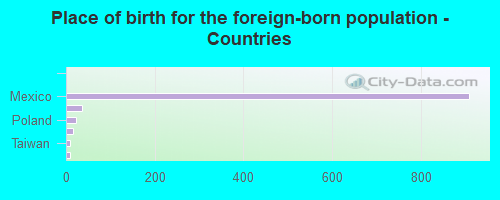
Place of birth for the foreign-born population - Poland (%)
Place of birth for the foreign-born population - Romania (%)
Place of birth for the foreign-born population - Russia (%)
Place of birth for the foreign-born population - Serbia (%)
Place of birth for the foreign-born population - Ukraine (%)
Place of birth for the foreign-born population - Other Eastern Europe (%)
Place of birth for the foreign-born population - China (%)
Place of birth for the foreign-born population - Hong Kong (%)
Place of birth for the foreign-born population - Taiwan (%)
Place of birth for the foreign-born population - Japan (%)
Place of birth for the foreign-born population - Korea (%)
Place of birth for the foreign-born population - Other Eastern Asia (%)
Place of birth for the foreign-born population - Afghanistan (%)
Place of birth for the foreign-born population - Bangladesh (%)
Place of birth for the foreign-born population - India (%)
Place of birth for the foreign-born population - Iran (%)
Place of birth for the foreign-born population - Kazakhstan (%)
Place of birth for the foreign-born population - Nepal (%)
Place of birth for the foreign-born population - Pakistan (%)
Place of birth for the foreign-born population - Sri Lanka (%)
Place of birth for the foreign-born population - Uzbekistan (%)
Place of birth for the foreign-born population - Other South Central Asia (%)
Place of birth for the foreign-born population - Burma (%)
Place of birth for the foreign-born population - Cambodia (%)
Place of birth for the foreign-born population - Indonesia (%)
Place of birth for the foreign-born population - Laos (%)
Place of birth for the foreign-born population - Malaysia (%)
Place of birth for the foreign-born population - Philippines (%)
Place of birth for the foreign-born population - Singapore (%)
Place of birth for the foreign-born population - Thailand (%)
Place of birth for the foreign-born population - Vietnam (%)
Place of birth for the foreign-born population - Other South Eastern Asia (%)
Place of birth for the foreign-born population - Armenia (%)
Place of birth for the foreign-born population - Iraq (%)
Place of birth for the foreign-born population - Israel (%)
Place of birth for the foreign-born population - Jordan (%)
Place of birth for the foreign-born population - Kuwait (%)
Place of birth for the foreign-born population - Lebanon (%)
Place of birth for the foreign-born population - Saudi Arabia (%)
Place of birth for the foreign-born population - Syria (%)
Place of birth for the foreign-born population - Turkey (%)
Place of birth for the foreign-born population - Yemen (%)
Place of birth for the foreign-born population - Other Western Asia (%)
Place of birth for the foreign-born population - Eritrea (%)
Place of birth for the foreign-born population - Ethiopia (%)
Place of birth for the foreign-born population - Kenya (%)
Place of birth for the foreign-born population - Somalia (%)
Place of birth for the foreign-born population - Uganda (%)
Place of birth for the foreign-born population - Zimbabwe (%)
Place of birth for the foreign-born population - Other Eastern Africa (%)
Place of birth for the foreign-born population - Cameroon (%)
Place of birth for the foreign-born population - Congo (%)
Place of birth for the foreign-born population - Democratic Republic of Congo (Zaire) (%)
Place of birth for the foreign-born population - Other Middle Africa (%)
Place of birth for the foreign-born population - Egypt (%)
Place of birth for the foreign-born population - Morocco (%)
Place of birth for the foreign-born population - Sudan (%)
Place of birth for the foreign-born population - Other Northern Africa (%)
Place of birth for the foreign-born population - South Africa (%)
Place of birth for the foreign-born population - Other Southern Africa (%)
Place of birth for the foreign-born population - Cabo Verde (%)
Place of birth for the foreign-born population - Ghana (%)
Place of birth for the foreign-born population - Liberia (%)
Place of birth for the foreign-born population - Nigeria (%)
Place of birth for the foreign-born population - Senegal (%)
Place of birth for the foreign-born population - Sierra Leone (%)
Place of birth for the foreign-born population - Other Western Africa (%)
Place of birth for the foreign-born population - Australia (%)
Place of birth for the foreign-born population - New Zealand (%)
Place of birth for the foreign-born population - Fiji (%)
Place of birth for the foreign-born population - Micronesia (%)
Place of birth for the foreign-born population - Bahamas (%)
Place of birth for the foreign-born population - Barbados (%)
Place of birth for the foreign-born population - Cuba (%)
Place of birth for the foreign-born population - Dominica (%)
Place of birth for the foreign-born population - Dominican Republic (%)
Place of birth for the foreign-born population - Grenada (%)
Place of birth for the foreign-born population - Haiti (%)
Place of birth for the foreign-born population - Jamaica (%)
Place of birth for the foreign-born population - St. Vincent and the Grenadines (%)
Place of birth for the foreign-born population - Trinidad and Tobago (%)
Place of birth for the foreign-born population - West Indies (%)
Place of birth for the foreign-born population - Other Caribbean (%)
Place of birth for the foreign-born population - Belize (%)
Place of birth for the foreign-born population - Costa Rica (%)
Place of birth for the foreign-born population - El Salvador (%)
Place of birth for the foreign-born population - Guatemala (%)
Place of birth for the foreign-born population - Honduras (%)
Place of birth for the foreign-born population - Mexico (%)
Place of birth for the foreign-born population - Nicaragua (%)
Place of birth for the foreign-born population - Panama (%)
Place of birth for the foreign-born population - Other Central America (%)
Place of birth for the foreign-born population - Argentina (%)
Place of birth for the foreign-born population - Bolivia (%)
Place of birth for the foreign-born population - Brazil (%)
Place of birth for the foreign-born population - Chile (%)
Place of birth for the foreign-born population - Colombia (%)
Place of birth for the foreign-born population - Ecuador (%)
Place of birth for the foreign-born population - Guyana (%)
Place of birth for the foreign-born population - Peru (%)
Place of birth for the foreign-born population - Uruguay (%)
Place of birth for the foreign-born population - Venezuela (%)
Place of birth for the foreign-born population - Other South America (%)
Place of birth for the foreign-born population - Canada (%)
Place of birth for the foreign-born population - Other Northern America (%)
Place of birth for the foreign-born population - Other (%)
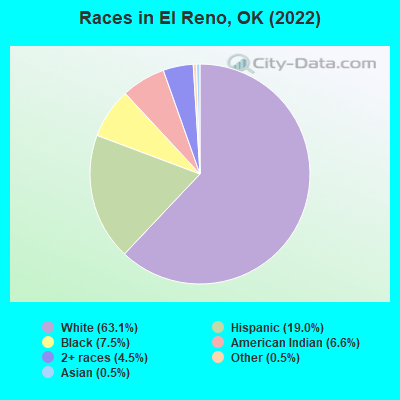
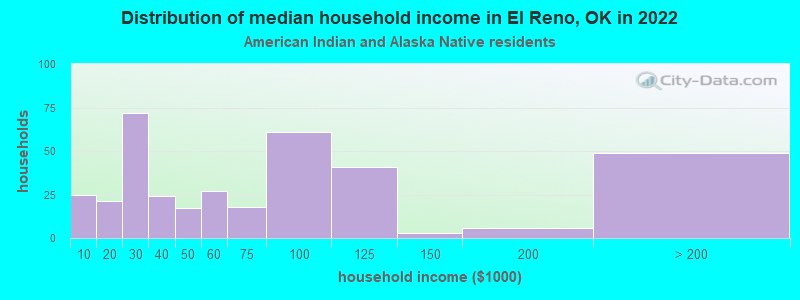
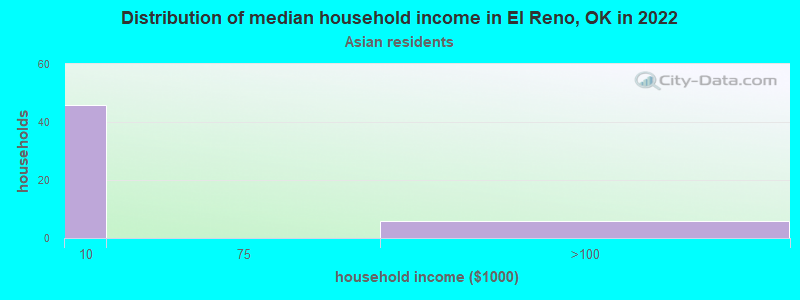
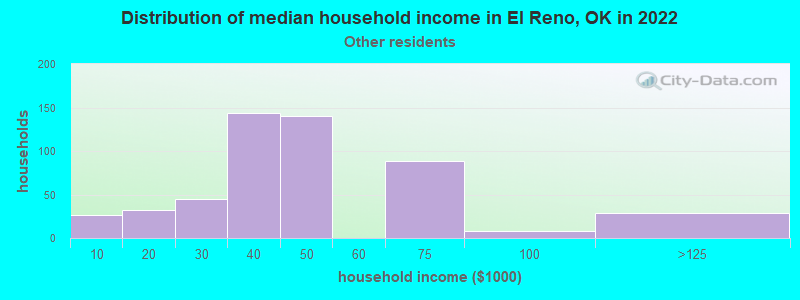
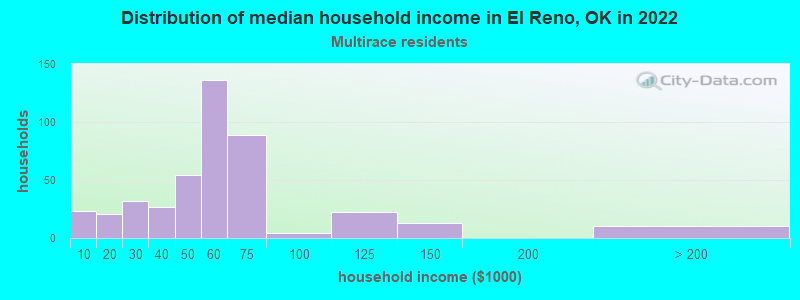
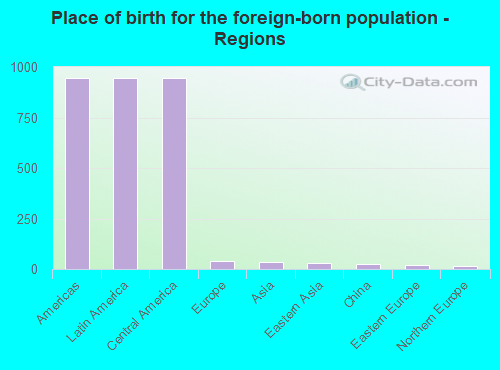
According to 2022 data, the most numerous races in El Reno, OK are White alone (11,897 residents), Hispanic (3,578 residents), and Two or more races (848 residents). 89.0% of El Reno residents speak English at home. 5.4% of El Reno, OK residents are foreign-born (5.4% born in Latin America), which is 11.0% less than the foreign-born rate of 6.0% across the entire state of Oklahoma.
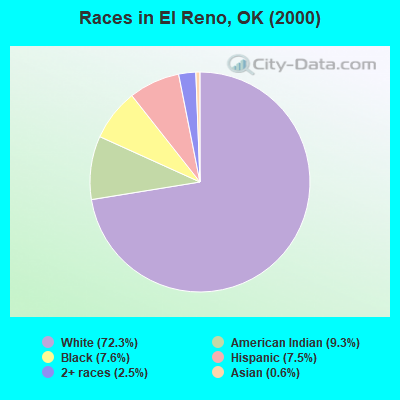
Race distribution in El Reno
2000 2022
2,556,368 74.1% White alone 266,158 7.7% American Indian alone 257,981 7.5% Black alone 179,304 5.2% Hispanic 140,249 4.1% Two or more races 46,172 1.3% Asian alone 2,322 0.07% Other race alone 2,100 0.06% Native Hawaiian and Other
2,517,403 62.6% White alone 486,692 12.1% Hispanic 364,453 9.1% Two or more races 273,650 6.8% American Indian alone 268,543 6.7% Black alone 92,672 2.3% Asian alone 10,786 0.3% Other race alone 5,601 0.1% Native Hawaiian and Other
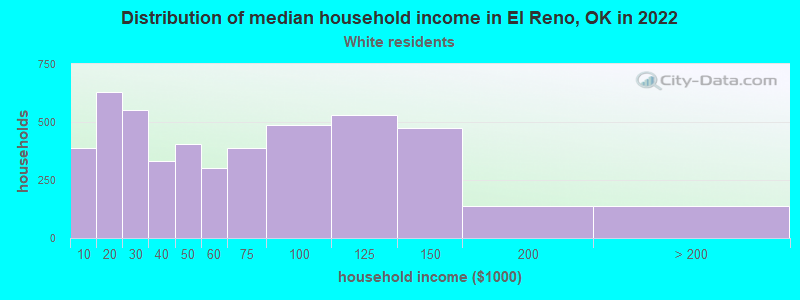
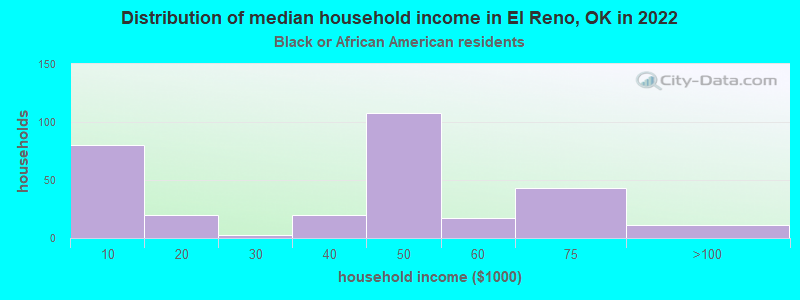
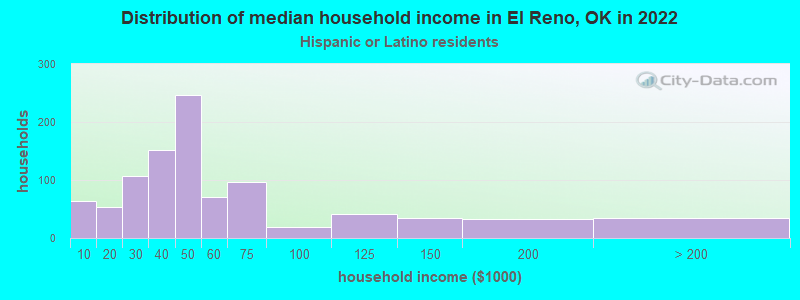
Income and house value in El Reno Median household income in 2022 $53,865 White non-Hispanic householders$52,379 Black householders$53,164 American Indian and Alaska Native householders$2,181 Asian householders$58,053 Some other race householders$58,643 Two or more races householders$47,811 Hispanic or Latino race householdersMedian 2022 house value $163,237 White Non-Hispanic householders$129,275 Black or African American householders$134,205 American Indian or Alaska Native householders $150,638 Asian householders$91,204 Some other race householders$162,689 Two or more races householders$116,950 Hispanic or Latino householders
Median age by race in El Reno
38.9 Median age for White residents37.5 40.7 37.1 Median age for Black or African American residents33.5 42.7 34.3 Median age for American Indian / Alaska Native residents39.5 17.4 34.5 Median age for Asian residents15.6 37.4 -846,761,452.5 Median age for Native Hawaiian / Pacific Islander residents-666,666,666.0 -767,251,461.2 33.5 Median age for Other race residents35.2 22.1 30.0 Median age for Two or more races residents34.1 30.2 39.3 Median age for White alone residents37.9 42.0 30.7 Median age for Hispanic or Latino residents34.5 25.5
Owner/renter occupied households by race in El Reno
House owners and renters - White residents 3,009 62.0% Owner occupied1,843 38.0% Renter occupiedHouse owners and renters - Black or African American residents 127 43.8% Owner occupied164 56.2% Renter occupiedHouse owners and renters - American Indian / Alaska Native residents 151 32.1% Owner occupied318 67.9% Renter occupiedHouse owners and renters - Asian residents 10 25.7% Owner occupied30 74.3% Renter occupiedHouse owners and renters - Other race residents 132 50.5% Owner occupied130 49.5% Renter occupiedHouse owners and renters - Two or more races residents 214 53.1% Owner occupied189 46.9% Renter occupiedHouse owners and renters - White alone residents 2,983 63.5% Owner occupied1,715 36.5% Renter occupiedHouse owners and renters - Hispanic or Latino residents 431 46.3% Owner occupied500 53.7% Renter occupied
Language usage in El Reno
English speakers - Total 89.0% of residents of El Reno speak English at home.
10.4% of residents speak Spanish at home 968 52.2% Speak English very well888 47.8% Speak English less than very well0.9% of residents speak other language at home 58 34.9% Speak English very well108 65.1% Speak English less than very well
English speakers - Born in the United States 92.8% of residents of El Reno speak English at home.
7.7% of residents speak Spanish at home 292 66.4% Speak English very well148 33.6% Speak English less than very well0.4% of residents speak other language at home 18 72.0% Speak English very well7 28.0% Speak English less than very well
English speakers - Native, born elsewhere 76.7% of residents of El Reno speak English at home.
12.5% of residents speak other language at home 22 100.0% Speak English less than very well
English speakers - Foreign-born 2.4% of residents of El Reno speak English at home.
92.7% of residents speak Spanish at home 256 28.9% Speak English very well629 71.1% Speak English less than very well5.9% of residents speak other language at home 24 42.9% Speak English very well32 57.1% Speak English less than very well
White (Caucasian) - Speak another language Native:
2.6% (312)Foreign-born:
87.1% (32)
American Indian / Alaska Native - Speak another language Native:
1.9% (22)Foreign-born:
100.0% (21)
Asian - Speak another language Native:
42.7% (24)Foreign-born:
100.0% (26)
Other race - Speak only English Native:
31.4% (153)Foreign-born:
2.1% (16)
Other race - Speak another language Native:
69.4% (339)Foreign-born:
97.9% (736)
Two or more races - Speak only English Native:
82.0% (1,177)Foreign-born:
1.4% (7)
Two or more races - Speak another language Native:
14.9% (214)Foreign-born:
100.0% (528)
White alone - Speak another language Native:
0.7% (82)Foreign-born:
100.0% (41)
Hispanic or Latino - Speak only English Native:
65.0% (1,479)Foreign-born:
4.2% (38)
Hispanic or Latino - Speak another language Native:
35.0% (795)Foreign-born:
95.6% (861)
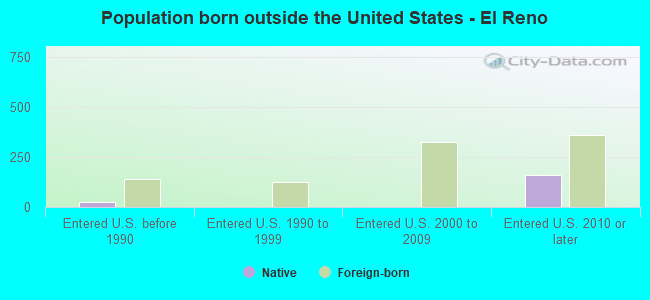
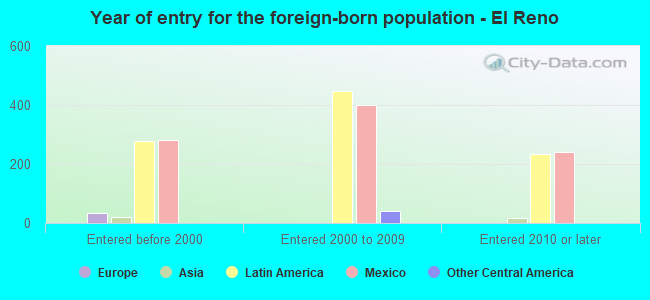
Foreign-born residents in El Reno 1,020 residents are foreign born (5.4% Latin America ).
This city:
5.4%Oklahoma:
6.1%
Marital status for residents in El Reno Marital status - White (Caucasian) population 15 years and over
Males 37.8% Never married42.5% Now married2.2% Separated2.6% Widowed14.9% DivorcedFemales 24.0% Never married41.1% Now married1.5% Separated10.9% Widowed22.5% DivorcedWomen who gave birth in the past 12 months Now married:
62.2% (78)Unmarried:
37.8% (48)
Women who did not give birth in the past 12 months Now married:
39.5% (1,164)Unmarried:
60.5% (1,779)
Marital status - Black or African American population 15 years and over
Males 71.1% Never married18.3% Now married4.0% Separated0.2% Widowed6.3% DivorcedFemales 61.8% Never married8.7% Now married0.0% Separated6.6% Widowed23.0% DivorcedWomen who did not give birth in the past 12 months Now married:
2.2% (6)Unmarried:
97.8% (250)
Marital status - American Indian / Alaska Native population 15 years and over
Males 41.5% Never married40.4% Now married1.1% Separated5.9% Widowed11.1% DivorcedFemales 49.6% Never married34.2% Now married0.0% Separated4.1% Widowed12.1% DivorcedWomen who gave birth in the past 12 months Now married:
0.0% (0)Unmarried:
100.0% (38)
Women who did not give birth in the past 12 months Now married:
28.7% (119)Unmarried:
71.3% (295)
Marital status - Asian population 15 years and over
Males 31.2% Never married68.8% Now married0.0% Separated0.0% Widowed0.0% DivorcedFemales 0.0% Never married87.8% Now married0.0% Separated0.0% Widowed12.2% DivorcedWomen who did not give birth in the past 12 months Now married:
100.0% (43)Unmarried:
0.0% (0)
Marital status - Other race population 15 years and over
Males 35.6% Never married38.4% Now married5.4% Separated0.0% Widowed20.7% DivorcedFemales 44.4% Never married44.9% Now married3.0% Separated0.0% Widowed7.7% DivorcedWomen who gave birth in the past 12 months Now married:
100.0% (15)Unmarried:
0.0% (0)
Women who did not give birth in the past 12 months Now married:
33.8% (128)Unmarried:
66.2% (249)
Marital status - Two or more races population 15 years and over
Males 54.2% Never married42.2% Now married0.9% Separated1.6% Widowed1.1% DivorcedFemales 36.9% Never married47.3% Now married0.0% Separated2.8% Widowed13.0% DivorcedWomen who did not give birth in the past 12 months Now married:
44.2% (230)Unmarried:
55.8% (290)
Marital status - White alone, not Hispanic / Latino population 15 years and over
Males 37.0% Never married43.6% Now married2.0% Separated2.7% Widowed14.7% DivorcedFemales 23.0% Never married40.6% Now married1.3% Separated11.5% Widowed23.6% DivorcedWomen who gave birth in the past 12 months Now married:
67.3% (78)Unmarried:
32.7% (38)
Women who did not give birth in the past 12 months Now married:
38.1% (1,012)Unmarried:
61.9% (1,646)
Marital status - Hispanic or Latino population 15 years and over
Males 45.3% Never married37.4% Now married3.7% Separated0.8% Widowed12.8% DivorcedFemales 46.1% Never married48.0% Now married1.1% Separated0.3% Widowed4.4% DivorcedWomen who gave birth in the past 12 months Now married:
0.0% (0)Unmarried:
100.0% (11)
Women who did not give birth in the past 12 months Now married:
40.7% (393)Unmarried:
59.3% (574)
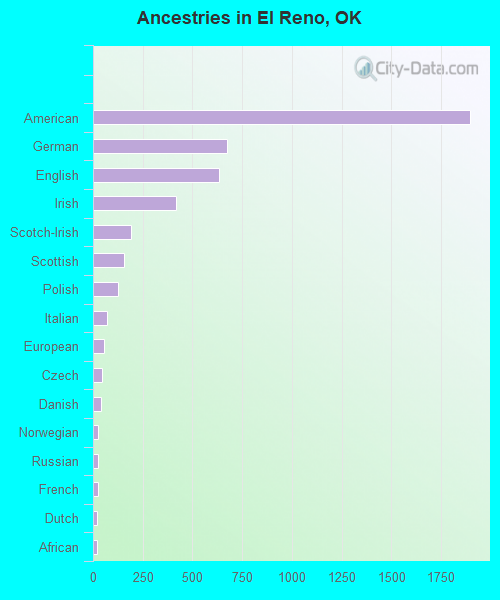
Ancestries in El Reno
1,897 20.2% American673 7.2% German634 6.8% English415 4.4% Irish190 2.0% Scotch-Irish154 1.6% Scottish127 1.4% Polish70 0.7% Italian54 0.6% European45 0.5% Czech39 0.4% Danish26 0.3% Norwegian24 0.3% Russian23 0.2% French19 0.2% Dutch18 0.2% African14 0.1% Eastern European9 0.10% Swiss8 0.09% Ukrainian
Geographical mobility in El Reno Same house 1 year ago 10,396 83.0% White (Caucasian)985 78.8% Black or African American1,517 84.0% American Indian / Alaska Native56 59.1% Asian1,187 85.4% Other race1,425 69.5% Two or more races9,849 83.4% White alone, not Hispanic / Latino2,613 75.1% Hispanic or LatinoMoved within same county 793 6.3% White / Caucasian16 1.2% Black or African American215 11.9% American Indian / Alaska Native103 7.4% Other race50 2.4% Two or more races793 6.7% White alone, not Hispanic / Latino131 3.8% Hispanic or LatinoMoved within same state 869 6.9% White / Caucasian254 20.3% Black or African American41 2.3% American Indian / Alaska Native28 30.2% Asian67 4.9% Other race181 8.8% Two or more races716 6.1% White alone, not Hispanic / Latino371 10.7% Hispanic or LatinoMoved from different state 323 2.6% White / Caucasian20 1.6% Black or African American35 1.9% American Indian / Alaska Native474 23.1% Two or more races291 2.5% White alone, not Hispanic / Latino516 14.8% Hispanic or LatinoMoved from abroad 41 0.3% White20 0.2% White alone, not Hispanic / Latino
Children Nativity (place of birth) in El Reno
Children under 6 years - Living with two parents Both parents native 586 100.0% NativeBoth parents foreign-born 23 53.5% Native20 46.5% Foreign-bornOne native, one foreign-born parent 4 100.0% NativeChildren under 6 years - Living with one parent Native parent 437 100.0% NativeForeign-born parent 84 100.0% NativeChildren 6 to 17 years - Living with two parents Both parents native 1,545 100.0% NativeBoth parents foreign-born 75 61.4% Native47 38.6% Foreign-bornOne native, one foreign-born parent 46 100.0% NativeChildren 6 to 17 years - Living with one parent Native parent 939 100.0% NativeForeign-born parent 250 49.7% Native253 50.3% Foreign-born
Grandparents responsible for own grandchildren in El Reno
Grandparents (30 to 59 years) White / Caucasian 41 41.2% Responsible for grandchildren59 58.8% Not responsible for grandchildrenBlack or African American 6 100.0% Responsible for grandchildrenAmerican Indian / Alaska Native 31 73.8% Responsible for grandchildren11 26.2% Not responsible for grandchildrenOther race 22 64.5% Responsible for grandchildren12 35.5% Not responsible for grandchildrenTwo or more races 40 100.0% Not responsible for grandchildrenWhite alone, not Hispanic / Latino 41 39.7% Responsible for grandchildren63 60.3% Not responsible for grandchildrenHispanic or Latino 14 32.0% Responsible for grandchildren30 68.0% Not responsible for grandchildrenGrandparents (60 years and over) White / Caucasian 61 100.0% Responsible for grandchildrenAmerican Indian / Alaska Native 9 18.4% Responsible for grandchildren39 81.6% Not responsible for grandchildrenTwo or more races 29 100.0% Responsible for grandchildrenWhite alone, not Hispanic / Latino 58 100.0% Responsible for grandchildrenHispanic or Latino 23 100.0% Responsible for grandchildren