Races in Ellicott City, Maryland (MD) Detailed Stats
Data:
Races - White alone (%)
Races - White alone (% change since 2000)
Races - Black alone (%)
Races - Black alone (% change since 2000)
Races - American Indian alone (%)
Races - American Indian alone (% change since 2000)
Races - Asian alone (%)
Races - Asian alone (% change since 2000)
Races - Hispanic (%)
Races - Hispanic (% change since 2000)
Races - Native Hawaiian and Other Pacific Islander alone (%)
Races - Native Hawaiian and Other Pacific Islander alone (% change since 2000)
Races - Two or more races(%)
Races - Two or more races(% change since 2000)
Races - Other race alone (%)
Races - Other race alone (% change since 2000)
Racial diversity
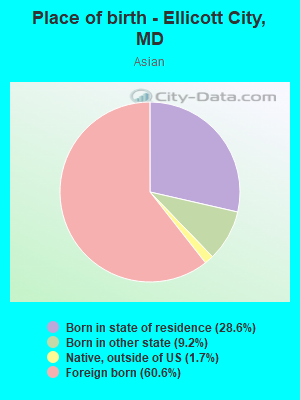
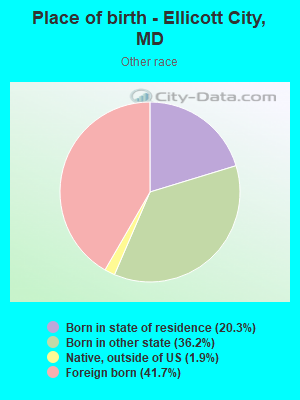
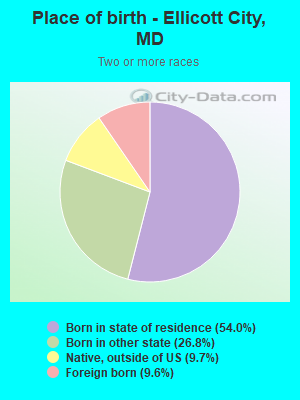
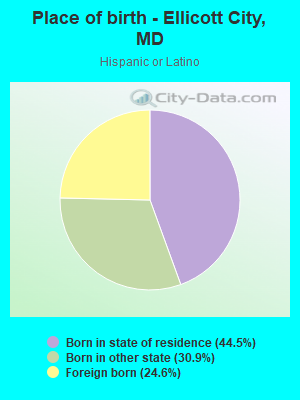
Place of birth - Born in state of residence (%)
Place of birth - Born in state of residence (%) - White
Place of birth - Born in state of residence (%) - Black or African American
Place of birth - Born in state of residence (%) - Asian
Place of birth - Born in state of residence (%) - Hispanic or Latino
Place of birth - Born in state of residence (%) - American Indian and Alaska Native
Place of birth - Born in state of residence (%) - Multirace
Place of birth - Born in state of residence (%) - Other Race
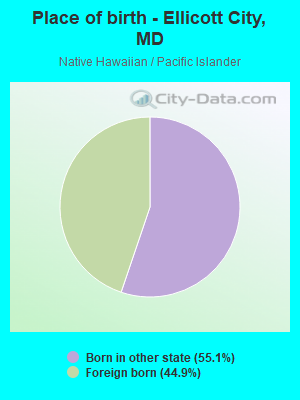
Place of birth - Born in other state (%)
Place of birth - Born in other state (%) - White
Place of birth - Born in other state (%) - Black or African American
Place of birth - Born in other state (%) - Asian
Place of birth - Born in other state (%) - Hispanic or Latino
Place of birth - Born in other state (%) - American Indian and Alaska Native
Place of birth - Born in other state (%) - Multirace
Place of birth - Born in other state (%) - Other Race
Place of birth - Native, outside of US (%)
Place of birth - Native, outside of US (%) - White
Place of birth - Native, outside of US (%) - Black or African American
Place of birth - Native, outside of US (%) - Asian
Place of birth - Native, outside of US (%) - Hispanic or Latino
Place of birth - Native, outside of US (%) - American Indian and Alaska Native
Place of birth - Native, outside of US (%) - Multirace
Place of birth - Native, outside of US (%) - Other Race
Place of birth - Foreign born (%)
Place of birth - Foreign born (%) - White
Place of birth - Foreign born (%) - Black or African American
Place of birth - Foreign born (%) - Asian
Place of birth - Foreign born (%) - Hispanic or Latino
Place of birth - Foreign born (%) - American Indian and Alaska Native
Place of birth - Foreign born (%) - Multirace
Place of birth - Foreign born (%) - Other Race
Residents speaking English at home (%)
Residents speaking English at home - Born in the United States (%)
Residents speaking English at home - Native, born elsewhere (%)
Residents speaking English at home - Foreign born (%)
Residents speaking Spanish at home (%)
Residents speaking Spanish at home - Born in the United States (%)
Residents speaking Spanish at home - Native, born elsewhere (%)
Residents speaking Spanish at home - Foreign born (%)
Residents speaking other language at home (%)
Residents speaking other language at home - Born in the United States (%)
Residents speaking other language at home - Native, born elsewhere (%)
Residents speaking other language at home - Foreign born (%)
Marital status - Never married (%)
Marital status - Now married (%)
Marital status - Separated (%)
Marital status - Widowed (%)
Marital status - Divorced (%)
Ancestries Reported - Arab (%)
Ancestries Reported - Czech (%)
Ancestries Reported - Danish (%)
Ancestries Reported - Dutch (%)
Ancestries Reported - English (%)
Ancestries Reported - French (%)
Ancestries Reported - French Canadian (%)
Ancestries Reported - German (%)
Ancestries Reported - Greek (%)
Ancestries Reported - Hungarian (%)
Ancestries Reported - Irish (%)
Ancestries Reported - Italian (%)
Ancestries Reported - Lithuanian (%)
Ancestries Reported - Norwegian (%)
Ancestries Reported - Polish (%)
Ancestries Reported - Portuguese (%)
Ancestries Reported - Russian (%)
Ancestries Reported - Scotch-Irish (%)
Ancestries Reported - Scottish (%)
Ancestries Reported - Slovak (%)
Ancestries Reported - Subsaharan African (%)
Ancestries Reported - Swedish (%)
Ancestries Reported - Swiss (%)
Ancestries Reported - Ukrainian (%)
Ancestries Reported - United States (%)
Ancestries Reported - Welsh (%)
Ancestries Reported - West Indian (%)
Ancestries Reported - Other (%)
Geographical mobility - Same house 1 year ago (%)
Geographical mobility - Same house 1 year ago (%) - White
Geographical mobility - Same house 1 year ago (%) - Black or African American
Geographical mobility - Same house 1 year ago (%) - Asian
Geographical mobility - Same house 1 year ago (%) - Hispanic or Latino
Geographical mobility - Same house 1 year ago (%) - American Indian and Alaska Native
Geographical mobility - Same house 1 year ago (%) - Multirace
Geographical mobility - Same house 1 year ago (%) - Other Race
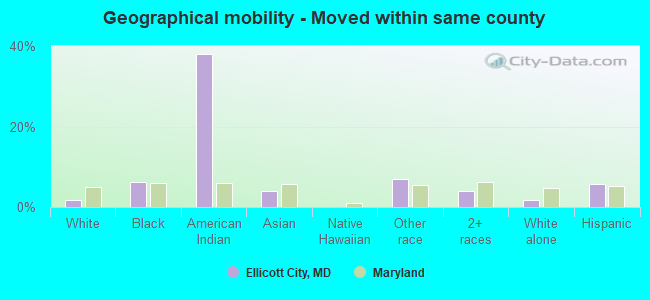
Geographical mobility - Moved within same county (%)
Geographical mobility - Moved within same county (%) - White
Geographical mobility - Moved within same county (%) - Black or African American
Geographical mobility - Moved within same county (%) - Asian
Geographical mobility - Moved within same county (%) - Hispanic or Latino
Geographical mobility - Moved within same county (%) - American Indian and Alaska Native
Geographical mobility - Moved within same county (%) - Multirace
Geographical mobility - Moved within same county (%) - Other Race
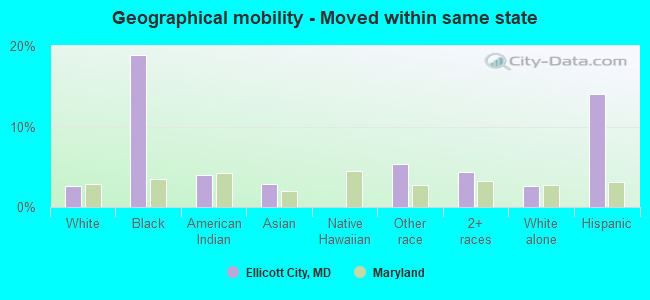
Geographical mobility - Moved from different county within same state (%)
Geographical mobility - Moved from different county within same state (%) - White
Geographical mobility - Moved from different county within same state (%) - Black or African American
Geographical mobility - Moved from different county within same state (%) - Asian
Geographical mobility - Moved from different county within same state (%) - Hispanic or Latino
Geographical mobility - Moved from different county within same state (%) - American Indian and Alaska Native
Geographical mobility - Moved from different county within same state (%) - Multirace
Geographical mobility - Moved from different county within same state (%) - Other Race
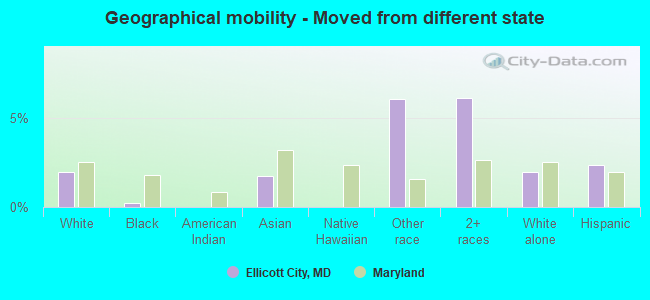
Geographical mobility - Moved from different state (%)
Geographical mobility - Moved from different state (%) - White
Geographical mobility - Moved from different state (%) - Black or African American
Geographical mobility - Moved from different state (%) - Asian
Geographical mobility - Moved from different state (%) - Hispanic or Latino
Geographical mobility - Moved from different state (%) - American Indian and Alaska Native
Geographical mobility - Moved from different state (%) - Multirace
Geographical mobility - Moved from different state (%) - Other Race
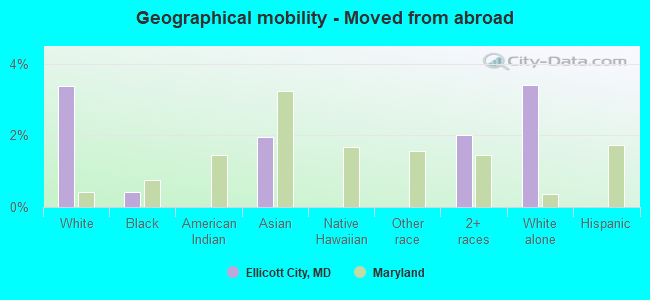
Geographical mobility - Moved from abroad (%)
Geographical mobility - Moved from abroad (%) - White
Geographical mobility - Moved from abroad (%) - Black or African American
Geographical mobility - Moved from abroad (%) - Asian
Geographical mobility - Moved from abroad (%) - Hispanic or Latino
Geographical mobility - Moved from abroad (%) - American Indian and Alaska Native
Geographical mobility - Moved from abroad (%) - Multirace
Geographical mobility - Moved from abroad (%) - Other Race
Place of birth for the foreign-born population - Ireland (%)
Place of birth for the foreign-born population - Denmark (%)
Place of birth for the foreign-born population - Norway (%)
Place of birth for the foreign-born population - Sweden (%)
Place of birth for the foreign-born population - United Kingdom (%)
Place of birth for the foreign-born population - England (%)
Place of birth for the foreign-born population - Scotland (%)
Place of birth for the foreign-born population - Other Northern Europe (%)
Place of birth for the foreign-born population - Austria (%)
Place of birth for the foreign-born population - Belgium (%)
Place of birth for the foreign-born population - France (%)
Place of birth for the foreign-born population - Germany (%)
Place of birth for the foreign-born population - Netherlands (%)
Place of birth for the foreign-born population - Switzerland (%)
Place of birth for the foreign-born population - Other Western Europe (%)
Place of birth for the foreign-born population - Greece (%)
Place of birth for the foreign-born population - Italy (%)
Place of birth for the foreign-born population - Portugal (%)
Place of birth for the foreign-born population - Spain (%)
Place of birth for the foreign-born population - Other Southern Europe (%)
Place of birth for the foreign-born population - Albania (%)
Place of birth for the foreign-born population - Belarus (%)
Place of birth for the foreign-born population - Bosnia and Herzegovina (%)
Place of birth for the foreign-born population - Bulgaria (%)
Place of birth for the foreign-born population - Croatia (%)
Place of birth for the foreign-born population - Czechoslovakia (%)
Place of birth for the foreign-born population - Hungary (%)
Place of birth for the foreign-born population - Latvia (%)
Place of birth for the foreign-born population - Lithuania (%)
Place of birth for the foreign-born population - North Macedonia (Macedonia) (%)
Place of birth for the foreign-born population - Moldova (%)
Place of birth for the foreign-born population - Poland (%)
Place of birth for the foreign-born population - Romania (%)
Place of birth for the foreign-born population - Russia (%)
Place of birth for the foreign-born population - Serbia (%)
Place of birth for the foreign-born population - Ukraine (%)
Place of birth for the foreign-born population - Other Eastern Europe (%)
Place of birth for the foreign-born population - China (%)
Place of birth for the foreign-born population - Hong Kong (%)
Place of birth for the foreign-born population - Taiwan (%)
Place of birth for the foreign-born population - Japan (%)
Place of birth for the foreign-born population - Korea (%)
Place of birth for the foreign-born population - Other Eastern Asia (%)
Place of birth for the foreign-born population - Afghanistan (%)
Place of birth for the foreign-born population - Bangladesh (%)
Place of birth for the foreign-born population - India (%)
Place of birth for the foreign-born population - Iran (%)
Place of birth for the foreign-born population - Kazakhstan (%)
Place of birth for the foreign-born population - Nepal (%)
Place of birth for the foreign-born population - Pakistan (%)
Place of birth for the foreign-born population - Sri Lanka (%)
Place of birth for the foreign-born population - Uzbekistan (%)
Place of birth for the foreign-born population - Other South Central Asia (%)
Place of birth for the foreign-born population - Burma (%)
Place of birth for the foreign-born population - Cambodia (%)
Place of birth for the foreign-born population - Indonesia (%)
Place of birth for the foreign-born population - Laos (%)
Place of birth for the foreign-born population - Malaysia (%)
Place of birth for the foreign-born population - Philippines (%)
Place of birth for the foreign-born population - Singapore (%)
Place of birth for the foreign-born population - Thailand (%)
Place of birth for the foreign-born population - Vietnam (%)
Place of birth for the foreign-born population - Other South Eastern Asia (%)
Place of birth for the foreign-born population - Armenia (%)
Place of birth for the foreign-born population - Iraq (%)
Place of birth for the foreign-born population - Israel (%)
Place of birth for the foreign-born population - Jordan (%)
Place of birth for the foreign-born population - Kuwait (%)
Place of birth for the foreign-born population - Lebanon (%)
Place of birth for the foreign-born population - Saudi Arabia (%)
Place of birth for the foreign-born population - Syria (%)
Place of birth for the foreign-born population - Turkey (%)
Place of birth for the foreign-born population - Yemen (%)
Place of birth for the foreign-born population - Other Western Asia (%)
Place of birth for the foreign-born population - Eritrea (%)
Place of birth for the foreign-born population - Ethiopia (%)
Place of birth for the foreign-born population - Kenya (%)
Place of birth for the foreign-born population - Somalia (%)
Place of birth for the foreign-born population - Uganda (%)
Place of birth for the foreign-born population - Zimbabwe (%)
Place of birth for the foreign-born population - Other Eastern Africa (%)
Place of birth for the foreign-born population - Cameroon (%)
Place of birth for the foreign-born population - Congo (%)
Place of birth for the foreign-born population - Democratic Republic of Congo (Zaire) (%)
Place of birth for the foreign-born population - Other Middle Africa (%)
Place of birth for the foreign-born population - Egypt (%)
Place of birth for the foreign-born population - Morocco (%)
Place of birth for the foreign-born population - Sudan (%)
Place of birth for the foreign-born population - Other Northern Africa (%)
Place of birth for the foreign-born population - South Africa (%)
Place of birth for the foreign-born population - Other Southern Africa (%)
Place of birth for the foreign-born population - Cabo Verde (%)
Place of birth for the foreign-born population - Ghana (%)
Place of birth for the foreign-born population - Liberia (%)
Place of birth for the foreign-born population - Nigeria (%)
Place of birth for the foreign-born population - Senegal (%)
Place of birth for the foreign-born population - Sierra Leone (%)
Place of birth for the foreign-born population - Other Western Africa (%)
Place of birth for the foreign-born population - Australia (%)
Place of birth for the foreign-born population - New Zealand (%)
Place of birth for the foreign-born population - Fiji (%)
Place of birth for the foreign-born population - Micronesia (%)
Place of birth for the foreign-born population - Bahamas (%)
Place of birth for the foreign-born population - Barbados (%)
Place of birth for the foreign-born population - Cuba (%)
Place of birth for the foreign-born population - Dominica (%)
Place of birth for the foreign-born population - Dominican Republic (%)
Place of birth for the foreign-born population - Grenada (%)
Place of birth for the foreign-born population - Haiti (%)
Place of birth for the foreign-born population - Jamaica (%)
Place of birth for the foreign-born population - St. Vincent and the Grenadines (%)
Place of birth for the foreign-born population - Trinidad and Tobago (%)
Place of birth for the foreign-born population - West Indies (%)
Place of birth for the foreign-born population - Other Caribbean (%)
Place of birth for the foreign-born population - Belize (%)
Place of birth for the foreign-born population - Costa Rica (%)
Place of birth for the foreign-born population - El Salvador (%)
Place of birth for the foreign-born population - Guatemala (%)
Place of birth for the foreign-born population - Honduras (%)
Place of birth for the foreign-born population - Mexico (%)
Place of birth for the foreign-born population - Nicaragua (%)
Place of birth for the foreign-born population - Panama (%)
Place of birth for the foreign-born population - Other Central America (%)
Place of birth for the foreign-born population - Argentina (%)
Place of birth for the foreign-born population - Bolivia (%)
Place of birth for the foreign-born population - Brazil (%)
Place of birth for the foreign-born population - Chile (%)
Place of birth for the foreign-born population - Colombia (%)
Place of birth for the foreign-born population - Ecuador (%)
Place of birth for the foreign-born population - Guyana (%)
Place of birth for the foreign-born population - Peru (%)
Place of birth for the foreign-born population - Uruguay (%)
Place of birth for the foreign-born population - Venezuela (%)
Place of birth for the foreign-born population - Other South America (%)
Place of birth for the foreign-born population - Canada (%)
Place of birth for the foreign-born population - Other Northern America (%)
Place of birth for the foreign-born population - Other (%)
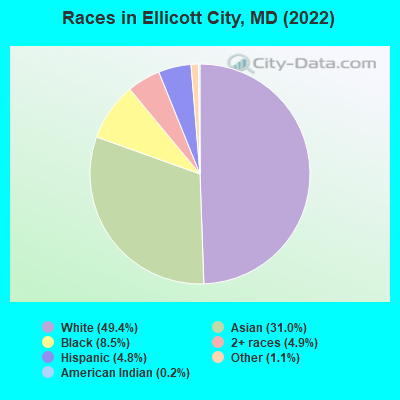
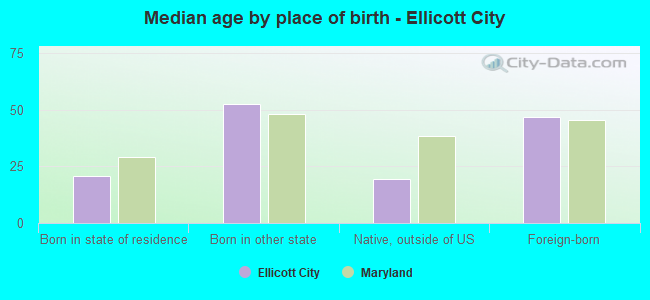
According to 2022 data, the most numerous races in Ellicott City, MD are White alone (36,762 residents), Black alone (6,304 residents), and Hispanic (3,572 residents). 66.3% of Ellicott City residents speak English at home. 28.2% of Ellicott City, MD residents are foreign-born (20.7% born in Asia), which is 43.3% greater than the foreign-born rate of 16.0% across the entire state of Maryland.
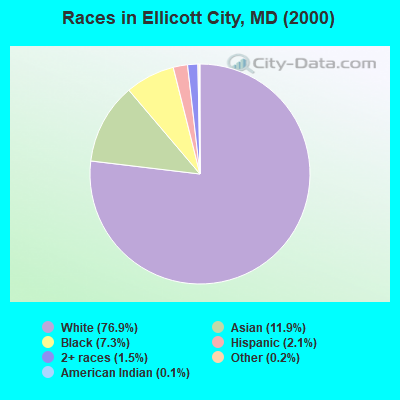
Race distribution in Ellicott City
2000 2022
3,286,547 62.1% White alone 1,464,735 27.7% Black alone 227,916 4.3% Hispanic 209,738 4.0% Asian alone 82,946 1.6% Two or more races 13,312 0.3% American Indian alone 9,379 0.2% Other race alone 1,913 0.04% Native Hawaiian and Other
2,906,492 47.1% White alone 1,800,914 29.2% Black alone 705,842 11.4% Hispanic 401,818 6.5% Asian alone 291,317 4.7% Two or more races 46,930 0.8% Other race alone 8,930 0.1% American Indian alone 2,417 0.04% Native Hawaiian and Other
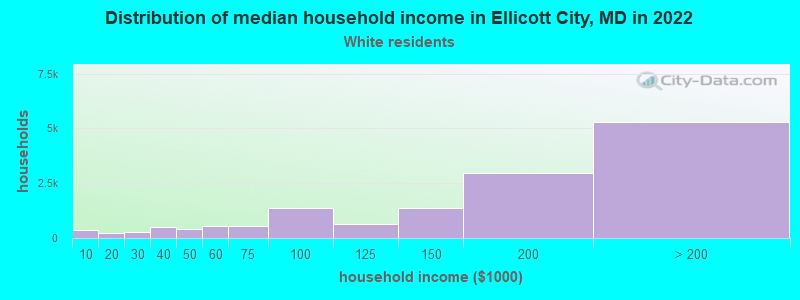
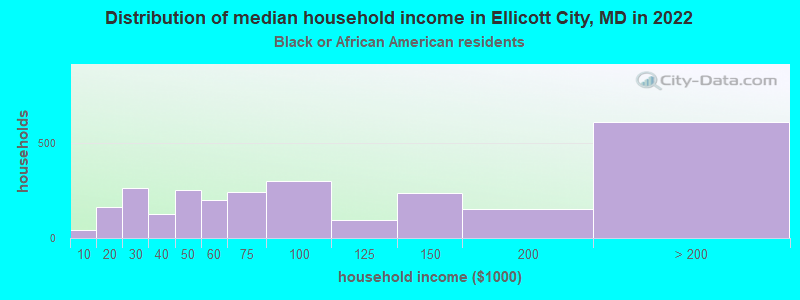
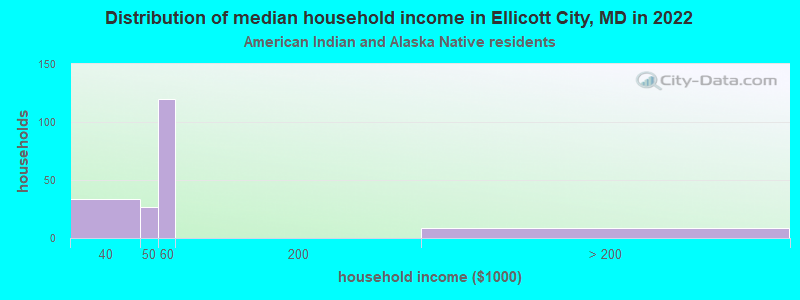
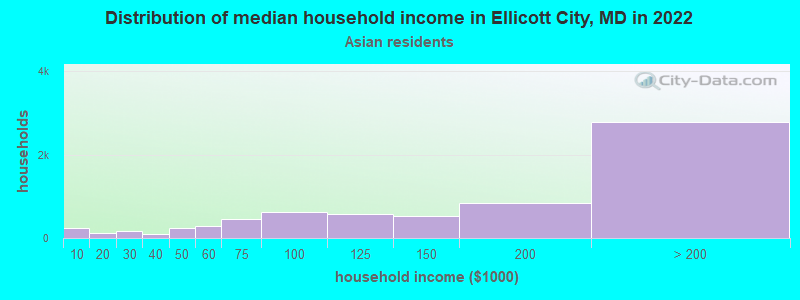
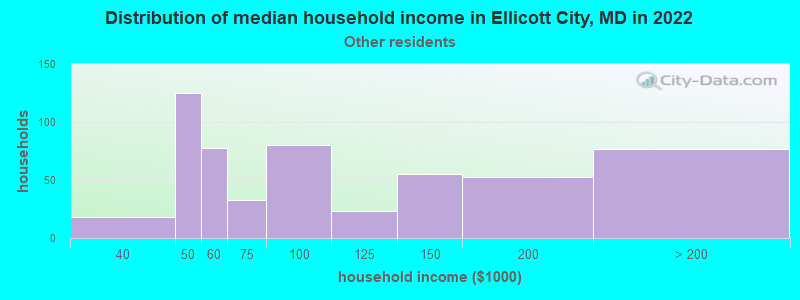
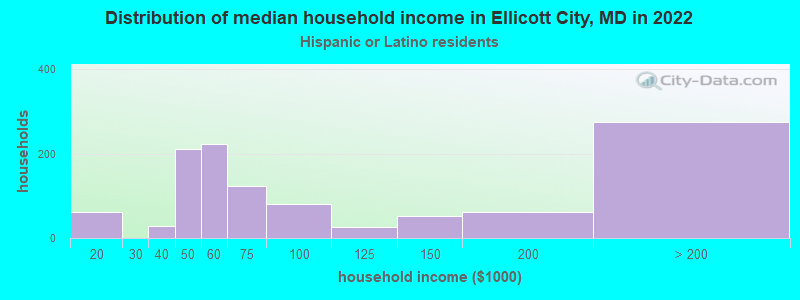
Income and house value in Ellicott City Median household income in 2022 $172,795 White non-Hispanic householders$125,424 Black householders$173,898 Asian householders$66,129 Some other race householders$170,114 Two or more races householdersMedian 2022 house value $637,243 White Non-Hispanic householders$678,176 Black or African American householders$408,543 American Indian or Alaska Native householders $673,423 Asian householders$297,098 Native Hawaiian and other Pacific Islander householders$594,196 Some other race householders$518,667 Two or more races householders$586,802 Hispanic or Latino householders
Median age by race in Ellicott City
50.6 Median age for White residents48.1 52.0 27.6 Median age for Black or African American residents24.2 32.4 -666,666,666.0 Median age for American Indian / Alaska Native residents-666,666,666.0 -666,666,666.0 39.7 Median age for Asian residents37.8 41.2 -666,666,666.0 Median age for Native Hawaiian / Pacific Islander residents-666,666,666.0 -666,666,666.0 23.0 Median age for Other race residents17.6 28.3 22.1 Median age for Two or more races residents17.9 25.4 50.7 Median age for White alone residents48.1 52.3 23.0 Median age for Hispanic or Latino residents23.2 18.2
Owner/renter occupied households by race in Ellicott City
House owners and renters - White residents 11,862 81.4% Owner occupied2,706 18.6% Renter occupiedHouse owners and renters - Black or African American residents 1,346 48.8% Owner occupied1,414 51.2% Renter occupiedHouse owners and renters - American Indian / Alaska Native residents 48 30.4% Owner occupied110 69.6% Renter occupiedHouse owners and renters - Asian residents 5,237 76.0% Owner occupied1,655 24.0% Renter occupiedHouse owners and renters - Native Hawaiian / Pacific Islander residents 8 100.0% Owner occupiedHouse owners and renters - Other race residents 186 25.9% Owner occupied532 74.1% Renter occupiedHouse owners and renters - Two or more races residents 925 67.8% Owner occupied439 32.2% Renter occupiedHouse owners and renters - White alone residents 11,862 81.4% Owner occupied2,706 18.6% Renter occupiedHouse owners and renters - Hispanic or Latino residents 155 18.9% Owner occupied665 81.1% Renter occupied
Language usage in Ellicott City
English speakers - Total 66.3% of residents of Ellicott City speak English at home.
3.2% of residents speak Spanish at home 1,661 72.9% Speak English very well617 27.1% Speak English less than very well30.7% of residents speak other language at home 15,690 72.1% Speak English very well6,080 27.9% Speak English less than very well
English speakers - Born in the United States 87.6% of residents of Ellicott City speak English at home.
2.6% of residents speak Spanish at home 536 91.8% Speak English very well48 8.2% Speak English less than very well10.6% of residents speak other language at home 2,166 89.5% Speak English very well255 10.5% Speak English less than very well
English speakers - Native, born elsewhere 56.2% of residents of Ellicott City speak English at home.
12.2% of residents speak Spanish at home 101 79.5% Speak English very well26 20.5% Speak English less than very well31.5% of residents speak other language at home 159 48.3% Speak English very well170 51.7% Speak English less than very well
English speakers - Foreign-born 15.7% of residents of Ellicott City speak English at home.
4.6% of residents speak Spanish at home 474 49.6% Speak English very well482 50.4% Speak English less than very well79.5% of residents speak other language at home 11,307 68.3% Speak English very well5,238 31.7% Speak English less than very well
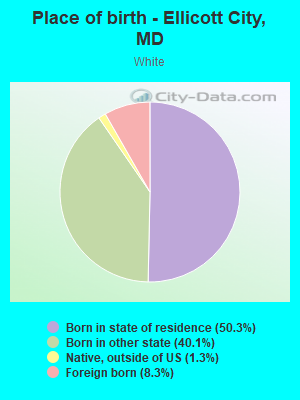
White (Caucasian) - Speak only English Native:
98.0% (31,126)Foreign-born:
27.5% (813)
White (Caucasian) - Speak another language Native:
2.0% (643)Foreign-born:
72.5% (2,144)
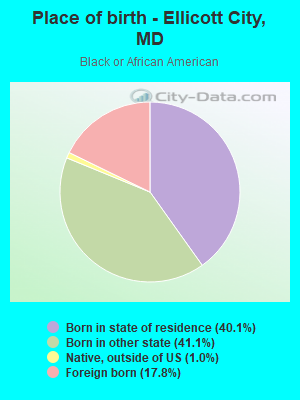
Black or African American - Speak only English Native:
96.2% (4,637)Foreign-born:
40.3% (599)
Black or African American - Speak another language Native:
4.0% (192)Foreign-born:
55.9% (831)
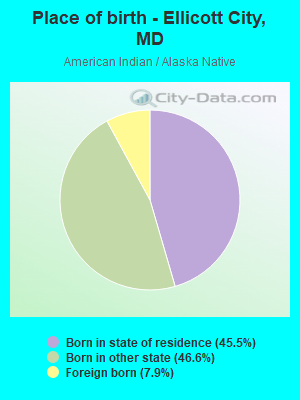
American Indian / Alaska Native - Speak only English Native:
29.7% (57)Foreign-born:
42.1% (10)
Asian - Speak only English Native:
50.7% (4,140)Foreign-born:
11.0% (1,515)
Asian - Speak another language Native:
49.3% (4,026)Foreign-born:
89.0% (12,219)
Native Hawaiian / Pacific Islander - Speak only English Native:
100.0% (11)Foreign-born:
84.6% (6)
Other race - Speak only English Native:
50.6% (500)Foreign-born:
27.6% (232)
Other race - Speak another language Native:
39.2% (388)Foreign-born:
69.0% (578)
Two or more races - Speak only English Native:
69.7% (2,642)Foreign-born:
24.0% (264)
Two or more races - Speak another language Native:
30.9% (1,173)Foreign-born:
75.7% (832)
White alone - Speak only English Native:
98.0% (31,043)Foreign-born:
27.5% (813)
White alone - Speak another language Native:
2.0% (643)Foreign-born:
72.5% (2,144)
Hispanic or Latino - Speak only English Native:
43.7% (882)Foreign-born:
27.7% (319)
Hispanic or Latino - Speak another language Native:
52.7% (1,063)Foreign-born:
77.4% (890)
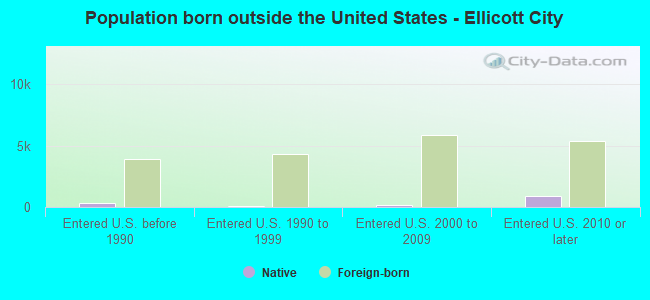
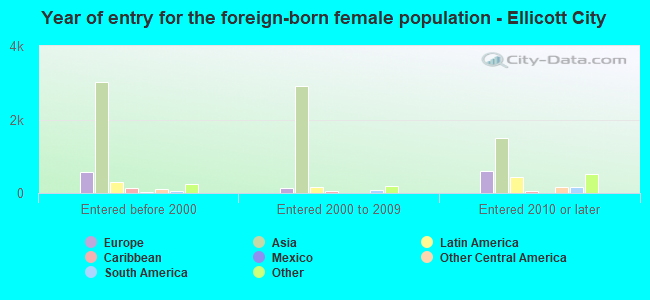
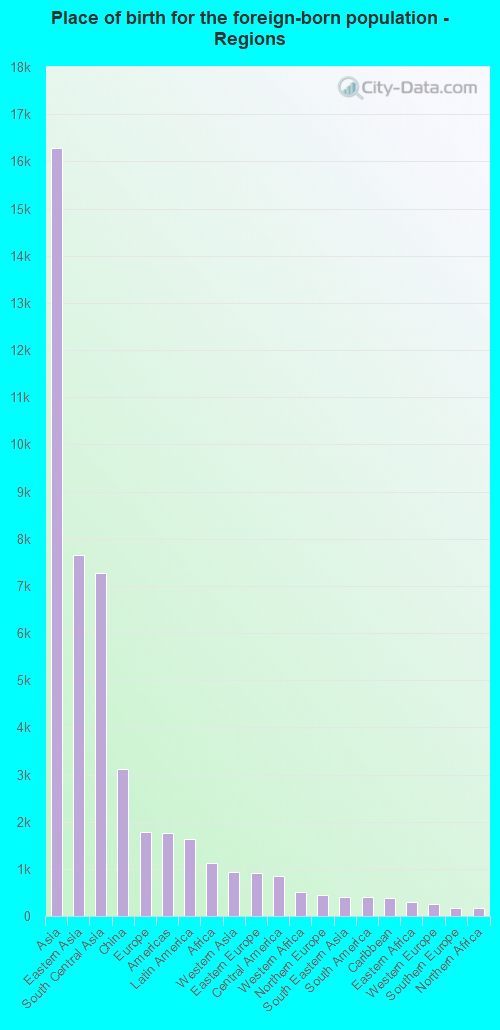
Foreign-born residents in Ellicott City 20,982 residents are foreign born (20.7% Asia ).
This city:
28.2%Maryland:
15.7%
Marital status for residents in Ellicott City Marital status - White (Caucasian) population 15 years and over
Males 18.1% Never married71.4% Now married1.8% Separated1.7% Widowed6.9% DivorcedFemales 18.2% Never married64.3% Now married0.9% Separated7.5% Widowed9.1% DivorcedWomen who gave birth in the past 12 months Now married:
100.0% (195)Unmarried:
0.0% (0)
Women who did not give birth in the past 12 months Now married:
54.4% (3,194)Unmarried:
45.6% (2,677)
Marital status - Black or African American population 15 years and over
Males 46.5% Never married49.6% Now married0.0% Separated0.0% Widowed3.9% DivorcedFemales 33.9% Never married33.3% Now married3.0% Separated6.3% Widowed23.5% DivorcedWomen who gave birth in the past 12 months Now married:
100.0% (12)Unmarried:
0.0% (0)
Women who did not give birth in the past 12 months Now married:
30.3% (459)Unmarried:
69.7% (1,057)
Marital status - American Indian / Alaska Native population 15 years and over
Males 14.9% Never married73.1% Now married0.0% Separated0.0% Widowed11.9% DivorcedFemales 60.0% Never married0.0% Now married0.0% Separated0.0% Widowed40.0% DivorcedWomen who did not give birth in the past 12 months Now married:
0.0% (0)Unmarried:
100.0% (13)
Marital status - Asian population 15 years and over
Males 31.8% Never married63.6% Now married0.7% Separated1.6% Widowed2.4% DivorcedFemales 17.0% Never married63.5% Now married3.4% Separated6.7% Widowed9.5% DivorcedWomen who gave birth in the past 12 months Now married:
100.0% (380)Unmarried:
0.0% (0)
Women who did not give birth in the past 12 months Now married:
66.7% (4,181)Unmarried:
33.3% (2,090)
Marital status - Native Hawaiian / Pacific Islander population 15 years and over
Males 0.0% Never married100.0% Now married0.0% Separated0.0% Widowed0.0% DivorcedFemales 100.0% Never married0.0% Now married0.0% Separated0.0% Widowed0.0% DivorcedMarital status - Other race population 15 years and over
Males 32.7% Never married50.6% Now married15.5% Separated1.2% Widowed0.0% DivorcedFemales 45.3% Never married50.5% Now married0.0% Separated4.2% Widowed0.0% DivorcedWomen who did not give birth in the past 12 months Now married:
43.1% (312)Unmarried:
56.9% (412)
Marital status - Two or more races population 15 years and over
Males 38.9% Never married54.7% Now married0.0% Separated0.7% Widowed5.7% DivorcedFemales 23.8% Never married67.1% Now married0.0% Separated3.5% Widowed5.6% DivorcedWomen who did not give birth in the past 12 months Now married:
73.9% (931)Unmarried:
26.1% (329)
Marital status - White alone, not Hispanic / Latino population 15 years and over
Males 18.1% Never married71.4% Now married1.8% Separated1.7% Widowed6.9% DivorcedFemales 17.7% Never married64.6% Now married1.0% Separated7.6% Widowed9.1% DivorcedWomen who gave birth in the past 12 months Now married:
100.0% (195)Unmarried:
0.0% (0)
Women who did not give birth in the past 12 months Now married:
55.2% (3,194)Unmarried:
44.8% (2,594)
Marital status - Hispanic or Latino population 15 years and over
Males 35.3% Never married52.0% Now married4.8% Separated0.0% Widowed7.9% DivorcedFemales 38.9% Never married52.7% Now married0.0% Separated3.7% Widowed4.7% DivorcedWomen who did not give birth in the past 12 months Now married:
54.1% (481)Unmarried:
45.9% (408)
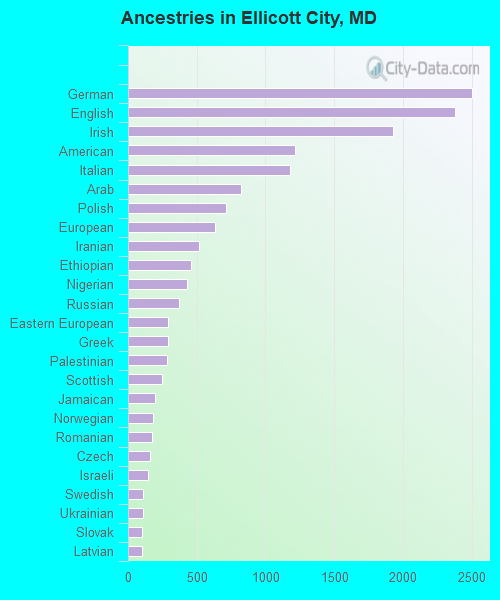
Ancestries in Ellicott City
2,502 6.3% German2,378 5.9% English1,932 4.8% Irish1,217 3.0% American1,178 2.9% Italian825 2.1% Arab712 1.8% Polish632 1.6% European515 1.3% Iranian461 1.2% Ethiopian432 1.1% Nigerian372 0.9% Russian294 0.7% Eastern European289 0.7% Greek284 0.7% Palestinian247 0.6% Scottish199 0.5% Jamaican182 0.5% Norwegian172 0.4% Romanian162 0.4% Czech145 0.4% Israeli109 0.3% Swedish107 0.3% Ukrainian101 0.3% Slovak99 0.2% Latvian96 0.2% Turkish94 0.2% British87 0.2% Scotch-Irish80 0.2% African66 0.2% Finnish63 0.2% Czechoslovakian62 0.2% Hungarian62 0.2% French61 0.2% Haitian59 0.1% Kenyan53 0.1% Cape Verdean52 0.1% Ghanaian51 0.1% Lebanese47 0.1% Swiss46 0.1% Jordanian44 0.1% British West Indian42 0.1% Scandinavian42 0.1% Portuguese38 0.09% French Canadian35 0.09% Austrian32 0.08% Moroccan32 0.08% Dutch29 0.07% Croatian25 0.06% Egyptian23 0.06% Northern European22 0.05% Slavic22 0.05% Lithuanian20 0.05% Trinidadian and Tobagonian17 0.04% Brazilian15 0.04% Welsh15 0.04% Syrian13 0.03% Estonian13 0.03% Sierra Leonean12 0.03% Yugoslavian11 0.03% Serbian10 0.02% Bulgarian9 0.02% South African5 0.01% Australian
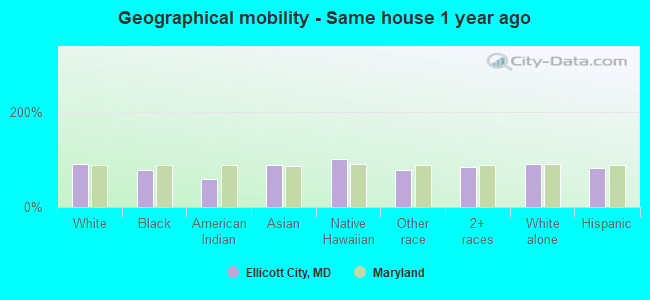
Geographical mobility in Ellicott City Same house 1 year ago 32,150 90.4% White (Caucasian)4,890 77.3% Black or African American174 58.1% American Indian / Alaska Native20,232 89.5% Asian19 100.0% Native Hawaiian / Pacific Islander1,624 78.1% Other race4,650 82.9% Two or more races32,067 90.4% White alone, not Hispanic / Latino2,947 81.6% Hispanic or LatinoMoved within same county 591 1.7% White / Caucasian390 6.2% Black or African American114 38.0% American Indian / Alaska Native900 4.0% Asian145 7.0% Other race220 3.9% Two or more races591 1.7% White alone, not Hispanic / Latino204 5.6% Hispanic or LatinoMoved within same state 921 2.6% White / Caucasian1,194 18.9% Black or African American12 4.0% American Indian / Alaska Native649 2.9% Asian112 5.4% Other race246 4.4% Two or more races921 2.6% White alone, not Hispanic / Latino506 14.0% Hispanic or LatinoMoved from different state 700 2.0% White / Caucasian16 0.2% Black or African American389 1.7% Asian126 6.1% Other race340 6.1% Two or more races700 2.0% White alone, not Hispanic / Latino85 2.4% Hispanic or LatinoMoved from abroad 1,207 3.4% White27 0.4% Black or African American445 2.0% Asian113 2.0% Two or more races1,207 3.4% White alone, not Hispanic / Latino
Children Nativity (place of birth) in Ellicott City
Children under 6 years - Living with two parents Both parents native 1,669 100.0% NativeBoth parents foreign-born 554 100.0% NativeOne native, one foreign-born parent 829 100.0% NativeChildren under 6 years - Living with one parent Foreign-born parent 55 15.4% Native303 84.6% Foreign-bornChildren 6 to 17 years - Living with two parents Both parents native 5,652 100.0% NativeBoth parents foreign-born 3,512 86.5% Native548 13.5% Foreign-bornOne native, one foreign-born parent 1,613 100.0% NativeChildren 6 to 17 years - Living with one parent Native parent 634 100.0% NativeForeign-born parent 2,219 63.1% Native1,298 36.9% Foreign-born
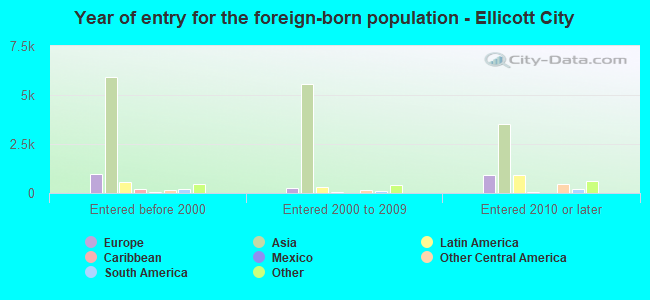
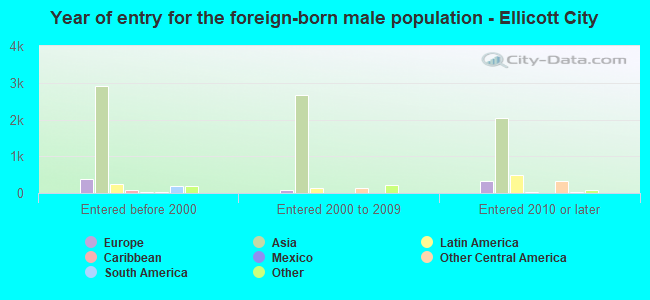
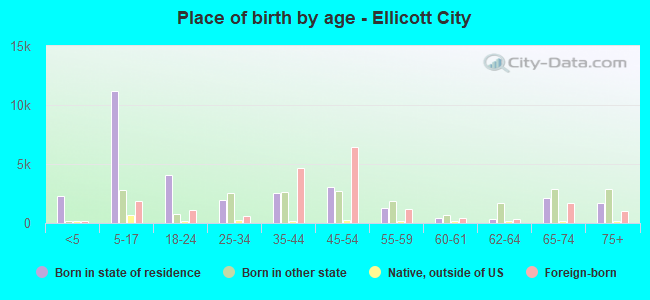
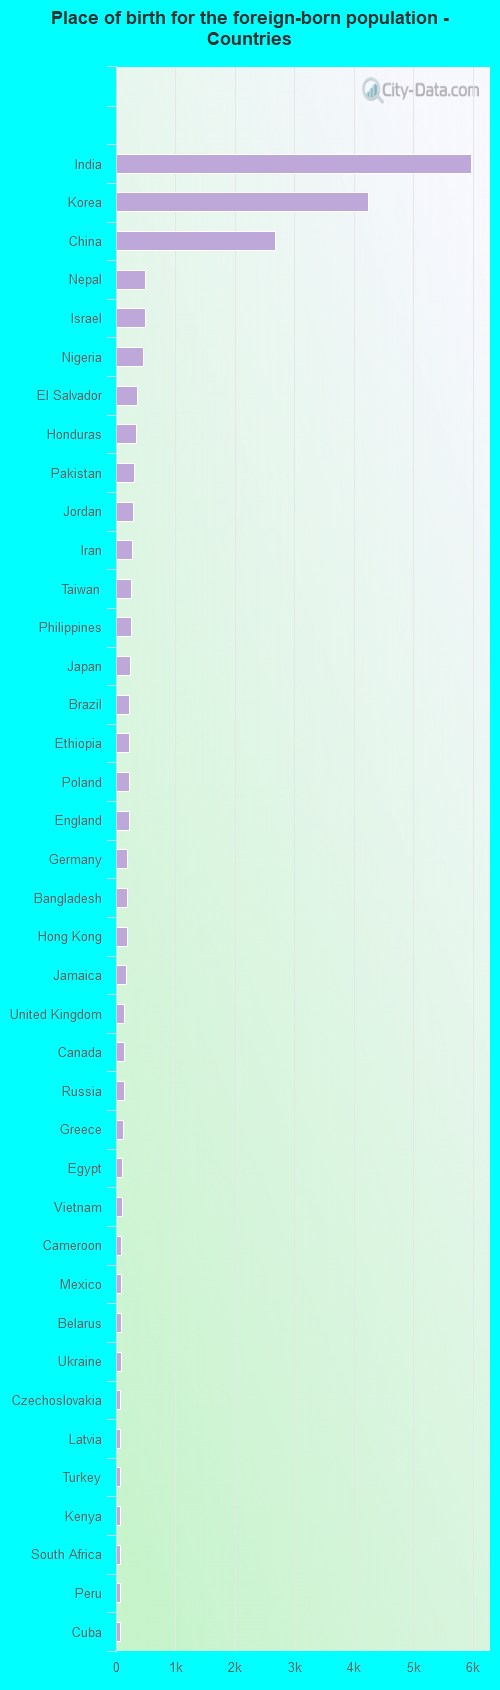
Place of birth for residents in Ellicott City 16,276 Asia7,655 Eastern Asia7,282 South Central Asia3,121 China1,777 Europe1,762 Americas1,631 Latin America1,120 Africa936 Western Asia904 Eastern Europe858 Central America504 Western Africa440 Northern Europe402 South Eastern Asia399 South America373 Caribbean291 Eastern Africa253 Western Europe179 Southern Europe170 Northern Africa131 Northern America91 Middle Africa62 Southern Africa44 Oceania36 Australia and New Zealand Subregion5,975 India4,240 Korea2,678 China496 Nepal495 Israel454 Nigeria352 El Salvador332 Honduras311 Pakistan290 Jordan276 Iran254 Taiwan250 Philippines230 Japan225 Brazil223 Ethiopia213 Poland211 England193 Germany191 Bangladesh187 Hong Kong167 Jamaica135 United Kingdom131 Canada131 Russia119 Greece97 Egypt94 Vietnam91 Cameroon89 Mexico88 Belarus76 Ukraine73 Czechoslovakia71 Latvia68 Turkey67 Kenya62 South Africa59 Peru59 Cuba52 France47 Venezuela45 Dominican Republic40 Italy36 Australia34 Sudan30 Sri Lanka29 Malaysia29 Costa Rica28 Ireland28 Romania28 Trinidad and Tobago26 Nicaragua22 Algeria21 Argentina19 Portugal18 Thailand17 Morocco17 St. Lucia17 Colombia15 Hungary15 Dominica15 Scotland14 Haiti14 Sierra Leone14 Uruguay13 Serbia13 Guatemala12 Moldova12 Panama12 Ecuador12 Lebanon10 Ghana9 Yemen9 Senegal9 Bulgaria9 Sweden8 Singapore8 Austria7 Croatia1 Guyana
Grandparents responsible for own grandchildren in Ellicott City
Grandparents (30 to 59 years) White / Caucasian 11 9.5% Responsible for grandchildren104 90.5% Not responsible for grandchildrenBlack or African American 6 100.0% Not responsible for grandchildrenAsian 26 47.4% Responsible for grandchildren29 52.6% Not responsible for grandchildrenOther race 38 100.0% Responsible for grandchildrenTwo or more races 13 100.0% Responsible for grandchildrenWhite alone, not Hispanic / Latino 11 9.5% Responsible for grandchildren106 90.5% Not responsible for grandchildrenHispanic or Latino 38 82.2% Responsible for grandchildren8 17.8% Not responsible for grandchildrenGrandparents (60 years and over) White / Caucasian 39 10.3% Responsible for grandchildren341 89.7% Not responsible for grandchildrenBlack or African American 8 55.8% Responsible for grandchildren7 44.2% Not responsible for grandchildrenAsian 41 11.2% Responsible for grandchildren323 88.8% Not responsible for grandchildrenTwo or more races 14 100.0% Not responsible for grandchildrenWhite alone, not Hispanic / Latino 39 9.7% Responsible for grandchildren365 90.3% Not responsible for grandchildren