Races in Ellisburg, New Jersey (NJ) Detailed Stats
Data:
Races - White alone (%)
Races - White alone (% change since 2000)
Races - Black alone (%)
Races - Black alone (% change since 2000)
Races - American Indian alone (%)
Races - American Indian alone (% change since 2000)
Races - Asian alone (%)
Races - Asian alone (% change since 2000)
Races - Hispanic (%)
Races - Hispanic (% change since 2000)
Races - Native Hawaiian and Other Pacific Islander alone (%)
Races - Native Hawaiian and Other Pacific Islander alone (% change since 2000)
Races - Two or more races(%)
Races - Two or more races(% change since 2000)
Races - Other race alone (%)
Races - Other race alone (% change since 2000)
Racial diversity
Place of birth - Born in state of residence (%)
Place of birth - Born in state of residence (%) - White
Place of birth - Born in state of residence (%) - Black or African American
Place of birth - Born in state of residence (%) - Asian
Place of birth - Born in state of residence (%) - Hispanic or Latino
Place of birth - Born in state of residence (%) - American Indian and Alaska Native
Place of birth - Born in state of residence (%) - Multirace
Place of birth - Born in state of residence (%) - Other Race
Place of birth - Born in other state (%)
Place of birth - Born in other state (%) - White
Place of birth - Born in other state (%) - Black or African American
Place of birth - Born in other state (%) - Asian
Place of birth - Born in other state (%) - Hispanic or Latino
Place of birth - Born in other state (%) - American Indian and Alaska Native
Place of birth - Born in other state (%) - Multirace
Place of birth - Born in other state (%) - Other Race
Place of birth - Native, outside of US (%)
Place of birth - Native, outside of US (%) - White
Place of birth - Native, outside of US (%) - Black or African American
Place of birth - Native, outside of US (%) - Asian
Place of birth - Native, outside of US (%) - Hispanic or Latino
Place of birth - Native, outside of US (%) - American Indian and Alaska Native
Place of birth - Native, outside of US (%) - Multirace
Place of birth - Native, outside of US (%) - Other Race
Place of birth - Foreign born (%)
Place of birth - Foreign born (%) - White
Place of birth - Foreign born (%) - Black or African American
Place of birth - Foreign born (%) - Asian
Place of birth - Foreign born (%) - Hispanic or Latino
Place of birth - Foreign born (%) - American Indian and Alaska Native
Place of birth - Foreign born (%) - Multirace
Place of birth - Foreign born (%) - Other Race
Residents speaking English at home (%)
Residents speaking English at home - Born in the United States (%)
Residents speaking English at home - Native, born elsewhere (%)
Residents speaking English at home - Foreign born (%)
Residents speaking Spanish at home (%)
Residents speaking Spanish at home - Born in the United States (%)
Residents speaking Spanish at home - Native, born elsewhere (%)
Residents speaking Spanish at home - Foreign born (%)
Residents speaking other language at home (%)
Residents speaking other language at home - Born in the United States (%)
Residents speaking other language at home - Native, born elsewhere (%)
Residents speaking other language at home - Foreign born (%)
Marital status - Never married (%)
Marital status - Now married (%)
Marital status - Separated (%)
Marital status - Widowed (%)
Marital status - Divorced (%)
Ancestries Reported - Arab (%)
Ancestries Reported - Czech (%)
Ancestries Reported - Danish (%)
Ancestries Reported - Dutch (%)
Ancestries Reported - English (%)
Ancestries Reported - French (%)
Ancestries Reported - French Canadian (%)
Ancestries Reported - German (%)
Ancestries Reported - Greek (%)
Ancestries Reported - Hungarian (%)
Ancestries Reported - Irish (%)
Ancestries Reported - Italian (%)
Ancestries Reported - Lithuanian (%)
Ancestries Reported - Norwegian (%)
Ancestries Reported - Polish (%)
Ancestries Reported - Portuguese (%)
Ancestries Reported - Russian (%)
Ancestries Reported - Scotch-Irish (%)
Ancestries Reported - Scottish (%)
Ancestries Reported - Slovak (%)
Ancestries Reported - Subsaharan African (%)
Ancestries Reported - Swedish (%)
Ancestries Reported - Swiss (%)
Ancestries Reported - Ukrainian (%)
Ancestries Reported - United States (%)
Ancestries Reported - Welsh (%)
Ancestries Reported - West Indian (%)
Ancestries Reported - Other (%)
Geographical mobility - Same house 1 year ago (%)
Geographical mobility - Same house 1 year ago (%) - White
Geographical mobility - Same house 1 year ago (%) - Black or African American
Geographical mobility - Same house 1 year ago (%) - Asian
Geographical mobility - Same house 1 year ago (%) - Hispanic or Latino
Geographical mobility - Same house 1 year ago (%) - American Indian and Alaska Native
Geographical mobility - Same house 1 year ago (%) - Multirace
Geographical mobility - Same house 1 year ago (%) - Other Race
Geographical mobility - Moved within same county (%)
Geographical mobility - Moved within same county (%) - White
Geographical mobility - Moved within same county (%) - Black or African American
Geographical mobility - Moved within same county (%) - Asian
Geographical mobility - Moved within same county (%) - Hispanic or Latino
Geographical mobility - Moved within same county (%) - American Indian and Alaska Native
Geographical mobility - Moved within same county (%) - Multirace
Geographical mobility - Moved within same county (%) - Other Race
Geographical mobility - Moved from different county within same state (%)
Geographical mobility - Moved from different county within same state (%) - White
Geographical mobility - Moved from different county within same state (%) - Black or African American
Geographical mobility - Moved from different county within same state (%) - Asian
Geographical mobility - Moved from different county within same state (%) - Hispanic or Latino
Geographical mobility - Moved from different county within same state (%) - American Indian and Alaska Native
Geographical mobility - Moved from different county within same state (%) - Multirace
Geographical mobility - Moved from different county within same state (%) - Other Race
Geographical mobility - Moved from different state (%)
Geographical mobility - Moved from different state (%) - White
Geographical mobility - Moved from different state (%) - Black or African American
Geographical mobility - Moved from different state (%) - Asian
Geographical mobility - Moved from different state (%) - Hispanic or Latino
Geographical mobility - Moved from different state (%) - American Indian and Alaska Native
Geographical mobility - Moved from different state (%) - Multirace
Geographical mobility - Moved from different state (%) - Other Race
Geographical mobility - Moved from abroad (%)
Geographical mobility - Moved from abroad (%) - White
Geographical mobility - Moved from abroad (%) - Black or African American
Geographical mobility - Moved from abroad (%) - Asian
Geographical mobility - Moved from abroad (%) - Hispanic or Latino
Geographical mobility - Moved from abroad (%) - American Indian and Alaska Native
Geographical mobility - Moved from abroad (%) - Multirace
Geographical mobility - Moved from abroad (%) - Other Race
Place of birth for the foreign-born population - Ireland (%)
Place of birth for the foreign-born population - Denmark (%)
Place of birth for the foreign-born population - Norway (%)
Place of birth for the foreign-born population - Sweden (%)
Place of birth for the foreign-born population - United Kingdom (%)
Place of birth for the foreign-born population - England (%)
Place of birth for the foreign-born population - Scotland (%)
Place of birth for the foreign-born population - Other Northern Europe (%)
Place of birth for the foreign-born population - Austria (%)
Place of birth for the foreign-born population - Belgium (%)
Place of birth for the foreign-born population - France (%)
Place of birth for the foreign-born population - Germany (%)
Place of birth for the foreign-born population - Netherlands (%)
Place of birth for the foreign-born population - Switzerland (%)
Place of birth for the foreign-born population - Other Western Europe (%)
Place of birth for the foreign-born population - Greece (%)
Place of birth for the foreign-born population - Italy (%)
Place of birth for the foreign-born population - Portugal (%)
Place of birth for the foreign-born population - Spain (%)
Place of birth for the foreign-born population - Other Southern Europe (%)
Place of birth for the foreign-born population - Albania (%)
Place of birth for the foreign-born population - Belarus (%)
Place of birth for the foreign-born population - Bosnia and Herzegovina (%)
Place of birth for the foreign-born population - Bulgaria (%)
Place of birth for the foreign-born population - Croatia (%)
Place of birth for the foreign-born population - Czechoslovakia (%)
Place of birth for the foreign-born population - Hungary (%)
Place of birth for the foreign-born population - Latvia (%)
Place of birth for the foreign-born population - Lithuania (%)
Place of birth for the foreign-born population - North Macedonia (Macedonia) (%)
Place of birth for the foreign-born population - Moldova (%)
Place of birth for the foreign-born population - Poland (%)
Place of birth for the foreign-born population - Romania (%)
Place of birth for the foreign-born population - Russia (%)
Place of birth for the foreign-born population - Serbia (%)
Place of birth for the foreign-born population - Ukraine (%)
Place of birth for the foreign-born population - Other Eastern Europe (%)
Place of birth for the foreign-born population - China (%)
Place of birth for the foreign-born population - Hong Kong (%)
Place of birth for the foreign-born population - Taiwan (%)
Place of birth for the foreign-born population - Japan (%)
Place of birth for the foreign-born population - Korea (%)
Place of birth for the foreign-born population - Other Eastern Asia (%)
Place of birth for the foreign-born population - Afghanistan (%)
Place of birth for the foreign-born population - Bangladesh (%)
Place of birth for the foreign-born population - India (%)
Place of birth for the foreign-born population - Iran (%)
Place of birth for the foreign-born population - Kazakhstan (%)
Place of birth for the foreign-born population - Nepal (%)
Place of birth for the foreign-born population - Pakistan (%)
Place of birth for the foreign-born population - Sri Lanka (%)
Place of birth for the foreign-born population - Uzbekistan (%)
Place of birth for the foreign-born population - Other South Central Asia (%)
Place of birth for the foreign-born population - Burma (%)
Place of birth for the foreign-born population - Cambodia (%)
Place of birth for the foreign-born population - Indonesia (%)
Place of birth for the foreign-born population - Laos (%)
Place of birth for the foreign-born population - Malaysia (%)
Place of birth for the foreign-born population - Philippines (%)
Place of birth for the foreign-born population - Singapore (%)
Place of birth for the foreign-born population - Thailand (%)
Place of birth for the foreign-born population - Vietnam (%)
Place of birth for the foreign-born population - Other South Eastern Asia (%)
Place of birth for the foreign-born population - Armenia (%)
Place of birth for the foreign-born population - Iraq (%)
Place of birth for the foreign-born population - Israel (%)
Place of birth for the foreign-born population - Jordan (%)
Place of birth for the foreign-born population - Kuwait (%)
Place of birth for the foreign-born population - Lebanon (%)
Place of birth for the foreign-born population - Saudi Arabia (%)
Place of birth for the foreign-born population - Syria (%)
Place of birth for the foreign-born population - Turkey (%)
Place of birth for the foreign-born population - Yemen (%)
Place of birth for the foreign-born population - Other Western Asia (%)
Place of birth for the foreign-born population - Eritrea (%)
Place of birth for the foreign-born population - Ethiopia (%)
Place of birth for the foreign-born population - Kenya (%)
Place of birth for the foreign-born population - Somalia (%)
Place of birth for the foreign-born population - Uganda (%)
Place of birth for the foreign-born population - Zimbabwe (%)
Place of birth for the foreign-born population - Other Eastern Africa (%)
Place of birth for the foreign-born population - Cameroon (%)
Place of birth for the foreign-born population - Congo (%)
Place of birth for the foreign-born population - Democratic Republic of Congo (Zaire) (%)
Place of birth for the foreign-born population - Other Middle Africa (%)
Place of birth for the foreign-born population - Egypt (%)
Place of birth for the foreign-born population - Morocco (%)
Place of birth for the foreign-born population - Sudan (%)
Place of birth for the foreign-born population - Other Northern Africa (%)
Place of birth for the foreign-born population - South Africa (%)
Place of birth for the foreign-born population - Other Southern Africa (%)
Place of birth for the foreign-born population - Cabo Verde (%)
Place of birth for the foreign-born population - Ghana (%)
Place of birth for the foreign-born population - Liberia (%)
Place of birth for the foreign-born population - Nigeria (%)
Place of birth for the foreign-born population - Senegal (%)
Place of birth for the foreign-born population - Sierra Leone (%)
Place of birth for the foreign-born population - Other Western Africa (%)
Place of birth for the foreign-born population - Australia (%)
Place of birth for the foreign-born population - New Zealand (%)
Place of birth for the foreign-born population - Fiji (%)
Place of birth for the foreign-born population - Micronesia (%)
Place of birth for the foreign-born population - Bahamas (%)
Place of birth for the foreign-born population - Barbados (%)
Place of birth for the foreign-born population - Cuba (%)
Place of birth for the foreign-born population - Dominica (%)
Place of birth for the foreign-born population - Dominican Republic (%)
Place of birth for the foreign-born population - Grenada (%)
Place of birth for the foreign-born population - Haiti (%)
Place of birth for the foreign-born population - Jamaica (%)
Place of birth for the foreign-born population - St. Vincent and the Grenadines (%)
Place of birth for the foreign-born population - Trinidad and Tobago (%)
Place of birth for the foreign-born population - West Indies (%)
Place of birth for the foreign-born population - Other Caribbean (%)
Place of birth for the foreign-born population - Belize (%)
Place of birth for the foreign-born population - Costa Rica (%)
Place of birth for the foreign-born population - El Salvador (%)
Place of birth for the foreign-born population - Guatemala (%)
Place of birth for the foreign-born population - Honduras (%)
Place of birth for the foreign-born population - Mexico (%)
Place of birth for the foreign-born population - Nicaragua (%)
Place of birth for the foreign-born population - Panama (%)
Place of birth for the foreign-born population - Other Central America (%)
Place of birth for the foreign-born population - Argentina (%)
Place of birth for the foreign-born population - Bolivia (%)
Place of birth for the foreign-born population - Brazil (%)
Place of birth for the foreign-born population - Chile (%)
Place of birth for the foreign-born population - Colombia (%)
Place of birth for the foreign-born population - Ecuador (%)
Place of birth for the foreign-born population - Guyana (%)
Place of birth for the foreign-born population - Peru (%)
Place of birth for the foreign-born population - Uruguay (%)
Place of birth for the foreign-born population - Venezuela (%)
Place of birth for the foreign-born population - Other South America (%)
Place of birth for the foreign-born population - Canada (%)
Place of birth for the foreign-born population - Other Northern America (%)
Place of birth for the foreign-born population - Other (%)
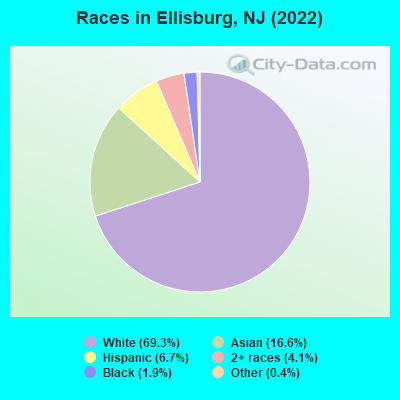
According to 2022 data, the most numerous races in Ellisburg, NJ are White alone (3,811 residents), Hispanic (371 residents), and Black alone (104 residents). 61.4% of Ellisburg residents speak English at home.
Race distribution in Ellisburg 3,811 69.3% White alone 915 16.6% Asian alone 371 6.7% Hispanic 223 4.1% Two or more races 104 1.9% Black alone 20 0.4% Other race alone
2000 2022
5,557,209 66.0% White alone 1,117,191 13.3% Hispanic 1,096,171 13.0% Black alone 477,012 5.7% Asian alone 133,689 1.6% Two or more races 19,565 0.2% Other race alone 11,338 0.1% American Indian alone 2,175 0.03% Native Hawaiian and Other
4,766,476 51.5% White alone 2,028,470 21.9% Hispanic 1,111,632 12.0% Black alone 923,546 10.0% Asian alone 332,237 3.6% Two or more races 89,847 1.0% Other race alone 8,557 0.09% American Indian alone 934 0.01% Native Hawaiian and Other
Income and house value in Ellisburg Median household income in 2022 $86,628 White non-Hispanic householders$108,842 Asian householders$75,295 Hispanic or Latino race householders
Median age by race in Ellisburg
39.6 Median age for White residents36.7 47.7 56.0 Median age for Black or African American residents55.7 31.4 34.1 Median age for American Indian / Alaska Native residents35.3 -688,298,917.7 33.9 Median age for Asian residents32.2 37.0 -701,509,871.5 Median age for Native Hawaiian / Pacific Islander residents-860,335,194.7 -668,881,505.4 40.2 Median age for Other race residents20.5 -660,194,174.1 10.3 Median age for Two or more races residents9.3 79.5 39.3 Median age for White alone residents36.4 46.2 32.7 Median age for Hispanic or Latino residents31.3 39.7
Owner/renter occupied households by race in Ellisburg
House owners and renters - White residents 1,103 72.8% Owner occupied413 27.2% Renter occupiedHouse owners and renters - Black or African American residents 43 41.2% Owner occupied61 58.8% Renter occupiedHouse owners and renters - American Indian / Alaska Native residents 16 100.0% Renter occupiedHouse owners and renters - Asian residents 183 67.3% Owner occupied89 32.7% Renter occupiedHouse owners and renters - Other race residents 17 59.5% Owner occupied11 40.5% Renter occupiedHouse owners and renters - Two or more races residents 25 66.8% Owner occupied12 33.2% Renter occupiedHouse owners and renters - White alone residents 1,080 71.7% Owner occupied427 28.3% Renter occupiedHouse owners and renters - Hispanic or Latino residents 75 63.0% Owner occupied44 37.0% Renter occupied
Language usage in Ellisburg
English speakers - Total 61.4% of residents of Ellisburg speak English at home.
5.4% of residents speak Spanish at home 211 77.9% Speak English very well60 22.1% Speak English less than very well30.0% of residents speak other language at home 579 38.6% Speak English very well921 61.4% Speak English less than very well
English speakers - Born in the United States 88.9% of residents of Ellisburg speak English at home.
4.4% of residents speak Spanish at home 74 98.7% Speak English very well1 1.3% Speak English less than very well6.4% of residents speak other language at home 88 80.0% Speak English very well22 20.0% Speak English less than very well
English speakers - Native, born elsewhere 59.6% of residents of Ellisburg speak English at home.
38.6% of residents speak Spanish at home 19 43.2% Speak English very well25 56.8% Speak English less than very well
English speakers - Foreign-born 8.5% of residents of Ellisburg speak English at home.
6.0% of residents speak Spanish at home 78 75.7% Speak English very well25 24.3% Speak English less than very well74.3% of residents speak other language at home 474 37.1% Speak English very well805 62.9% Speak English less than very well
White (Caucasian) - Speak only English Native:
92.1% (2,470)Foreign-born:
1.3% (8)
White (Caucasian) - Speak another language Native:
7.6% (203)Foreign-born:
99.8% (602)
Black or African American - Speak only English Native:
83.2% (89)Foreign-born:
100.0% (43)
Asian - Speak only English Native:
85.2% (216)Foreign-born:
13.4% (81)
Asian - Speak another language Native:
23.1% (59)Foreign-born:
87.0% (527)
Other race - Speak only English Native:
15.7% (12)Foreign-born:
100.0% (17)
Two or more races - Speak only English Native:
87.6% (129)Foreign-born:
10.6% (10)
Two or more races - Speak another language Native:
14.2% (21)Foreign-born:
83.9% (76)
White alone - Speak only English Native:
91.4% (2,379)Foreign-born:
1.3% (9)
White alone - Speak another language Native:
10.0% (259)Foreign-born:
100.0% (704)
Hispanic or Latino - Speak another language Native:
44.9% (118)Foreign-born:
100.0% (108)
Foreign-born residents in Ellisburg
Marital status for residents in Ellisburg Marital status - White (Caucasian) population 15 years and over
Males 37.1% Never married52.4% Now married0.0% Separated4.4% Widowed6.0% DivorcedFemales 17.4% Never married54.2% Now married0.5% Separated18.2% Widowed9.7% DivorcedWomen who gave birth in the past 12 months Now married:
34.7% (16)Unmarried:
65.3% (30)
Women who did not give birth in the past 12 months Now married:
60.3% (446)Unmarried:
39.7% (293)
Marital status - Black or African American population 15 years and over
Males 4.5% Never married88.1% Now married0.0% Separated4.5% Widowed3.0% DivorcedFemales 41.7% Never married6.7% Now married0.0% Separated20.0% Widowed31.7% DivorcedWomen who did not give birth in the past 12 months Now married:
0.0% (0)Unmarried:
100.0% (19)
Marital status - American Indian / Alaska Native population 15 years and over
Males 100.0% Never married0.0% Now married0.0% Separated0.0% Widowed0.0% DivorcedFemales 100.0% Never married0.0% Now married0.0% Separated0.0% Widowed0.0% DivorcedWomen who did not give birth in the past 12 months Now married:
0.0% (0)Unmarried:
100.0% (14)
Marital status - Asian population 15 years and over
Males 26.9% Never married58.3% Now married5.4% Separated0.6% Widowed8.7% DivorcedFemales 18.8% Never married63.9% Now married0.0% Separated11.5% Widowed5.9% DivorcedWomen who did not give birth in the past 12 months Now married:
74.9% (204)Unmarried:
25.1% (68)
Marital status - Other race population 15 years and over
Males 28.2% Never married71.8% Now married0.0% Separated0.0% Widowed0.0% DivorcedFemales 38.5% Never married61.5% Now married0.0% Separated0.0% Widowed0.0% DivorcedWomen who did not give birth in the past 12 months Now married:
100.0% (18)Unmarried:
0.0% (0)
Marital status - Two or more races population 15 years and over
Males 3.6% Never married96.4% Now married0.0% Separated0.0% Widowed0.0% DivorcedFemales 0.0% Never married78.7% Now married0.0% Separated3.3% Widowed18.0% DivorcedWomen who did not give birth in the past 12 months Now married:
100.0% (21)Unmarried:
0.0% (0)
Marital status - White alone, not Hispanic / Latino population 15 years and over
Males 36.7% Never married53.2% Now married0.0% Separated4.6% Widowed5.4% DivorcedFemales 18.0% Never married53.6% Now married0.5% Separated17.8% Widowed10.1% DivorcedWomen who gave birth in the past 12 months Now married:
34.7% (16)Unmarried:
65.3% (31)
Women who did not give birth in the past 12 months Now married:
59.4% (445)Unmarried:
40.6% (304)
Marital status - Hispanic or Latino population 15 years and over
Males 47.6% Never married42.8% Now married0.0% Separated0.0% Widowed9.7% DivorcedFemales 24.2% Never married59.2% Now married0.0% Separated16.7% Widowed0.0% DivorcedWomen who did not give birth in the past 12 months Now married:
54.0% (35)Unmarried:
46.0% (30)
Ancestries in Ellisburg
600 19.2% Turkish524 16.8% Italian214 6.9% Yugoslavian139 4.5% Syrian136 4.4% Polish102 3.3% Russian61 2.0% Irish59 1.9% English57 1.8% Trinidadian and Tobagonian28 0.9% Eastern European27 0.9% German17 0.5% American14 0.4% Jordanian14 0.4% Austrian14 0.4% Brazilian14 0.4% Ukrainian5 0.2% Israeli
Children Nativity (place of birth) in Ellisburg
Children under 6 years - Living with two parents Both parents native 302 100.0% NativeBoth parents foreign-born 176 100.0% NativeChildren under 6 years - Living with one parent Native parent 33 100.0% NativeChildren 6 to 17 years - Living with two parents Both parents native 192 100.0% NativeBoth parents foreign-born 246 95.6% Native11 4.4% Foreign-bornOne native, one foreign-born parent 109 100.0% NativeChildren 6 to 17 years - Living with one parent Native parent 57 80.3% Native14 19.7% Foreign-bornForeign-born parent 79 68.4% Native37 31.6% Foreign-born
Grandparents responsible for own grandchildren in Ellisburg
Grandparents (30 to 59 years) White / Caucasian 102 100.0% Not responsible for grandchildrenWhite alone, not Hispanic / Latino 98 100.0% Not responsible for grandchildren
Grandparents (60 years and over)