Races in Elm Mott, Texas (TX) Detailed Stats
Ancestries, Foreign-born residents, place of birth
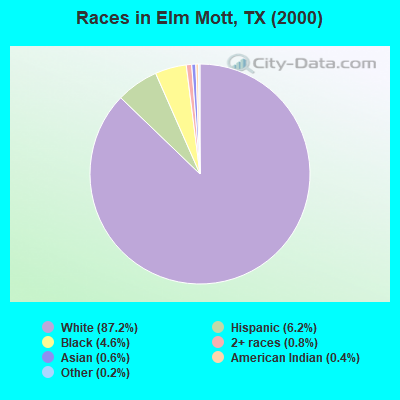
Race distribution in Elm Mott

- 5,24487.2%White alone
- 3706.2%Hispanic
- 2764.6%Black alone
- 480.8%Two or more races
- 350.6%Asian alone
- 250.4%American Indian alone
- 110.2%Other race alone
- 20.03%Native Hawaiian and Other
Pacific Islander alone
2000
2022
-
- 10,933,31352.4%White alone
- 6,669,66632.0%Hispanic
- 2,364,25511.3%Black alone
- 554,4452.7%Asian alone
- 230,5671.1%Two or more races
- 68,8590.3%American Indian alone
- 19,9580.10%Other race alone
- 10,7570.05%Native Hawaiian and Other
Pacific Islander alone

-
- 12,070,64240.2%Hispanic
- 11,683,43038.9%White alone
- 3,508,70611.7%Black alone
- 1,608,1735.4%Asian alone
- 956,5603.2%Two or more races
- 125,7630.4%Other race alone
- 47,0230.2%American Indian alone
- 29,2750.10%Native Hawaiian and Other
Pacific Islander alone

Income and house value in Elm Mott
- Median household income in 2022
- $87,501White non-Hispanic householders
- $56,285Black householders
- $81,513American Indian and Alaska Native householders
- over $200,000Asian householders
- $166,016Some other race householders
- $35,403Two or more races householders
- $108,307Hispanic or Latino race householders
- Median 2022 house value
- $294,210White Non-Hispanic householders
- $302,646Black or African American householders
- $61,513American Indian or Alaska Native householders
- $659,073Asian householders
- $310,379Some other race householders
- $43,938Two or more races householders
- $298,780Hispanic or Latino householders
Household income for White non-Hispanic householders

Household income for Black householders

Household income for American Indian and Alaska Native householders

Household income for Asian householders

Household income for Two or more races householders

Household income for Hispanic or Latino race householders

Zip code: 76640