Races in Elmira, New York (NY) Detailed Stats
Data:
Races - White alone (%)
Races - White alone (% change since 2000)
Races - Black alone (%)
Races - Black alone (% change since 2000)
Races - American Indian alone (%)
Races - American Indian alone (% change since 2000)
Races - Asian alone (%)
Races - Asian alone (% change since 2000)
Races - Hispanic (%)
Races - Hispanic (% change since 2000)
Races - Native Hawaiian and Other Pacific Islander alone (%)
Races - Native Hawaiian and Other Pacific Islander alone (% change since 2000)
Races - Two or more races(%)
Races - Two or more races(% change since 2000)
Races - Other race alone (%)
Races - Other race alone (% change since 2000)
Racial diversity
Place of birth - Born in state of residence (%)
Place of birth - Born in state of residence (%) - White
Place of birth - Born in state of residence (%) - Black or African American
Place of birth - Born in state of residence (%) - Asian
Place of birth - Born in state of residence (%) - Hispanic or Latino
Place of birth - Born in state of residence (%) - American Indian and Alaska Native
Place of birth - Born in state of residence (%) - Multirace
Place of birth - Born in state of residence (%) - Other Race
Place of birth - Born in other state (%)
Place of birth - Born in other state (%) - White
Place of birth - Born in other state (%) - Black or African American
Place of birth - Born in other state (%) - Asian
Place of birth - Born in other state (%) - Hispanic or Latino
Place of birth - Born in other state (%) - American Indian and Alaska Native
Place of birth - Born in other state (%) - Multirace
Place of birth - Born in other state (%) - Other Race
Place of birth - Native, outside of US (%)
Place of birth - Native, outside of US (%) - White
Place of birth - Native, outside of US (%) - Black or African American
Place of birth - Native, outside of US (%) - Asian
Place of birth - Native, outside of US (%) - Hispanic or Latino
Place of birth - Native, outside of US (%) - American Indian and Alaska Native
Place of birth - Native, outside of US (%) - Multirace
Place of birth - Native, outside of US (%) - Other Race
Place of birth - Foreign born (%)
Place of birth - Foreign born (%) - White
Place of birth - Foreign born (%) - Black or African American
Place of birth - Foreign born (%) - Asian
Place of birth - Foreign born (%) - Hispanic or Latino
Place of birth - Foreign born (%) - American Indian and Alaska Native
Place of birth - Foreign born (%) - Multirace
Place of birth - Foreign born (%) - Other Race
Residents speaking English at home (%)
Residents speaking English at home - Born in the United States (%)
Residents speaking English at home - Native, born elsewhere (%)
Residents speaking English at home - Foreign born (%)
Residents speaking Spanish at home (%)
Residents speaking Spanish at home - Born in the United States (%)
Residents speaking Spanish at home - Native, born elsewhere (%)
Residents speaking Spanish at home - Foreign born (%)
Residents speaking other language at home (%)
Residents speaking other language at home - Born in the United States (%)
Residents speaking other language at home - Native, born elsewhere (%)
Residents speaking other language at home - Foreign born (%)
Marital status - Never married (%)
Marital status - Now married (%)
Marital status - Separated (%)
Marital status - Widowed (%)
Marital status - Divorced (%)
Ancestries Reported - Arab (%)
Ancestries Reported - Czech (%)
Ancestries Reported - Danish (%)
Ancestries Reported - Dutch (%)
Ancestries Reported - English (%)
Ancestries Reported - French (%)
Ancestries Reported - French Canadian (%)
Ancestries Reported - German (%)
Ancestries Reported - Greek (%)
Ancestries Reported - Hungarian (%)
Ancestries Reported - Irish (%)
Ancestries Reported - Italian (%)
Ancestries Reported - Lithuanian (%)
Ancestries Reported - Norwegian (%)
Ancestries Reported - Polish (%)
Ancestries Reported - Portuguese (%)
Ancestries Reported - Russian (%)
Ancestries Reported - Scotch-Irish (%)
Ancestries Reported - Scottish (%)
Ancestries Reported - Slovak (%)
Ancestries Reported - Subsaharan African (%)
Ancestries Reported - Swedish (%)
Ancestries Reported - Swiss (%)
Ancestries Reported - Ukrainian (%)
Ancestries Reported - United States (%)
Ancestries Reported - Welsh (%)
Ancestries Reported - West Indian (%)
Ancestries Reported - Other (%)
Geographical mobility - Same house 1 year ago (%)
Geographical mobility - Same house 1 year ago (%) - White
Geographical mobility - Same house 1 year ago (%) - Black or African American
Geographical mobility - Same house 1 year ago (%) - Asian
Geographical mobility - Same house 1 year ago (%) - Hispanic or Latino
Geographical mobility - Same house 1 year ago (%) - American Indian and Alaska Native
Geographical mobility - Same house 1 year ago (%) - Multirace
Geographical mobility - Same house 1 year ago (%) - Other Race
Geographical mobility - Moved within same county (%)
Geographical mobility - Moved within same county (%) - White
Geographical mobility - Moved within same county (%) - Black or African American
Geographical mobility - Moved within same county (%) - Asian
Geographical mobility - Moved within same county (%) - Hispanic or Latino
Geographical mobility - Moved within same county (%) - American Indian and Alaska Native
Geographical mobility - Moved within same county (%) - Multirace
Geographical mobility - Moved within same county (%) - Other Race
Geographical mobility - Moved from different county within same state (%)
Geographical mobility - Moved from different county within same state (%) - White
Geographical mobility - Moved from different county within same state (%) - Black or African American
Geographical mobility - Moved from different county within same state (%) - Asian
Geographical mobility - Moved from different county within same state (%) - Hispanic or Latino
Geographical mobility - Moved from different county within same state (%) - American Indian and Alaska Native
Geographical mobility - Moved from different county within same state (%) - Multirace
Geographical mobility - Moved from different county within same state (%) - Other Race
Geographical mobility - Moved from different state (%)
Geographical mobility - Moved from different state (%) - White
Geographical mobility - Moved from different state (%) - Black or African American
Geographical mobility - Moved from different state (%) - Asian
Geographical mobility - Moved from different state (%) - Hispanic or Latino
Geographical mobility - Moved from different state (%) - American Indian and Alaska Native
Geographical mobility - Moved from different state (%) - Multirace
Geographical mobility - Moved from different state (%) - Other Race
Geographical mobility - Moved from abroad (%)
Geographical mobility - Moved from abroad (%) - White
Geographical mobility - Moved from abroad (%) - Black or African American
Geographical mobility - Moved from abroad (%) - Asian
Geographical mobility - Moved from abroad (%) - Hispanic or Latino
Geographical mobility - Moved from abroad (%) - American Indian and Alaska Native
Geographical mobility - Moved from abroad (%) - Multirace
Geographical mobility - Moved from abroad (%) - Other Race
Place of birth for the foreign-born population - Ireland (%)
Place of birth for the foreign-born population - Denmark (%)
Place of birth for the foreign-born population - Norway (%)
Place of birth for the foreign-born population - Sweden (%)
Place of birth for the foreign-born population - United Kingdom (%)
Place of birth for the foreign-born population - England (%)
Place of birth for the foreign-born population - Scotland (%)
Place of birth for the foreign-born population - Other Northern Europe (%)
Place of birth for the foreign-born population - Austria (%)
Place of birth for the foreign-born population - Belgium (%)
Place of birth for the foreign-born population - France (%)
Place of birth for the foreign-born population - Germany (%)
Place of birth for the foreign-born population - Netherlands (%)
Place of birth for the foreign-born population - Switzerland (%)
Place of birth for the foreign-born population - Other Western Europe (%)
Place of birth for the foreign-born population - Greece (%)
Place of birth for the foreign-born population - Italy (%)
Place of birth for the foreign-born population - Portugal (%)
Place of birth for the foreign-born population - Spain (%)
Place of birth for the foreign-born population - Other Southern Europe (%)
Place of birth for the foreign-born population - Albania (%)
Place of birth for the foreign-born population - Belarus (%)
Place of birth for the foreign-born population - Bosnia and Herzegovina (%)
Place of birth for the foreign-born population - Bulgaria (%)
Place of birth for the foreign-born population - Croatia (%)
Place of birth for the foreign-born population - Czechoslovakia (%)
Place of birth for the foreign-born population - Hungary (%)
Place of birth for the foreign-born population - Latvia (%)
Place of birth for the foreign-born population - Lithuania (%)
Place of birth for the foreign-born population - North Macedonia (Macedonia) (%)
Place of birth for the foreign-born population - Moldova (%)
Place of birth for the foreign-born population - Poland (%)
Place of birth for the foreign-born population - Romania (%)
Place of birth for the foreign-born population - Russia (%)
Place of birth for the foreign-born population - Serbia (%)
Place of birth for the foreign-born population - Ukraine (%)
Place of birth for the foreign-born population - Other Eastern Europe (%)
Place of birth for the foreign-born population - China (%)
Place of birth for the foreign-born population - Hong Kong (%)
Place of birth for the foreign-born population - Taiwan (%)
Place of birth for the foreign-born population - Japan (%)
Place of birth for the foreign-born population - Korea (%)
Place of birth for the foreign-born population - Other Eastern Asia (%)
Place of birth for the foreign-born population - Afghanistan (%)
Place of birth for the foreign-born population - Bangladesh (%)
Place of birth for the foreign-born population - India (%)
Place of birth for the foreign-born population - Iran (%)
Place of birth for the foreign-born population - Kazakhstan (%)
Place of birth for the foreign-born population - Nepal (%)
Place of birth for the foreign-born population - Pakistan (%)
Place of birth for the foreign-born population - Sri Lanka (%)
Place of birth for the foreign-born population - Uzbekistan (%)
Place of birth for the foreign-born population - Other South Central Asia (%)
Place of birth for the foreign-born population - Burma (%)
Place of birth for the foreign-born population - Cambodia (%)
Place of birth for the foreign-born population - Indonesia (%)
Place of birth for the foreign-born population - Laos (%)
Place of birth for the foreign-born population - Malaysia (%)
Place of birth for the foreign-born population - Philippines (%)
Place of birth for the foreign-born population - Singapore (%)
Place of birth for the foreign-born population - Thailand (%)
Place of birth for the foreign-born population - Vietnam (%)
Place of birth for the foreign-born population - Other South Eastern Asia (%)
Place of birth for the foreign-born population - Armenia (%)
Place of birth for the foreign-born population - Iraq (%)
Place of birth for the foreign-born population - Israel (%)
Place of birth for the foreign-born population - Jordan (%)
Place of birth for the foreign-born population - Kuwait (%)
Place of birth for the foreign-born population - Lebanon (%)
Place of birth for the foreign-born population - Saudi Arabia (%)
Place of birth for the foreign-born population - Syria (%)
Place of birth for the foreign-born population - Turkey (%)
Place of birth for the foreign-born population - Yemen (%)
Place of birth for the foreign-born population - Other Western Asia (%)
Place of birth for the foreign-born population - Eritrea (%)
Place of birth for the foreign-born population - Ethiopia (%)
Place of birth for the foreign-born population - Kenya (%)
Place of birth for the foreign-born population - Somalia (%)
Place of birth for the foreign-born population - Uganda (%)
Place of birth for the foreign-born population - Zimbabwe (%)
Place of birth for the foreign-born population - Other Eastern Africa (%)
Place of birth for the foreign-born population - Cameroon (%)
Place of birth for the foreign-born population - Congo (%)
Place of birth for the foreign-born population - Democratic Republic of Congo (Zaire) (%)
Place of birth for the foreign-born population - Other Middle Africa (%)
Place of birth for the foreign-born population - Egypt (%)
Place of birth for the foreign-born population - Morocco (%)
Place of birth for the foreign-born population - Sudan (%)
Place of birth for the foreign-born population - Other Northern Africa (%)
Place of birth for the foreign-born population - South Africa (%)
Place of birth for the foreign-born population - Other Southern Africa (%)
Place of birth for the foreign-born population - Cabo Verde (%)
Place of birth for the foreign-born population - Ghana (%)
Place of birth for the foreign-born population - Liberia (%)
Place of birth for the foreign-born population - Nigeria (%)
Place of birth for the foreign-born population - Senegal (%)
Place of birth for the foreign-born population - Sierra Leone (%)
Place of birth for the foreign-born population - Other Western Africa (%)
Place of birth for the foreign-born population - Australia (%)
Place of birth for the foreign-born population - New Zealand (%)
Place of birth for the foreign-born population - Fiji (%)
Place of birth for the foreign-born population - Micronesia (%)
Place of birth for the foreign-born population - Bahamas (%)
Place of birth for the foreign-born population - Barbados (%)
Place of birth for the foreign-born population - Cuba (%)
Place of birth for the foreign-born population - Dominica (%)
Place of birth for the foreign-born population - Dominican Republic (%)
Place of birth for the foreign-born population - Grenada (%)
Place of birth for the foreign-born population - Haiti (%)
Place of birth for the foreign-born population - Jamaica (%)
Place of birth for the foreign-born population - St. Vincent and the Grenadines (%)
Place of birth for the foreign-born population - Trinidad and Tobago (%)
Place of birth for the foreign-born population - West Indies (%)
Place of birth for the foreign-born population - Other Caribbean (%)
Place of birth for the foreign-born population - Belize (%)
Place of birth for the foreign-born population - Costa Rica (%)
Place of birth for the foreign-born population - El Salvador (%)
Place of birth for the foreign-born population - Guatemala (%)
Place of birth for the foreign-born population - Honduras (%)
Place of birth for the foreign-born population - Mexico (%)
Place of birth for the foreign-born population - Nicaragua (%)
Place of birth for the foreign-born population - Panama (%)
Place of birth for the foreign-born population - Other Central America (%)
Place of birth for the foreign-born population - Argentina (%)
Place of birth for the foreign-born population - Bolivia (%)
Place of birth for the foreign-born population - Brazil (%)
Place of birth for the foreign-born population - Chile (%)
Place of birth for the foreign-born population - Colombia (%)
Place of birth for the foreign-born population - Ecuador (%)
Place of birth for the foreign-born population - Guyana (%)
Place of birth for the foreign-born population - Peru (%)
Place of birth for the foreign-born population - Uruguay (%)
Place of birth for the foreign-born population - Venezuela (%)
Place of birth for the foreign-born population - Other South America (%)
Place of birth for the foreign-born population - Canada (%)
Place of birth for the foreign-born population - Other Northern America (%)
Place of birth for the foreign-born population - Other (%)
Latest news about races in Elmira, NY collected exclusively by city-data.com from local newspapers, TV, and radio stations
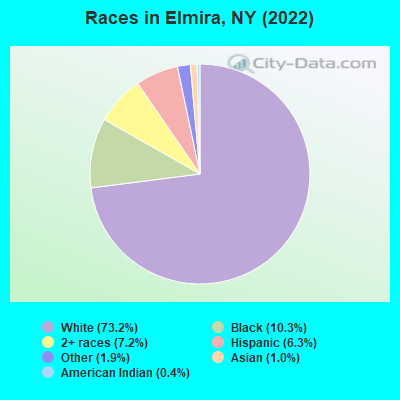
According to 2022 data, the most numerous races in Elmira, NY are White alone (18,887 residents), Hispanic (1,618 residents), and Black alone (2,663 residents). 94.1% of Elmira residents speak English at home. 2.6% of Elmira, NY residents are foreign-born (1.2% born in Latin America, 0.7% born in Asia, 0.5% born in Europe), which is 759.0% less than the foreign-born rate of 22.0% across the entire state of New York.
Race distribution in Elmira
2000 2022
11,760,981 62.0% White alone 2,867,583 15.1% Hispanic 2,812,623 14.8% Black alone 1,035,926 5.5% Asian alone 366,116 1.9% Two or more races 75,499 0.4% Other race alone 52,499 0.3% American Indian alone 5,230 0.03% Native Hawaiian and Other
10,408,933 52.9% White alone 3,867,299 19.7% Hispanic 2,633,840 13.4% Black alone 1,776,286 9.0% Asian alone 732,670 3.7% Two or more races 216,110 1.1% Other race alone 35,082 0.2% American Indian alone 6,931 0.04% Native Hawaiian and Other
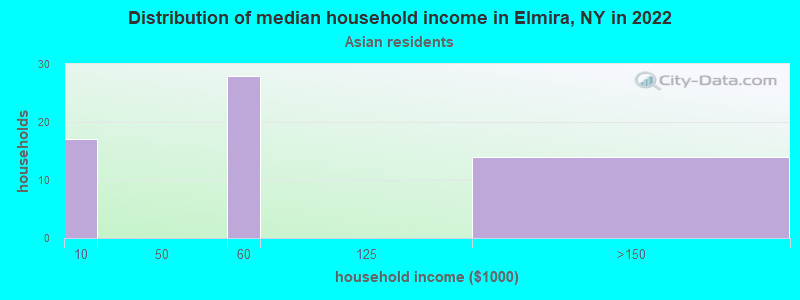
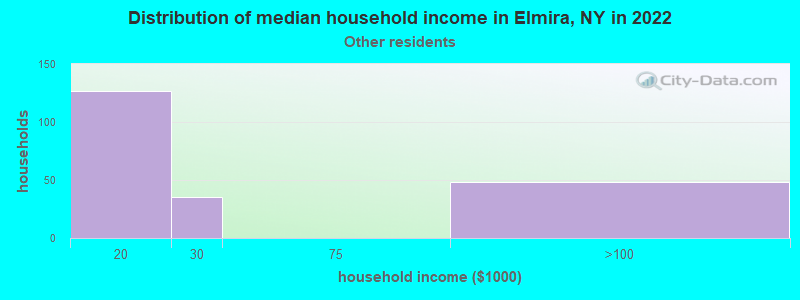
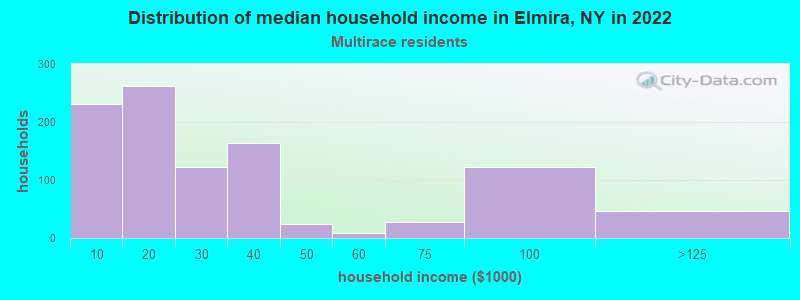
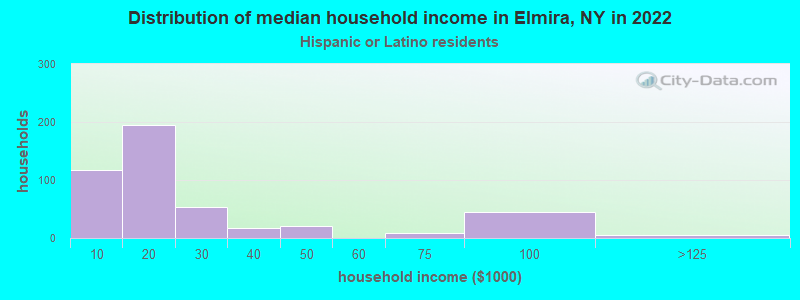
Income and house value in Elmira Median household income in 2022 $40,175 White non-Hispanic householders$74,790 Black householders$70,989 Asian householders$16,696 Some other race householders$24,800 Two or more races householders$12,226 Hispanic or Latino race householdersMedian 2022 house value $86,604 White Non-Hispanic householders$84,775 Black or African American householders$54,023 American Indian or Alaska Native householders $74,802 Asian householders$74,802 Two or more races householders$65,659 Hispanic or Latino householders
Median age by race in Elmira
39.4 Median age for White residents38.3 40.6 32.8 Median age for Black or African American residents24.8 51.7 5.6 Median age for American Indian / Alaska Native residents6.7 5.0 25.5 Median age for Asian residents38.3 20.4 -666,666,666.0 Median age for Native Hawaiian / Pacific Islander residents-666,666,666.0 -666,666,666.0 22.0 Median age for Other race residents12.1 48.9 29.0 Median age for Two or more races residents33.4 24.9 39.8 Median age for White alone residents38.5 40.7 29.0 Median age for Hispanic or Latino residents14.1 38.4
Owner/renter occupied households by race in Elmira
House owners and renters - White residents 4,626 54.1% Owner occupied3,930 45.9% Renter occupiedHouse owners and renters - Black or African American residents 267 58.7% Owner occupied187 41.3% Renter occupiedHouse owners and renters - American Indian / Alaska Native residents 12 100.0% Renter occupiedHouse owners and renters - Asian residents 34 42.8% Owner occupied45 57.2% Renter occupiedHouse owners and renters - Other race residents 69 30.1% Owner occupied161 69.9% Renter occupiedHouse owners and renters - Two or more races residents 208 32.9% Owner occupied425 67.1% Renter occupiedHouse owners and renters - White alone residents 4,583 53.8% Owner occupied3,929 46.2% Renter occupiedHouse owners and renters - Hispanic or Latino residents 88 17.1% Owner occupied428 82.9% Renter occupied
Language usage in Elmira
English speakers - Total 94.1% of residents of Elmira speak English at home.
5.2% of residents speak Spanish at home 894 69.8% Speak English very well387 30.2% Speak English less than very well1.7% of residents speak other language at home 218 52.4% Speak English very well198 47.6% Speak English less than very well
English speakers - Born in the United States 98.9% of residents of Elmira speak English at home.
0.3% of residents speak Spanish at home 14 100.0% Speak English very well0.9% of residents speak other language at home 14 32.6% Speak English very well29 67.4% Speak English less than very well
English speakers - Native, born elsewhere 11.5% of residents of Elmira speak English at home.
124.7% of residents speak Spanish at home 301 86.5% Speak English very well47 13.5% Speak English less than very well3.2% of residents speak other language at home 9 100.0% Speak English very well
English speakers - Foreign-born 32.7% of residents of Elmira speak English at home.
28.3% of residents speak Spanish at home 120 57.4% Speak English very well89 42.6% Speak English less than very well26.7% of residents speak other language at home 115 58.4% Speak English very well82 41.6% Speak English less than very well
White (Caucasian) - Speak only English Native:
98.8% (18,064)Foreign-born:
48.1% (64)
White (Caucasian) - Speak another language Native:
1.2% (221)Foreign-born:
78.6% (104)
Black or African American - Speak only English Native:
100.0% (2,496)Foreign-born:
89.9% (129)
Black or African American - Speak another language Native:
0.1% (3)Foreign-born:
8.1% (12)
Asian - Speak only English Native:
85.4% (74)Foreign-born:
38.1% (71)
Asian - Speak another language Native:
28.7% (25)Foreign-born:
64.4% (119)
Other race - Speak another language Native:
49.6% (311)Foreign-born:
99.8% (78)
Two or more races - Speak only English Native:
84.4% (1,884)Foreign-born:
6.1% (6)
Two or more races - Speak another language Native:
19.5% (435)Foreign-born:
90.2% (89)
White alone - Speak only English Native:
98.9% (17,906)Foreign-born:
55.2% (64)
White alone - Speak another language Native:
1.1% (191)Foreign-born:
38.5% (44)
Hispanic or Latino - Speak only English Native:
31.4% (283)Foreign-born:
1.8% (6)
Hispanic or Latino - Speak another language Native:
77.4% (696)Foreign-born:
100.0% (339)
Foreign-born residents in Elmira 661 residents are foreign born (1.2% Latin America , 0.7% Asia , 0.5% Europe ).
This city:
2.6%New York:
22.6%
Marital status for residents in Elmira Marital status - White (Caucasian) population 15 years and over
Males 43.5% Never married40.0% Now married1.7% Separated2.6% Widowed12.2% DivorcedFemales 35.9% Never married35.2% Now married2.1% Separated10.3% Widowed16.4% DivorcedWomen who gave birth in the past 12 months Now married:
77.5% (128)Unmarried:
22.5% (37)
Women who did not give birth in the past 12 months Now married:
36.1% (1,564)Unmarried:
63.9% (2,762)
Marital status - Black or African American population 15 years and over
Males 73.1% Never married18.9% Now married3.2% Separated0.0% Widowed4.7% DivorcedFemales 52.7% Never married17.3% Now married2.1% Separated12.6% Widowed15.3% DivorcedWomen who gave birth in the past 12 months Now married:
0.0% (0)Unmarried:
100.0% (18)
Women who did not give birth in the past 12 months Now married:
17.1% (42)Unmarried:
82.9% (203)
Marital status - American Indian / Alaska Native population 15 years and over
Males 30.9% Never married60.0% Now married9.1% Separated0.0% Widowed0.0% DivorcedFemales 0.0% Never married0.0% Now married33.3% Separated0.0% Widowed66.7% DivorcedMarital status - Asian population 15 years and over
Males 48.5% Never married45.5% Now married0.0% Separated0.0% Widowed5.9% DivorcedFemales 62.3% Never married27.4% Now married0.0% Separated10.4% Widowed0.0% DivorcedWomen who did not give birth in the past 12 months Now married:
0.0% (0)Unmarried:
100.0% (66)
Marital status - Other race population 15 years and over
Males 61.7% Never married32.3% Now married0.0% Separated0.0% Widowed6.0% DivorcedFemales 79.3% Never married16.0% Now married0.0% Separated0.0% Widowed4.7% DivorcedWomen who did not give birth in the past 12 months Now married:
17.5% (38)Unmarried:
82.5% (177)
Marital status - Two or more races population 15 years and over
Males 62.8% Never married24.8% Now married2.5% Separated0.0% Widowed9.9% DivorcedFemales 67.8% Never married16.5% Now married5.3% Separated1.5% Widowed8.9% DivorcedWomen who gave birth in the past 12 months Now married:
27.4% (49)Unmarried:
72.6% (129)
Women who did not give birth in the past 12 months Now married:
9.4% (67)Unmarried:
90.6% (651)
Marital status - White alone, not Hispanic / Latino population 15 years and over
Males 42.7% Never married40.5% Now married1.7% Separated2.6% Widowed12.4% DivorcedFemales 35.4% Never married35.7% Now married2.0% Separated10.3% Widowed16.6% DivorcedWomen who gave birth in the past 12 months Now married:
77.5% (130)Unmarried:
22.5% (38)
Women who did not give birth in the past 12 months Now married:
36.7% (1,582)Unmarried:
63.3% (2,724)
Marital status - Hispanic or Latino population 15 years and over
Males 70.0% Never married16.2% Now married2.2% Separated0.0% Widowed11.6% DivorcedFemales 73.9% Never married4.0% Now married12.0% Separated5.1% Widowed4.9% DivorcedWomen who gave birth in the past 12 months Now married:
100.0% (36)Unmarried:
0.0% (0)
Women who did not give birth in the past 12 months Now married:
5.6% (18)Unmarried:
94.4% (295)
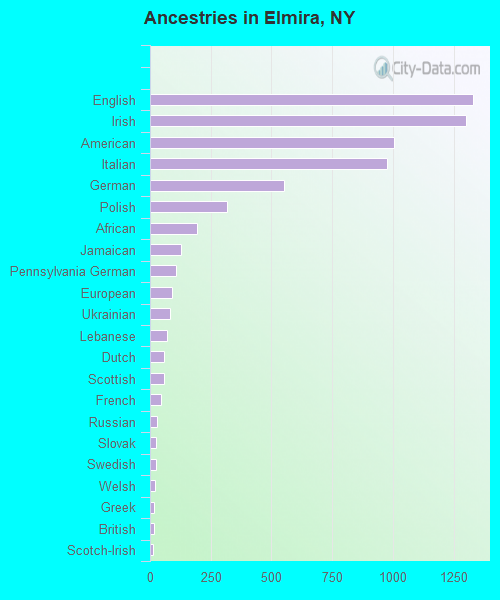
Ancestries in Elmira
1,329 14.2% English1,300 13.9% Irish1,006 10.7% American976 10.4% Italian550 5.9% German319 3.4% Polish195 2.1% African127 1.4% Jamaican107 1.1% Pennsylvania German89 1.0% European83 0.9% Ukrainian69 0.7% Lebanese59 0.6% Dutch56 0.6% Scottish44 0.5% French27 0.3% Russian24 0.3% Slovak24 0.3% Swedish21 0.2% Welsh17 0.2% Greek16 0.2% British14 0.1% Scotch-Irish11 0.1% Albanian10 0.1% Norwegian8 0.09% French Canadian7 0.07% Austrian5 0.05% British West Indian3 0.03% Trinidadian and Tobagonian
Geographical mobility in Elmira Same house 1 year ago 16,570 86.9% White (Caucasian)2,452 91.5% Black or African American255 100.0% American Indian / Alaska Native119 56.5% Asian418 59.6% Other race2,343 86.2% Two or more races16,277 86.7% White alone, not Hispanic / Latino804 50.0% Hispanic or LatinoMoved within same county 1,207 6.3% White / Caucasian49 1.8% Black or African American40 19.2% Asian73 10.4% Other race126 4.6% Two or more races1,199 6.4% White alone, not Hispanic / Latino217 13.5% Hispanic or LatinoMoved within same state 755 4.0% White / Caucasian137 5.1% Black or African American24 11.2% Asian24 3.4% Other race73 2.7% Two or more races740 3.9% White alone, not Hispanic / Latino95 5.9% Hispanic or LatinoMoved from different state 435 2.3% White / Caucasian19 0.7% Black or African American25 11.9% Asian66 2.4% Two or more races445 2.4% White alone, not Hispanic / Latino33 2.1% Hispanic or LatinoMoved from abroad 54 0.3% White18 0.7% Black or African American8 3.7% Asian244 34.8% Other race63 2.3% Two or more races60 0.3% White alone, not Hispanic / Latino221 13.7% Hispanic or Latino
Children Nativity (place of birth) in Elmira
Children under 6 years - Living with two parents Both parents native 561 100.0% NativeOne native, one foreign-born parent 42 100.0% NativeChildren under 6 years - Living with one parent Native parent 871 100.0% NativeForeign-born parent 9 100.0% NativeChildren 6 to 17 years - Living with two parents Both parents native 1,715 98.9% Native20 1.1% Foreign-bornOne native, one foreign-born parent 35 100.0% NativeChildren 6 to 17 years - Living with one parent Native parent 2,020 100.0% NativeForeign-born parent 28 50.4% Native28 49.6% Foreign-born
Grandparents responsible for own grandchildren in Elmira
Grandparents (30 to 59 years) White / Caucasian 165 90.1% Responsible for grandchildren18 9.9% Not responsible for grandchildrenBlack or African American 8 100.0% Responsible for grandchildrenTwo or more races 13 100.0% Not responsible for grandchildrenWhite alone, not Hispanic / Latino 176 89.1% Responsible for grandchildren21 10.9% Not responsible for grandchildrenHispanic or Latino 9 100.0% Not responsible for grandchildrenGrandparents (60 years and over) White / Caucasian 29 25.4% Responsible for grandchildren85 74.6% Not responsible for grandchildrenBlack or African American 42 100.0% Not responsible for grandchildrenTwo or more races 26 100.0% Not responsible for grandchildrenWhite alone, not Hispanic / Latino 31 25.6% Responsible for grandchildren91 74.4% Not responsible for grandchildren