Races in Elmore, Vermont (VT) Detailed Stats
Ancestries, Foreign-born residents, place of birth
3.8% of Elmore, VT residents are foreign-born (1.4% born in North America, 1.2% born in Europe, 0.5% born in Asia, 0.5% born in Africa), which is 6.1% less than the foreign-born rate of 4.0% across the entire state of Vermont.
Race distribution in Elmore

- 83398.1%White alone
- 91.1%Two or more races
- 40.5%Hispanic
- 20.2%Asian alone
- 10.1%American Indian alone

2000
2022
-
- 585,43196.2%White alone
- 6,8091.1%Two or more races
- 5,5040.9%Hispanic
- 5,1600.8%Asian alone
- 2,9210.5%Black alone
- 2,3250.4%American Indian alone
- 5570.09%Other race alone
- 1200.02%Native Hawaiian and Other
Pacific Islander alone

-
- 583,54690.2%White alone
- 27,3404.2%Two or more races
- 14,7702.3%Hispanic
- 11,5121.8%Asian alone
- 6,2641.0%Black alone
- 2,5210.4%Other race alone
- 1,0520.2%American Indian alone
- 590.01%Native Hawaiian and Other
Pacific Islander alone

Income and house value in Elmore
- Median household income in 2022
- $80,863White non-Hispanic householders
- over $200,000Some other race householders
- over $200,000Two or more races householders
- $161,114Hispanic or Latino race householders
- Median 2022 house value
- $312,591White Non-Hispanic householders
- $496,282Two or more races householders
Household income for White non-Hispanic householders

Household income for Two or more races householders

Household income for Hispanic or Latino race householders

Foreign-born residents in Elmore
32 residents are foreign born (1.4% North America, 1.2% Europe, 0.5% Asia, 0.5% Africa).
| This city: | 3.8% |
| Vermont: | 3.8% |
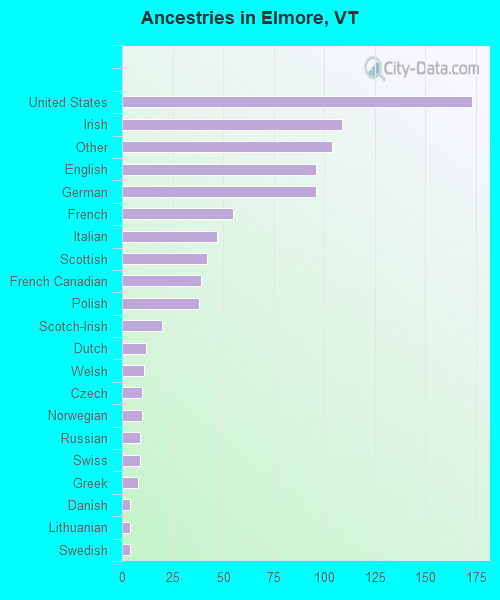
Ancestries in Elmore

- 17319.2%United States
- 10912.1%Irish
- 10411.6%Other
- 9610.7%English
- 9610.7%German
- 556.1%French
- 475.2%Italian
- 424.7%Scottish
- 394.3%French Canadian
- 384.2%Polish
- 202.2%Scotch-Irish
- 121.3%Dutch
- 111.2%Welsh
- 101.1%Czech
- 101.1%Norwegian
- 91.0%Russian
- 91.0%Swiss
- 80.9%Greek
- 40.4%Danish
- 40.4%Lithuanian
- 40.4%Swedish
Zip codes: 05680.