Races in Enfield, Maine (ME) Detailed Stats
Ancestries, Foreign-born residents, place of birth

Recent posts about races in Enfield, Maine on our local forum with over 2,400,000 registered users:
 | 3bd 1ba 840sq ft in West Enfield (0 replies) |
| Well, here goes. The start to our trek North to Maine, our new home-state. (395 replies) |
| Does Maine appeal to any young people these days? (108 replies) |
| Moo-ving Truck, which way to go... (42 replies) |
| Congratulations Submariner (20 replies) |
| Passing Through Springfield (14 replies) |
3.1% of Enfield, ME residents are foreign-born (2.5% born in North America), which is 3.0% greater than the foreign-born rate of 3.0% across the entire state of Maine.
Race distribution in Enfield

- 1,59198.5%White alone
- 150.9%Two or more races
- 60.4%Hispanic
- 30.2%American Indian alone
- 10.06%Black alone

2000
2022
-
- 1,230,29796.5%White alone
- 11,7310.9%Two or more races
- 9,3600.7%Hispanic
- 9,0140.7%Asian alone
- 6,4400.5%Black alone
- 6,9110.5%American Indian alone
- 8360.07%Other race alone
- 3340.03%Native Hawaiian and Other
Pacific Islander alone

-
- 1,249,23390.2%White alone
- 58,3574.2%Two or more races
- 28,7172.1%Hispanic
- 21,5831.6%Black alone
- 16,1511.2%Asian alone
- 5,8730.4%Other race alone
- 5,2050.4%American Indian alone
- 2210.02%Native Hawaiian and Other
Pacific Islander alone

Income and house value in Enfield
- Median household income in 2022
- $64,897White non-Hispanic householders
- $171,505Black householders
- $30,441Two or more races householders
- Median 2022 house value
- $202,961White Non-Hispanic householders
- $292,732Two or more races householders
Household income for White non-Hispanic householders

Household income for Black householders

Household income for Two or more races householders

Foreign-born residents in Enfield
50 residents are foreign born (2.5% North America).
| This city: | 3.1% |
| Maine: | 2.9% |
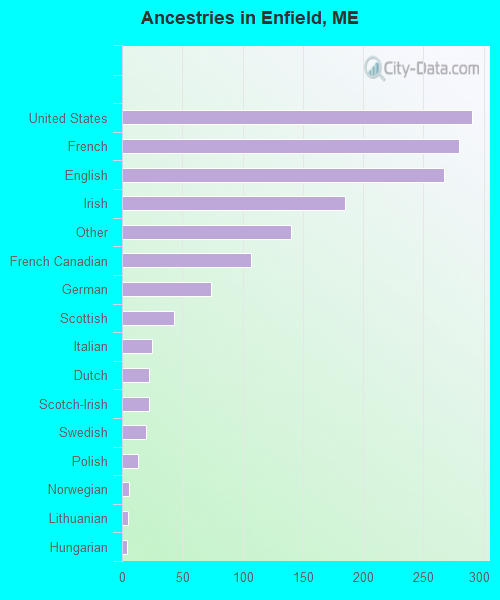
Ancestries in Enfield

- 29019.2%United States
- 28018.5%French
- 26717.6%English
- 18512.2%Irish
- 1409.2%Other
- 1077.1%French Canadian
- 744.9%German
- 432.8%Scottish
- 251.7%Italian
- 221.5%Dutch
- 221.5%Scotch-Irish
- 201.3%Swedish
- 130.9%Polish
- 60.4%Norwegian
- 50.3%Lithuanian
- 40.3%Hungarian
- 20.1%Arab
- 20.1%Czech
- 20.1%Russian
- 20.1%Subsaharan African
- 20.1%Welsh
- 10.07%Portuguese
Zip codes: 04493.