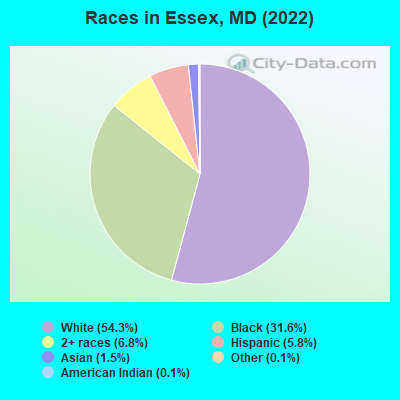
Races in Essex, Maryland (MD) Detailed Stats
Data:
Races - White alone (%)
Races - White alone (% change since 2000)
Races - Black alone (%)
Races - Black alone (% change since 2000)
Races - American Indian alone (%)
Races - American Indian alone (% change since 2000)
Races - Asian alone (%)
Races - Asian alone (% change since 2000)
Races - Hispanic (%)
Races - Hispanic (% change since 2000)
Races - Native Hawaiian and Other Pacific Islander alone (%)
Races - Native Hawaiian and Other Pacific Islander alone (% change since 2000)
Races - Two or more races(%)
Races - Two or more races(% change since 2000)
Races - Other race alone (%)
Races - Other race alone (% change since 2000)
Racial diversity
Place of birth - Born in state of residence (%)
Place of birth - Born in state of residence (%) - White
Place of birth - Born in state of residence (%) - Black or African American
Place of birth - Born in state of residence (%) - Asian
Place of birth - Born in state of residence (%) - Hispanic or Latino
Place of birth - Born in state of residence (%) - American Indian and Alaska Native
Place of birth - Born in state of residence (%) - Multirace
Place of birth - Born in state of residence (%) - Other Race
Place of birth - Born in other state (%)
Place of birth - Born in other state (%) - White
Place of birth - Born in other state (%) - Black or African American
Place of birth - Born in other state (%) - Asian
Place of birth - Born in other state (%) - Hispanic or Latino
Place of birth - Born in other state (%) - American Indian and Alaska Native
Place of birth - Born in other state (%) - Multirace
Place of birth - Born in other state (%) - Other Race
Place of birth - Native, outside of US (%)
Place of birth - Native, outside of US (%) - White
Place of birth - Native, outside of US (%) - Black or African American
Place of birth - Native, outside of US (%) - Asian
Place of birth - Native, outside of US (%) - Hispanic or Latino
Place of birth - Native, outside of US (%) - American Indian and Alaska Native
Place of birth - Native, outside of US (%) - Multirace
Place of birth - Native, outside of US (%) - Other Race
Place of birth - Foreign born (%)
Place of birth - Foreign born (%) - White
Place of birth - Foreign born (%) - Black or African American
Place of birth - Foreign born (%) - Asian
Place of birth - Foreign born (%) - Hispanic or Latino
Place of birth - Foreign born (%) - American Indian and Alaska Native
Place of birth - Foreign born (%) - Multirace
Place of birth - Foreign born (%) - Other Race
Residents speaking English at home (%)
Residents speaking English at home - Born in the United States (%)
Residents speaking English at home - Native, born elsewhere (%)
Residents speaking English at home - Foreign born (%)
Residents speaking Spanish at home (%)
Residents speaking Spanish at home - Born in the United States (%)
Residents speaking Spanish at home - Native, born elsewhere (%)
Residents speaking Spanish at home - Foreign born (%)
Residents speaking other language at home (%)
Residents speaking other language at home - Born in the United States (%)
Residents speaking other language at home - Native, born elsewhere (%)
Residents speaking other language at home - Foreign born (%)
Marital status - Never married (%)
Marital status - Now married (%)
Marital status - Separated (%)
Marital status - Widowed (%)
Marital status - Divorced (%)
Ancestries Reported - Arab (%)
Ancestries Reported - Czech (%)
Ancestries Reported - Danish (%)
Ancestries Reported - Dutch (%)
Ancestries Reported - English (%)
Ancestries Reported - French (%)
Ancestries Reported - French Canadian (%)
Ancestries Reported - German (%)
Ancestries Reported - Greek (%)
Ancestries Reported - Hungarian (%)
Ancestries Reported - Irish (%)
Ancestries Reported - Italian (%)
Ancestries Reported - Lithuanian (%)
Ancestries Reported - Norwegian (%)
Ancestries Reported - Polish (%)
Ancestries Reported - Portuguese (%)
Ancestries Reported - Russian (%)
Ancestries Reported - Scotch-Irish (%)
Ancestries Reported - Scottish (%)
Ancestries Reported - Slovak (%)
Ancestries Reported - Subsaharan African (%)
Ancestries Reported - Swedish (%)
Ancestries Reported - Swiss (%)
Ancestries Reported - Ukrainian (%)
Ancestries Reported - United States (%)
Ancestries Reported - Welsh (%)
Ancestries Reported - West Indian (%)
Ancestries Reported - Other (%)
Geographical mobility - Same house 1 year ago (%)
Geographical mobility - Same house 1 year ago (%) - White
Geographical mobility - Same house 1 year ago (%) - Black or African American
Geographical mobility - Same house 1 year ago (%) - Asian
Geographical mobility - Same house 1 year ago (%) - Hispanic or Latino
Geographical mobility - Same house 1 year ago (%) - American Indian and Alaska Native
Geographical mobility - Same house 1 year ago (%) - Multirace
Geographical mobility - Same house 1 year ago (%) - Other Race
Geographical mobility - Moved within same county (%)
Geographical mobility - Moved within same county (%) - White
Geographical mobility - Moved within same county (%) - Black or African American
Geographical mobility - Moved within same county (%) - Asian
Geographical mobility - Moved within same county (%) - Hispanic or Latino
Geographical mobility - Moved within same county (%) - American Indian and Alaska Native
Geographical mobility - Moved within same county (%) - Multirace
Geographical mobility - Moved within same county (%) - Other Race
Geographical mobility - Moved from different county within same state (%)
Geographical mobility - Moved from different county within same state (%) - White
Geographical mobility - Moved from different county within same state (%) - Black or African American
Geographical mobility - Moved from different county within same state (%) - Asian
Geographical mobility - Moved from different county within same state (%) - Hispanic or Latino
Geographical mobility - Moved from different county within same state (%) - American Indian and Alaska Native
Geographical mobility - Moved from different county within same state (%) - Multirace
Geographical mobility - Moved from different county within same state (%) - Other Race
Geographical mobility - Moved from different state (%)
Geographical mobility - Moved from different state (%) - White
Geographical mobility - Moved from different state (%) - Black or African American
Geographical mobility - Moved from different state (%) - Asian
Geographical mobility - Moved from different state (%) - Hispanic or Latino
Geographical mobility - Moved from different state (%) - American Indian and Alaska Native
Geographical mobility - Moved from different state (%) - Multirace
Geographical mobility - Moved from different state (%) - Other Race
Geographical mobility - Moved from abroad (%)
Geographical mobility - Moved from abroad (%) - White
Geographical mobility - Moved from abroad (%) - Black or African American
Geographical mobility - Moved from abroad (%) - Asian
Geographical mobility - Moved from abroad (%) - Hispanic or Latino
Geographical mobility - Moved from abroad (%) - American Indian and Alaska Native
Geographical mobility - Moved from abroad (%) - Multirace
Geographical mobility - Moved from abroad (%) - Other Race
Place of birth for the foreign-born population - Ireland (%)
Place of birth for the foreign-born population - Denmark (%)
Place of birth for the foreign-born population - Norway (%)
Place of birth for the foreign-born population - Sweden (%)
Place of birth for the foreign-born population - United Kingdom (%)
Place of birth for the foreign-born population - England (%)
Place of birth for the foreign-born population - Scotland (%)
Place of birth for the foreign-born population - Other Northern Europe (%)
Place of birth for the foreign-born population - Austria (%)
Place of birth for the foreign-born population - Belgium (%)
Place of birth for the foreign-born population - France (%)
Place of birth for the foreign-born population - Germany (%)
Place of birth for the foreign-born population - Netherlands (%)
Place of birth for the foreign-born population - Switzerland (%)
Place of birth for the foreign-born population - Other Western Europe (%)
Place of birth for the foreign-born population - Greece (%)
Place of birth for the foreign-born population - Italy (%)
Place of birth for the foreign-born population - Portugal (%)
Place of birth for the foreign-born population - Spain (%)
Place of birth for the foreign-born population - Other Southern Europe (%)
Place of birth for the foreign-born population - Albania (%)
Place of birth for the foreign-born population - Belarus (%)
Place of birth for the foreign-born population - Bosnia and Herzegovina (%)
Place of birth for the foreign-born population - Bulgaria (%)
Place of birth for the foreign-born population - Croatia (%)
Place of birth for the foreign-born population - Czechoslovakia (%)
Place of birth for the foreign-born population - Hungary (%)
Place of birth for the foreign-born population - Latvia (%)
Place of birth for the foreign-born population - Lithuania (%)
Place of birth for the foreign-born population - North Macedonia (Macedonia) (%)
Place of birth for the foreign-born population - Moldova (%)
Place of birth for the foreign-born population - Poland (%)
Place of birth for the foreign-born population - Romania (%)
Place of birth for the foreign-born population - Russia (%)
Place of birth for the foreign-born population - Serbia (%)
Place of birth for the foreign-born population - Ukraine (%)
Place of birth for the foreign-born population - Other Eastern Europe (%)
Place of birth for the foreign-born population - China (%)
Place of birth for the foreign-born population - Hong Kong (%)
Place of birth for the foreign-born population - Taiwan (%)
Place of birth for the foreign-born population - Japan (%)
Place of birth for the foreign-born population - Korea (%)
Place of birth for the foreign-born population - Other Eastern Asia (%)
Place of birth for the foreign-born population - Afghanistan (%)
Place of birth for the foreign-born population - Bangladesh (%)
Place of birth for the foreign-born population - India (%)
Place of birth for the foreign-born population - Iran (%)
Place of birth for the foreign-born population - Kazakhstan (%)
Place of birth for the foreign-born population - Nepal (%)
Place of birth for the foreign-born population - Pakistan (%)
Place of birth for the foreign-born population - Sri Lanka (%)
Place of birth for the foreign-born population - Uzbekistan (%)
Place of birth for the foreign-born population - Other South Central Asia (%)
Place of birth for the foreign-born population - Burma (%)
Place of birth for the foreign-born population - Cambodia (%)
Place of birth for the foreign-born population - Indonesia (%)
Place of birth for the foreign-born population - Laos (%)
Place of birth for the foreign-born population - Malaysia (%)
Place of birth for the foreign-born population - Philippines (%)
Place of birth for the foreign-born population - Singapore (%)
Place of birth for the foreign-born population - Thailand (%)
Place of birth for the foreign-born population - Vietnam (%)
Place of birth for the foreign-born population - Other South Eastern Asia (%)
Place of birth for the foreign-born population - Armenia (%)
Place of birth for the foreign-born population - Iraq (%)
Place of birth for the foreign-born population - Israel (%)
Place of birth for the foreign-born population - Jordan (%)
Place of birth for the foreign-born population - Kuwait (%)
Place of birth for the foreign-born population - Lebanon (%)
Place of birth for the foreign-born population - Saudi Arabia (%)
Place of birth for the foreign-born population - Syria (%)
Place of birth for the foreign-born population - Turkey (%)
Place of birth for the foreign-born population - Yemen (%)
Place of birth for the foreign-born population - Other Western Asia (%)
Place of birth for the foreign-born population - Eritrea (%)
Place of birth for the foreign-born population - Ethiopia (%)
Place of birth for the foreign-born population - Kenya (%)
Place of birth for the foreign-born population - Somalia (%)
Place of birth for the foreign-born population - Uganda (%)
Place of birth for the foreign-born population - Zimbabwe (%)
Place of birth for the foreign-born population - Other Eastern Africa (%)
Place of birth for the foreign-born population - Cameroon (%)
Place of birth for the foreign-born population - Congo (%)
Place of birth for the foreign-born population - Democratic Republic of Congo (Zaire) (%)
Place of birth for the foreign-born population - Other Middle Africa (%)
Place of birth for the foreign-born population - Egypt (%)
Place of birth for the foreign-born population - Morocco (%)
Place of birth for the foreign-born population - Sudan (%)
Place of birth for the foreign-born population - Other Northern Africa (%)
Place of birth for the foreign-born population - South Africa (%)
Place of birth for the foreign-born population - Other Southern Africa (%)
Place of birth for the foreign-born population - Cabo Verde (%)
Place of birth for the foreign-born population - Ghana (%)
Place of birth for the foreign-born population - Liberia (%)
Place of birth for the foreign-born population - Nigeria (%)
Place of birth for the foreign-born population - Senegal (%)
Place of birth for the foreign-born population - Sierra Leone (%)
Place of birth for the foreign-born population - Other Western Africa (%)
Place of birth for the foreign-born population - Australia (%)
Place of birth for the foreign-born population - New Zealand (%)
Place of birth for the foreign-born population - Fiji (%)
Place of birth for the foreign-born population - Micronesia (%)
Place of birth for the foreign-born population - Bahamas (%)
Place of birth for the foreign-born population - Barbados (%)
Place of birth for the foreign-born population - Cuba (%)
Place of birth for the foreign-born population - Dominica (%)
Place of birth for the foreign-born population - Dominican Republic (%)
Place of birth for the foreign-born population - Grenada (%)
Place of birth for the foreign-born population - Haiti (%)
Place of birth for the foreign-born population - Jamaica (%)
Place of birth for the foreign-born population - St. Vincent and the Grenadines (%)
Place of birth for the foreign-born population - Trinidad and Tobago (%)
Place of birth for the foreign-born population - West Indies (%)
Place of birth for the foreign-born population - Other Caribbean (%)
Place of birth for the foreign-born population - Belize (%)
Place of birth for the foreign-born population - Costa Rica (%)
Place of birth for the foreign-born population - El Salvador (%)
Place of birth for the foreign-born population - Guatemala (%)
Place of birth for the foreign-born population - Honduras (%)
Place of birth for the foreign-born population - Mexico (%)
Place of birth for the foreign-born population - Nicaragua (%)
Place of birth for the foreign-born population - Panama (%)
Place of birth for the foreign-born population - Other Central America (%)
Place of birth for the foreign-born population - Argentina (%)
Place of birth for the foreign-born population - Bolivia (%)
Place of birth for the foreign-born population - Brazil (%)
Place of birth for the foreign-born population - Chile (%)
Place of birth for the foreign-born population - Colombia (%)
Place of birth for the foreign-born population - Ecuador (%)
Place of birth for the foreign-born population - Guyana (%)
Place of birth for the foreign-born population - Peru (%)
Place of birth for the foreign-born population - Uruguay (%)
Place of birth for the foreign-born population - Venezuela (%)
Place of birth for the foreign-born population - Other South America (%)
Place of birth for the foreign-born population - Canada (%)
Place of birth for the foreign-born population - Other Northern America (%)
Place of birth for the foreign-born population - Other (%)
According to 2022 data, the most numerous races in Essex, MD are White alone (22,055 residents), Black alone (12,853 residents), and Hispanic (2,336 residents). 90.9% of Essex residents speak English at home. 9.3% of Essex, MD residents are foreign-born (3.8% born in Africa, 2.9% born in Latin America, 1.6% born in Asia), which is 71.2% less than the foreign-born rate of 16.0% across the entire state of Maryland.
Race distribution in Essex
2000 2022
3,286,547 62.1% White alone 1,464,735 27.7% Black alone 227,916 4.3% Hispanic 209,738 4.0% Asian alone 82,946 1.6% Two or more races 13,312 0.3% American Indian alone 9,379 0.2% Other race alone 1,913 0.04% Native Hawaiian and Other
2,906,492 47.1% White alone 1,800,914 29.2% Black alone 705,842 11.4% Hispanic 401,818 6.5% Asian alone 291,317 4.7% Two or more races 46,930 0.8% Other race alone 8,930 0.1% American Indian alone 2,417 0.04% Native Hawaiian and Other
Income and house value in Essex Median household income in 2022 $73,418 White non-Hispanic householders$60,844 Black householders$96,089 Asian householders$54,217 Two or more races householders$55,289 Hispanic or Latino race householdersMedian 2022 house value $253,179 White Non-Hispanic householders$213,499 Black or African American householders$217,595 American Indian or Alaska Native householders $243,195 Asian householders$248,315 Some other race householders$254,459 Two or more races householders$265,210 Hispanic or Latino householders
Median age by race in Essex
48.3 Median age for White residents47.5 48.4 34.7 Median age for Black or African American residents33.1 35.0 38.8 Median age for American Indian / Alaska Native residents42.9 34.2 46.9 Median age for Asian residents37.1 55.2 -1,541,125,539.6 Median age for Native Hawaiian / Pacific Islander residents-790,901,136.6 -760,942,760.2 27.4 Median age for Other race residents29.9 27.2 20.1 Median age for Two or more races residents18.8 23.2 49.0 Median age for White alone residents48.6 49.9 26.5 Median age for Hispanic or Latino residents26.6 26.2
Owner/renter occupied households by race in Essex
House owners and renters - White residents 7,252 75.8% Owner occupied2,309 24.2% Renter occupiedHouse owners and renters - Black or African American residents 1,560 31.5% Owner occupied3,388 68.5% Renter occupiedHouse owners and renters - American Indian / Alaska Native residents 32 69.7% Owner occupied14 30.3% Renter occupiedHouse owners and renters - Asian residents 136 77.9% Owner occupied39 22.1% Renter occupiedHouse owners and renters - Other race residents 150 53.4% Owner occupied131 46.6% Renter occupiedHouse owners and renters - Two or more races residents 455 37.3% Owner occupied765 62.7% Renter occupiedHouse owners and renters - White alone residents 7,132 76.0% Owner occupied2,251 24.0% Renter occupiedHouse owners and renters - Hispanic or Latino residents 433 53.4% Owner occupied378 46.6% Renter occupied
Language usage in Essex
English speakers - Total 90.9% of residents of Essex speak English at home.
3.7% of residents speak Spanish at home 1,099 77.1% Speak English very well326 22.9% Speak English less than very well5.5% of residents speak other language at home 1,532 72.8% Speak English very well571 27.2% Speak English less than very well
English speakers - Born in the United States 95.4% of residents of Essex speak English at home.
4.6% of residents speak Spanish at home 256 86.2% Speak English very well41 13.8% Speak English less than very well0.8% of residents speak other language at home 47 85.5% Speak English very well8 14.5% Speak English less than very well
All residents speak only English at home
English speakers - Foreign-born 39.1% of residents of Essex speak English at home.
14.8% of residents speak Spanish at home 426 76.5% Speak English very well131 23.5% Speak English less than very well46.4% of residents speak other language at home 1,233 70.5% Speak English very well517 29.5% Speak English less than very well
White (Caucasian) - Speak only English Native:
97.9% (20,611)Foreign-born:
21.1% (135)
White (Caucasian) - Speak another language Native:
2.2% (462)Foreign-born:
78.4% (500)
Black or African American - Speak only English Native:
99.4% (10,597)Foreign-born:
48.6% (879)
Black or African American - Speak another language Native:
1.1% (113)Foreign-born:
52.2% (944)
Asian - Speak only English Native:
18.7% (15)Foreign-born:
31.6% (173)
Asian - Speak another language Native:
80.8% (63)Foreign-born:
70.9% (389)
Other race - Speak only English Native:
20.2% (83)Foreign-born:
4.6% (18)
Other race - Speak another language Native:
79.0% (325)Foreign-born:
97.3% (392)
Two or more races - Speak only English Native:
89.2% (2,312)Foreign-born:
100.0% (370)
Two or more races - Speak another language Native:
9.8% (254)Foreign-born:
23.3% (86)
White alone - Speak only English Native:
98.2% (20,306)Foreign-born:
31.0% (124)
White alone - Speak another language Native:
1.8% (377)Foreign-born:
68.8% (275)
Hispanic or Latino - Speak only English Native:
66.1% (1,014)Foreign-born:
2.4% (15)
Hispanic or Latino - Speak another language Native:
36.1% (554)Foreign-born:
97.6% (604)
Foreign-born residents in Essex 3,796 residents are foreign born (3.8% Africa , 2.9% Latin America , 1.6% Asia ).
This city:
9.3%Maryland:
15.7%
Marital status for residents in Essex Marital status - White (Caucasian) population 15 years and over
Males 34.4% Never married46.0% Now married2.4% Separated4.5% Widowed12.6% DivorcedFemales 24.5% Never married42.9% Now married2.4% Separated14.1% Widowed16.1% DivorcedWomen who gave birth in the past 12 months Now married:
55.3% (82)Unmarried:
44.7% (66)
Women who did not give birth in the past 12 months Now married:
44.7% (2,045)Unmarried:
55.3% (2,529)
Marital status - Black or African American population 15 years and over
Males 44.0% Never married43.4% Now married4.1% Separated1.1% Widowed7.6% DivorcedFemales 52.0% Never married27.5% Now married3.2% Separated4.0% Widowed13.3% DivorcedWomen who gave birth in the past 12 months Now married:
67.5% (108)Unmarried:
32.5% (52)
Women who did not give birth in the past 12 months Now married:
29.2% (1,106)Unmarried:
70.8% (2,679)
Marital status - American Indian / Alaska Native population 15 years and over
Males 63.0% Never married0.0% Now married0.0% Separated37.0% Widowed0.0% DivorcedFemales 0.0% Never married25.0% Now married0.0% Separated75.0% Widowed0.0% DivorcedWomen who did not give birth in the past 12 months Now married:
100.0% (4)Unmarried:
0.0% (0)
Marital status - Asian population 15 years and over
Males 26.5% Never married68.0% Now married0.0% Separated0.0% Widowed5.5% DivorcedFemales 28.3% Never married52.9% Now married0.0% Separated10.6% Widowed8.2% DivorcedWomen who did not give birth in the past 12 months Now married:
54.9% (103)Unmarried:
45.1% (84)
Marital status - Other race population 15 years and over
Males 33.1% Never married66.9% Now married0.0% Separated0.0% Widowed0.0% DivorcedFemales 24.7% Never married54.2% Now married0.0% Separated14.7% Widowed6.4% DivorcedWomen who did not give birth in the past 12 months Now married:
60.6% (192)Unmarried:
39.4% (125)
Marital status - Two or more races population 15 years and over
Males 49.3% Never married26.8% Now married1.0% Separated4.1% Widowed18.7% DivorcedFemales 57.7% Never married26.4% Now married1.6% Separated2.0% Widowed12.2% DivorcedWomen who gave birth in the past 12 months Now married:
0.0% (0)Unmarried:
100.0% (18)
Women who did not give birth in the past 12 months Now married:
21.2% (164)Unmarried:
78.8% (609)
Marital status - White alone, not Hispanic / Latino population 15 years and over
Males 33.8% Never married46.1% Now married2.4% Separated4.7% Widowed13.0% DivorcedFemales 24.7% Never married42.4% Now married2.4% Separated14.2% Widowed16.2% DivorcedWomen who gave birth in the past 12 months Now married:
51.0% (70)Unmarried:
49.0% (67)
Women who did not give birth in the past 12 months Now married:
44.0% (1,946)Unmarried:
56.0% (2,480)
Marital status - Hispanic or Latino population 15 years and over
Males 40.3% Never married58.3% Now married0.0% Separated0.0% Widowed1.4% DivorcedFemales 19.1% Never married53.5% Now married1.5% Separated9.6% Widowed16.3% DivorcedWomen who gave birth in the past 12 months Now married:
100.0% (15)Unmarried:
0.0% (0)
Women who did not give birth in the past 12 months Now married:
58.4% (388)Unmarried:
41.6% (277)
Ancestries in Essex
2,197 11.6% German1,506 7.9% American1,201 6.3% English1,010 5.3% Irish960 5.1% Polish541 2.8% Italian511 2.7% Nigerian354 1.9% Jamaican314 1.7% Kenyan238 1.3% Sierra Leonean229 1.2% Scottish221 1.2% European155 0.8% Hungarian137 0.7% African114 0.6% Greek102 0.5% Brazilian88 0.5% West Indian83 0.4% Guyanese71 0.4% French70 0.4% Turkish69 0.4% Liberian67 0.4% Austrian66 0.3% Iranian58 0.3% Syrian57 0.3% Trinidadian and Tobagonian51 0.3% Scotch-Irish44 0.2% Dutch26 0.1% Czechoslovakian25 0.1% Ethiopian23 0.1% Scandinavian21 0.1% Armenian20 0.1% British West Indian19 0.1% Norwegian19 0.1% Czech17 0.09% Danish17 0.09% British10 0.05% Egyptian10 0.05% Welsh9 0.05% Slovak8 0.04% Pennsylvania German8 0.04% French Canadian8 0.04% Ghanaian8 0.04% Russian7 0.04% Moroccan7 0.04% Northern European6 0.03% Swedish4 0.02% Lithuanian
Children Nativity (place of birth) in Essex
Children under 6 years - Living with two parents Both parents native 613 100.0% NativeBoth parents foreign-born 141 100.0% NativeOne native, one foreign-born parent 193 100.0% NativeChildren under 6 years - Living with one parent Native parent 1,184 100.0% NativeForeign-born parent 124 100.0% NativeChildren 6 to 17 years - Living with two parents Both parents native 1,714 98.7% Native23 1.3% Foreign-bornBoth parents foreign-born 232 56.2% Native181 43.8% Foreign-bornOne native, one foreign-born parent 188 100.0% NativeChildren 6 to 17 years - Living with one parent Native parent 2,771 100.0% NativeForeign-born parent 179 50.5% Native175 49.5% Foreign-born
Grandparents responsible for own grandchildren in Essex
Grandparents (30 to 59 years) White / Caucasian 152 54.3% Responsible for grandchildren127 45.7% Not responsible for grandchildrenBlack or African American 60 45.8% Responsible for grandchildren71 54.2% Not responsible for grandchildrenAsian 7 100.0% Responsible for grandchildrenTwo or more races 18 100.0% Responsible for grandchildrenWhite alone, not Hispanic / Latino 152 55.2% Responsible for grandchildren123 44.8% Not responsible for grandchildrenGrandparents (60 years and over) White / Caucasian 128 39.1% Responsible for grandchildren199 60.9% Not responsible for grandchildrenBlack or African American 3 1.3% Responsible for grandchildren213 98.7% Not responsible for grandchildrenAsian 47 100.0% Not responsible for grandchildrenTwo or more races 6 100.0% Not responsible for grandchildrenWhite alone, not Hispanic / Latino 130 38.4% Responsible for grandchildren208 61.6% Not responsible for grandchildren