Races in Estelle, Louisiana (LA) Detailed Stats
Data:
Races - White alone (%)
Races - White alone (% change since 2000)
Races - Black alone (%)
Races - Black alone (% change since 2000)
Races - American Indian alone (%)
Races - American Indian alone (% change since 2000)
Races - Asian alone (%)
Races - Asian alone (% change since 2000)
Races - Hispanic (%)
Races - Hispanic (% change since 2000)
Races - Native Hawaiian and Other Pacific Islander alone (%)
Races - Native Hawaiian and Other Pacific Islander alone (% change since 2000)
Races - Two or more races(%)
Races - Two or more races(% change since 2000)
Races - Other race alone (%)
Races - Other race alone (% change since 2000)
Racial diversity
Place of birth - Born in state of residence (%)
Place of birth - Born in state of residence (%) - White
Place of birth - Born in state of residence (%) - Black or African American
Place of birth - Born in state of residence (%) - Asian
Place of birth - Born in state of residence (%) - Hispanic or Latino
Place of birth - Born in state of residence (%) - American Indian and Alaska Native
Place of birth - Born in state of residence (%) - Multirace
Place of birth - Born in state of residence (%) - Other Race
Place of birth - Born in other state (%)
Place of birth - Born in other state (%) - White
Place of birth - Born in other state (%) - Black or African American
Place of birth - Born in other state (%) - Asian
Place of birth - Born in other state (%) - Hispanic or Latino
Place of birth - Born in other state (%) - American Indian and Alaska Native
Place of birth - Born in other state (%) - Multirace
Place of birth - Born in other state (%) - Other Race
Place of birth - Native, outside of US (%)
Place of birth - Native, outside of US (%) - White
Place of birth - Native, outside of US (%) - Black or African American
Place of birth - Native, outside of US (%) - Asian
Place of birth - Native, outside of US (%) - Hispanic or Latino
Place of birth - Native, outside of US (%) - American Indian and Alaska Native
Place of birth - Native, outside of US (%) - Multirace
Place of birth - Native, outside of US (%) - Other Race
Place of birth - Foreign born (%)
Place of birth - Foreign born (%) - White
Place of birth - Foreign born (%) - Black or African American
Place of birth - Foreign born (%) - Asian
Place of birth - Foreign born (%) - Hispanic or Latino
Place of birth - Foreign born (%) - American Indian and Alaska Native
Place of birth - Foreign born (%) - Multirace
Place of birth - Foreign born (%) - Other Race
Residents speaking English at home (%)
Residents speaking English at home - Born in the United States (%)
Residents speaking English at home - Native, born elsewhere (%)
Residents speaking English at home - Foreign born (%)
Residents speaking Spanish at home (%)
Residents speaking Spanish at home - Born in the United States (%)
Residents speaking Spanish at home - Native, born elsewhere (%)
Residents speaking Spanish at home - Foreign born (%)
Residents speaking other language at home (%)
Residents speaking other language at home - Born in the United States (%)
Residents speaking other language at home - Native, born elsewhere (%)
Residents speaking other language at home - Foreign born (%)
Marital status - Never married (%)
Marital status - Now married (%)
Marital status - Separated (%)
Marital status - Widowed (%)
Marital status - Divorced (%)
Ancestries Reported - Arab (%)
Ancestries Reported - Czech (%)
Ancestries Reported - Danish (%)
Ancestries Reported - Dutch (%)
Ancestries Reported - English (%)
Ancestries Reported - French (%)
Ancestries Reported - French Canadian (%)
Ancestries Reported - German (%)
Ancestries Reported - Greek (%)
Ancestries Reported - Hungarian (%)
Ancestries Reported - Irish (%)
Ancestries Reported - Italian (%)
Ancestries Reported - Lithuanian (%)
Ancestries Reported - Norwegian (%)
Ancestries Reported - Polish (%)
Ancestries Reported - Portuguese (%)
Ancestries Reported - Russian (%)
Ancestries Reported - Scotch-Irish (%)
Ancestries Reported - Scottish (%)
Ancestries Reported - Slovak (%)
Ancestries Reported - Subsaharan African (%)
Ancestries Reported - Swedish (%)
Ancestries Reported - Swiss (%)
Ancestries Reported - Ukrainian (%)
Ancestries Reported - United States (%)
Ancestries Reported - Welsh (%)
Ancestries Reported - West Indian (%)
Ancestries Reported - Other (%)
Geographical mobility - Same house 1 year ago (%)
Geographical mobility - Same house 1 year ago (%) - White
Geographical mobility - Same house 1 year ago (%) - Black or African American
Geographical mobility - Same house 1 year ago (%) - Asian
Geographical mobility - Same house 1 year ago (%) - Hispanic or Latino
Geographical mobility - Same house 1 year ago (%) - American Indian and Alaska Native
Geographical mobility - Same house 1 year ago (%) - Multirace
Geographical mobility - Same house 1 year ago (%) - Other Race
Geographical mobility - Moved within same county (%)
Geographical mobility - Moved within same county (%) - White
Geographical mobility - Moved within same county (%) - Black or African American
Geographical mobility - Moved within same county (%) - Asian
Geographical mobility - Moved within same county (%) - Hispanic or Latino
Geographical mobility - Moved within same county (%) - American Indian and Alaska Native
Geographical mobility - Moved within same county (%) - Multirace
Geographical mobility - Moved within same county (%) - Other Race
Geographical mobility - Moved from different county within same state (%)
Geographical mobility - Moved from different county within same state (%) - White
Geographical mobility - Moved from different county within same state (%) - Black or African American
Geographical mobility - Moved from different county within same state (%) - Asian
Geographical mobility - Moved from different county within same state (%) - Hispanic or Latino
Geographical mobility - Moved from different county within same state (%) - American Indian and Alaska Native
Geographical mobility - Moved from different county within same state (%) - Multirace
Geographical mobility - Moved from different county within same state (%) - Other Race
Geographical mobility - Moved from different state (%)
Geographical mobility - Moved from different state (%) - White
Geographical mobility - Moved from different state (%) - Black or African American
Geographical mobility - Moved from different state (%) - Asian
Geographical mobility - Moved from different state (%) - Hispanic or Latino
Geographical mobility - Moved from different state (%) - American Indian and Alaska Native
Geographical mobility - Moved from different state (%) - Multirace
Geographical mobility - Moved from different state (%) - Other Race
Geographical mobility - Moved from abroad (%)
Geographical mobility - Moved from abroad (%) - White
Geographical mobility - Moved from abroad (%) - Black or African American
Geographical mobility - Moved from abroad (%) - Asian
Geographical mobility - Moved from abroad (%) - Hispanic or Latino
Geographical mobility - Moved from abroad (%) - American Indian and Alaska Native
Geographical mobility - Moved from abroad (%) - Multirace
Geographical mobility - Moved from abroad (%) - Other Race
Place of birth for the foreign-born population - Ireland (%)
Place of birth for the foreign-born population - Denmark (%)
Place of birth for the foreign-born population - Norway (%)
Place of birth for the foreign-born population - Sweden (%)
Place of birth for the foreign-born population - United Kingdom (%)
Place of birth for the foreign-born population - England (%)
Place of birth for the foreign-born population - Scotland (%)
Place of birth for the foreign-born population - Other Northern Europe (%)
Place of birth for the foreign-born population - Austria (%)
Place of birth for the foreign-born population - Belgium (%)
Place of birth for the foreign-born population - France (%)
Place of birth for the foreign-born population - Germany (%)
Place of birth for the foreign-born population - Netherlands (%)
Place of birth for the foreign-born population - Switzerland (%)
Place of birth for the foreign-born population - Other Western Europe (%)
Place of birth for the foreign-born population - Greece (%)
Place of birth for the foreign-born population - Italy (%)
Place of birth for the foreign-born population - Portugal (%)
Place of birth for the foreign-born population - Spain (%)
Place of birth for the foreign-born population - Other Southern Europe (%)
Place of birth for the foreign-born population - Albania (%)
Place of birth for the foreign-born population - Belarus (%)
Place of birth for the foreign-born population - Bosnia and Herzegovina (%)
Place of birth for the foreign-born population - Bulgaria (%)
Place of birth for the foreign-born population - Croatia (%)
Place of birth for the foreign-born population - Czechoslovakia (%)
Place of birth for the foreign-born population - Hungary (%)
Place of birth for the foreign-born population - Latvia (%)
Place of birth for the foreign-born population - Lithuania (%)
Place of birth for the foreign-born population - North Macedonia (Macedonia) (%)
Place of birth for the foreign-born population - Moldova (%)
Place of birth for the foreign-born population - Poland (%)
Place of birth for the foreign-born population - Romania (%)
Place of birth for the foreign-born population - Russia (%)
Place of birth for the foreign-born population - Serbia (%)
Place of birth for the foreign-born population - Ukraine (%)
Place of birth for the foreign-born population - Other Eastern Europe (%)
Place of birth for the foreign-born population - China (%)
Place of birth for the foreign-born population - Hong Kong (%)
Place of birth for the foreign-born population - Taiwan (%)
Place of birth for the foreign-born population - Japan (%)
Place of birth for the foreign-born population - Korea (%)
Place of birth for the foreign-born population - Other Eastern Asia (%)
Place of birth for the foreign-born population - Afghanistan (%)
Place of birth for the foreign-born population - Bangladesh (%)
Place of birth for the foreign-born population - India (%)
Place of birth for the foreign-born population - Iran (%)
Place of birth for the foreign-born population - Kazakhstan (%)
Place of birth for the foreign-born population - Nepal (%)
Place of birth for the foreign-born population - Pakistan (%)
Place of birth for the foreign-born population - Sri Lanka (%)
Place of birth for the foreign-born population - Uzbekistan (%)
Place of birth for the foreign-born population - Other South Central Asia (%)
Place of birth for the foreign-born population - Burma (%)
Place of birth for the foreign-born population - Cambodia (%)
Place of birth for the foreign-born population - Indonesia (%)
Place of birth for the foreign-born population - Laos (%)
Place of birth for the foreign-born population - Malaysia (%)
Place of birth for the foreign-born population - Philippines (%)
Place of birth for the foreign-born population - Singapore (%)
Place of birth for the foreign-born population - Thailand (%)
Place of birth for the foreign-born population - Vietnam (%)
Place of birth for the foreign-born population - Other South Eastern Asia (%)
Place of birth for the foreign-born population - Armenia (%)
Place of birth for the foreign-born population - Iraq (%)
Place of birth for the foreign-born population - Israel (%)
Place of birth for the foreign-born population - Jordan (%)
Place of birth for the foreign-born population - Kuwait (%)
Place of birth for the foreign-born population - Lebanon (%)
Place of birth for the foreign-born population - Saudi Arabia (%)
Place of birth for the foreign-born population - Syria (%)
Place of birth for the foreign-born population - Turkey (%)
Place of birth for the foreign-born population - Yemen (%)
Place of birth for the foreign-born population - Other Western Asia (%)
Place of birth for the foreign-born population - Eritrea (%)
Place of birth for the foreign-born population - Ethiopia (%)
Place of birth for the foreign-born population - Kenya (%)
Place of birth for the foreign-born population - Somalia (%)
Place of birth for the foreign-born population - Uganda (%)
Place of birth for the foreign-born population - Zimbabwe (%)
Place of birth for the foreign-born population - Other Eastern Africa (%)
Place of birth for the foreign-born population - Cameroon (%)
Place of birth for the foreign-born population - Congo (%)
Place of birth for the foreign-born population - Democratic Republic of Congo (Zaire) (%)
Place of birth for the foreign-born population - Other Middle Africa (%)
Place of birth for the foreign-born population - Egypt (%)
Place of birth for the foreign-born population - Morocco (%)
Place of birth for the foreign-born population - Sudan (%)
Place of birth for the foreign-born population - Other Northern Africa (%)
Place of birth for the foreign-born population - South Africa (%)
Place of birth for the foreign-born population - Other Southern Africa (%)
Place of birth for the foreign-born population - Cabo Verde (%)
Place of birth for the foreign-born population - Ghana (%)
Place of birth for the foreign-born population - Liberia (%)
Place of birth for the foreign-born population - Nigeria (%)
Place of birth for the foreign-born population - Senegal (%)
Place of birth for the foreign-born population - Sierra Leone (%)
Place of birth for the foreign-born population - Other Western Africa (%)
Place of birth for the foreign-born population - Australia (%)
Place of birth for the foreign-born population - New Zealand (%)
Place of birth for the foreign-born population - Fiji (%)
Place of birth for the foreign-born population - Micronesia (%)
Place of birth for the foreign-born population - Bahamas (%)
Place of birth for the foreign-born population - Barbados (%)
Place of birth for the foreign-born population - Cuba (%)
Place of birth for the foreign-born population - Dominica (%)
Place of birth for the foreign-born population - Dominican Republic (%)
Place of birth for the foreign-born population - Grenada (%)
Place of birth for the foreign-born population - Haiti (%)
Place of birth for the foreign-born population - Jamaica (%)
Place of birth for the foreign-born population - St. Vincent and the Grenadines (%)
Place of birth for the foreign-born population - Trinidad and Tobago (%)
Place of birth for the foreign-born population - West Indies (%)
Place of birth for the foreign-born population - Other Caribbean (%)
Place of birth for the foreign-born population - Belize (%)
Place of birth for the foreign-born population - Costa Rica (%)
Place of birth for the foreign-born population - El Salvador (%)
Place of birth for the foreign-born population - Guatemala (%)
Place of birth for the foreign-born population - Honduras (%)
Place of birth for the foreign-born population - Mexico (%)
Place of birth for the foreign-born population - Nicaragua (%)
Place of birth for the foreign-born population - Panama (%)
Place of birth for the foreign-born population - Other Central America (%)
Place of birth for the foreign-born population - Argentina (%)
Place of birth for the foreign-born population - Bolivia (%)
Place of birth for the foreign-born population - Brazil (%)
Place of birth for the foreign-born population - Chile (%)
Place of birth for the foreign-born population - Colombia (%)
Place of birth for the foreign-born population - Ecuador (%)
Place of birth for the foreign-born population - Guyana (%)
Place of birth for the foreign-born population - Peru (%)
Place of birth for the foreign-born population - Uruguay (%)
Place of birth for the foreign-born population - Venezuela (%)
Place of birth for the foreign-born population - Other South America (%)
Place of birth for the foreign-born population - Canada (%)
Place of birth for the foreign-born population - Other Northern America (%)
Place of birth for the foreign-born population - Other (%)
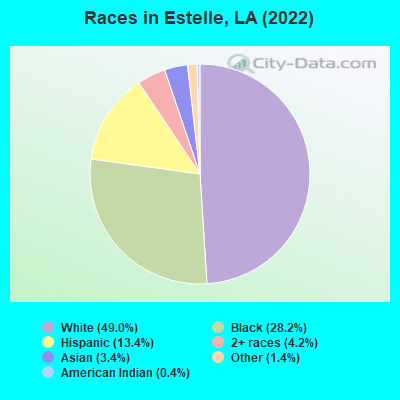
According to 2022 data, the most numerous races in Estelle, LA are White alone (8,177 residents), Black alone (4,708 residents), and Hispanic (2,233 residents). 86.8% of Estelle residents speak English at home. 8.7% of Estelle, LA residents are foreign-born (5.6% born in Latin America, 2.7% born in Asia), which is 54.2% greater than the foreign-born rate of 4.0% across the entire state of Louisiana.
Race distribution in Estelle
2000 2022
2,794,391 62.5% White alone 1,443,390 32.3% Black alone 107,738 2.4% Hispanic 54,256 1.2% Asian alone 39,260 0.9% Two or more races 24,129 0.5% American Indian alone 4,736 0.1% Other race alone 1,076 0.02% Native Hawaiian and Other
2,603,221 56.7% White alone 1,420,055 30.9% Black alone 262,213 5.7% Hispanic 183,270 4.0% Two or more races 81,169 1.8% Asian alone 19,991 0.4% American Indian alone 18,043 0.4% Other race alone 2,279 0.05% Native Hawaiian and Other
Income and house value in Estelle Median household income in 2022 $73,240 White non-Hispanic householders$76,548 Black householders$38,668 Some other race householders$83,872 Two or more races householders$62,678 Hispanic or Latino race householdersMedian 2022 house value $232,446 White Non-Hispanic householders$221,351 Black or African American householders$253,528 American Indian or Alaska Native householders $224,957 Asian householders$212,752 Some other race householders$230,782 Two or more races householders$199,160 Hispanic or Latino householders
Median age by race in Estelle
40.5 Median age for White residents44.0 36.5 37.3 Median age for Black or African American residents32.4 44.1 63.5 Median age for American Indian / Alaska Native residents49.7 -1,174,917,490.6 43.6 Median age for Asian residents43.3 48.3 -1,031,509,120.0 Median age for Native Hawaiian / Pacific Islander residents-868,167,201.7 -599,999,999.4 31.8 Median age for Other race residents37.7 25.9 28.7 Median age for Two or more races residents26.9 39.8 38.3 Median age for White alone residents43.7 35.7 38.7 Median age for Hispanic or Latino residents33.0 51.0
Owner/renter occupied households by race in Estelle
House owners and renters - White residents 3,019 92.6% Owner occupied240 7.4% Renter occupiedHouse owners and renters - Black or African American residents 1,315 86.4% Owner occupied206 13.6% Renter occupiedHouse owners and renters - American Indian / Alaska Native residents 2 100.0% Owner occupiedHouse owners and renters - Asian residents 237 100.0% Owner occupiedHouse owners and renters - Other race residents 197 58.5% Owner occupied140 41.5% Renter occupiedHouse owners and renters - Two or more races residents 665 91.7% Owner occupied60 8.3% Renter occupiedHouse owners and renters - White alone residents 2,860 93.0% Owner occupied216 7.0% Renter occupiedHouse owners and renters - Hispanic or Latino residents 765 85.6% Owner occupied129 14.4% Renter occupied
Language usage in Estelle
English speakers - Total 86.8% of residents of Estelle speak English at home.
9.7% of residents speak Spanish at home 1,024 66.3% Speak English very well521 33.7% Speak English less than very well3.6% of residents speak other language at home 296 52.1% Speak English very well272 47.9% Speak English less than very well
English speakers - Born in the United States 91.7% of residents of Estelle speak English at home.
6.7% of residents speak Spanish at home 137 100.0% Speak English very well1.3% of residents speak other language at home 13 48.1% Speak English very well14 51.9% Speak English less than very well
English speakers - Native, born elsewhere 72.6% of residents of Estelle speak English at home.
13.4% of residents speak Spanish at home 22 100.0% Speak English very well
English speakers - Foreign-born 10.7% of residents of Estelle speak English at home.
62.9% of residents speak Spanish at home 320 40.8% Speak English very well465 59.2% Speak English less than very well26.4% of residents speak other language at home 114 34.7% Speak English very well215 65.3% Speak English less than very well
White (Caucasian) - Speak only English Native:
100.0% (8,067)Foreign-born:
23.6% (17)
White (Caucasian) - Speak another language Native:
0.7% (57)Foreign-born:
73.3% (53)
Black or African American - Speak only English Native:
96.2% (4,317)Foreign-born:
98.2% (9)
Asian - Speak only English Native:
7.6% (8)Foreign-born:
22.4% (103)
Asian - Speak another language Native:
100.0% (111)Foreign-born:
77.2% (355)
Other race - Speak only English Native:
54.6% (246)Foreign-born:
5.1% (22)
Other race - Speak another language Native:
44.6% (201)Foreign-born:
90.9% (396)
Two or more races - Speak only English Native:
61.7% (1,077)Foreign-born:
2.1% (14)
Two or more races - Speak another language Native:
40.7% (710)Foreign-born:
98.7% (683)
White alone - Speak only English Native:
99.4% (7,782)Foreign-born:
72.3% (3)
Hispanic or Latino - Speak only English Native:
60.4% (872)Foreign-born:
5.3% (44)
Hispanic or Latino - Speak another language Native:
40.0% (577)Foreign-born:
93.6% (777)
Foreign-born residents in Estelle 1,458 residents are foreign born (5.6% Latin America , 2.7% Asia ).
This city:
8.7%Louisiana:
4.2%
Marital status for residents in Estelle Marital status - White (Caucasian) population 15 years and over
Males 32.9% Never married47.2% Now married0.3% Separated4.5% Widowed15.1% DivorcedFemales 34.4% Never married47.9% Now married1.9% Separated6.8% Widowed9.0% DivorcedWomen who gave birth in the past 12 months Now married:
45.7% (73)Unmarried:
54.3% (87)
Women who did not give birth in the past 12 months Now married:
43.5% (819)Unmarried:
56.5% (1,063)
Marital status - Black or African American population 15 years and over
Males 47.7% Never married50.3% Now married0.0% Separated0.0% Widowed2.0% DivorcedFemales 37.3% Never married40.3% Now married1.7% Separated7.3% Widowed13.3% DivorcedWomen who gave birth in the past 12 months Now married:
100.0% (9)Unmarried:
0.0% (0)
Women who did not give birth in the past 12 months Now married:
30.3% (401)Unmarried:
69.7% (922)
Marital status - American Indian / Alaska Native population 15 years and over
Males 0.0% Never married100.0% Now married0.0% Separated0.0% Widowed0.0% DivorcedFemales 0.0% Never married100.0% Now married0.0% Separated0.0% Widowed0.0% DivorcedMarital status - Asian population 15 years and over
Males 44.0% Never married42.7% Now married0.0% Separated13.3% Widowed0.0% DivorcedFemales 11.3% Never married88.7% Now married0.0% Separated0.0% Widowed0.0% DivorcedWomen who did not give birth in the past 12 months Now married:
82.1% (96)Unmarried:
17.9% (21)
Marital status - Other race population 15 years and over
Males 19.7% Never married60.2% Now married0.0% Separated0.0% Widowed20.1% DivorcedFemales 50.4% Never married39.5% Now married0.0% Separated10.1% Widowed0.0% DivorcedWomen who did not give birth in the past 12 months Now married:
44.0% (125)Unmarried:
56.0% (159)
Marital status - Two or more races population 15 years and over
Males 66.5% Never married30.2% Now married0.0% Separated1.0% Widowed2.3% DivorcedFemales 32.1% Never married58.8% Now married0.0% Separated0.0% Widowed9.1% DivorcedWomen who did not give birth in the past 12 months Now married:
22.4% (123)Unmarried:
77.6% (424)
Marital status - White alone, not Hispanic / Latino population 15 years and over
Males 31.7% Never married48.8% Now married0.4% Separated4.8% Widowed14.3% DivorcedFemales 35.1% Never married48.3% Now married2.0% Separated6.8% Widowed7.9% DivorcedWomen who gave birth in the past 12 months Now married:
45.7% (79)Unmarried:
54.3% (94)
Women who did not give birth in the past 12 months Now married:
43.3% (866)Unmarried:
56.7% (1,134)
Marital status - Hispanic or Latino population 15 years and over
Males 56.1% Never married32.3% Now married0.0% Separated0.0% Widowed11.6% DivorcedFemales 26.3% Never married61.3% Now married0.0% Separated4.7% Widowed7.6% DivorcedWomen who did not give birth in the past 12 months Now married:
39.1% (114)Unmarried:
60.9% (178)
Ancestries in Estelle
902 10.3% French651 7.4% Italian407 4.7% German325 3.7% American161 1.8% Irish131 1.5% English115 1.3% Belizean112 1.3% African65 0.7% Cajun59 0.7% French Canadian57 0.7% Palestinian26 0.3% Slovene18 0.2% Scottish15 0.2% European9 0.1% British4 0.05% Czech
Children Nativity (place of birth) in Estelle
Children under 6 years - Living with two parents Both parents native 564 100.0% NativeChildren under 6 years - Living with one parent Native parent 346 100.0% NativeForeign-born parent 10 11.7% Native72 88.3% Foreign-bornChildren 6 to 17 years - Living with two parents Both parents native 1,249 99.9% Native1 0.1% Foreign-bornBoth parents foreign-born 153 72.9% Native57 27.1% Foreign-bornChildren 6 to 17 years - Living with one parent Native parent 1,278 100.0% NativeForeign-born parent 102 46.5% Native117 53.5% Foreign-born
Grandparents responsible for own grandchildren in Estelle
Grandparents (30 to 59 years) White / Caucasian 175 84.5% Responsible for grandchildren32 15.5% Not responsible for grandchildrenAsian 3 100.0% Not responsible for grandchildrenWhite alone, not Hispanic / Latino 223 83.4% Responsible for grandchildren44 16.6% Not responsible for grandchildrenGrandparents (60 years and over) White / Caucasian 55 42.8% Responsible for grandchildren74 57.2% Not responsible for grandchildrenWhite alone, not Hispanic / Latino 58 41.1% Responsible for grandchildren84 58.9% Not responsible for grandchildren