Races in Etna, Maine (ME) Detailed Stats
Ancestries, Foreign-born residents, place of birth

Recent posts about races in Etna, Maine on our local forum with over 2,400,000 registered users:
 | off grid living in maine (39 replies) |
| Rural Maine questions (North or Central) (24 replies) |
| Etna, Maine info please (1 reply) |
| Blueberries? (56 replies) |
1.4% of Etna, ME residents are foreign-born , which is 116.9% less than the foreign-born rate of 3.0% across the entire state of Maine.
Race distribution in Etna

- 1,00299.0%White alone
- 30.3%Asian alone
- 20.2%Two or more races
- 20.2%Black alone
- 20.2%American Indian alone
- 10.10%Hispanic

2000
2022
-
- 1,230,29796.5%White alone
- 11,7310.9%Two or more races
- 9,3600.7%Hispanic
- 9,0140.7%Asian alone
- 6,4400.5%Black alone
- 6,9110.5%American Indian alone
- 8360.07%Other race alone
- 3340.03%Native Hawaiian and Other
Pacific Islander alone

-
- 1,249,23390.2%White alone
- 58,3574.2%Two or more races
- 28,7172.1%Hispanic
- 21,5831.6%Black alone
- 16,1511.2%Asian alone
- 5,8730.4%Other race alone
- 5,2050.4%American Indian alone
- 2210.02%Native Hawaiian and Other
Pacific Islander alone

Income and house value in Etna
- Median household income in 2022
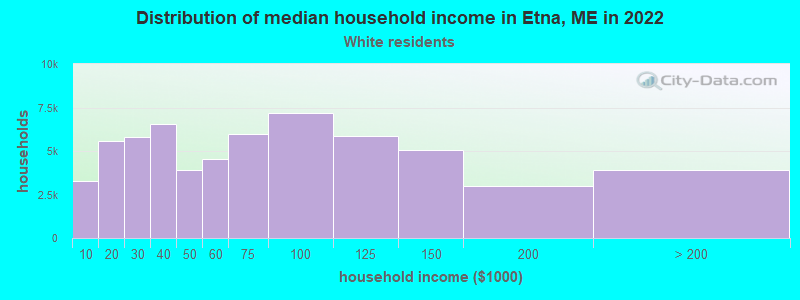
- $60,749White non-Hispanic householders
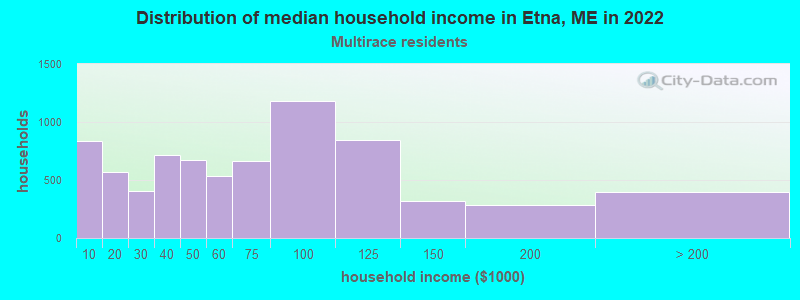
- $18,120Two or more races householders
- Median 2022 house value
- $205,303White Non-Hispanic householders
- $84,567Two or more races householders
Household income for White non-Hispanic householders
Household income for Two or more races householders
Foreign-born residents in Etna
14 residents are foreign born
| This city: | 1.4% |
| Maine: | 2.9% |
Ancestries in Etna

- 18118.2%English
- 15916.0%Irish
- 13713.8%French
- 11611.7%United States
- 919.1%Other
- 454.5%German
- 444.4%Scottish
- 414.1%Scotch-Irish
- 353.5%French Canadian
- 313.1%Italian
- 252.5%Dutch
- 252.5%Polish
- 212.1%Norwegian
- 191.9%Swedish
- 111.1%Portuguese
- 60.6%Czech
- 20.2%Greek
- 20.2%Hungarian
- 20.2%Subsaharan African
- 20.2%Welsh

Zip codes: 04434.