Races in Eugene, Oregon (OR) Detailed Stats
Data:
Races - White alone (%)
Races - White alone (% change since 2000)
Races - Black alone (%)
Races - Black alone (% change since 2000)
Races - American Indian alone (%)
Races - American Indian alone (% change since 2000)
Races - Asian alone (%)
Races - Asian alone (% change since 2000)
Races - Hispanic (%)
Races - Hispanic (% change since 2000)
Races - Native Hawaiian and Other Pacific Islander alone (%)
Races - Native Hawaiian and Other Pacific Islander alone (% change since 2000)
Races - Two or more races(%)
Races - Two or more races(% change since 2000)
Races - Other race alone (%)
Races - Other race alone (% change since 2000)
Racial diversity
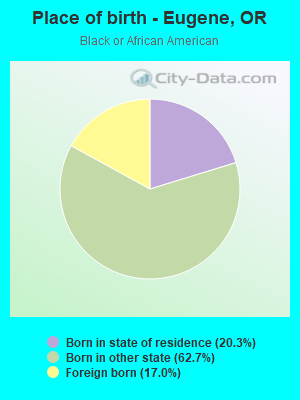
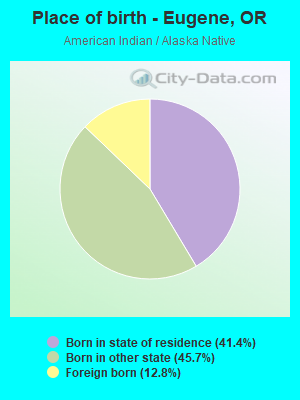
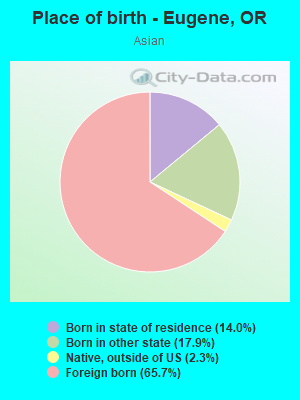
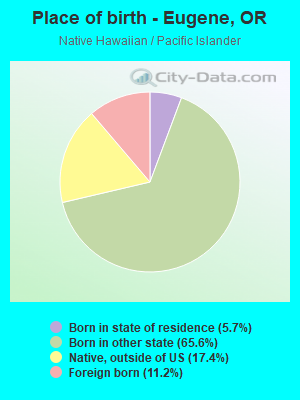
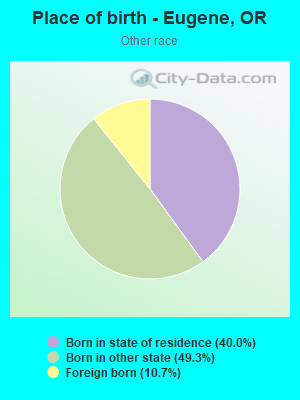
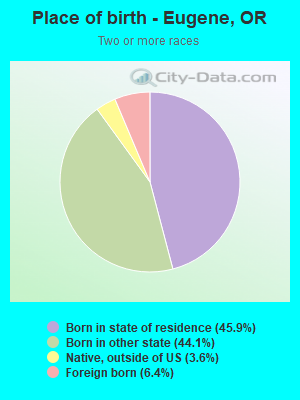
Place of birth - Born in state of residence (%)
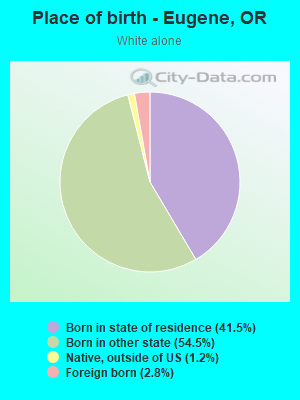
Place of birth - Born in state of residence (%) - White
Place of birth - Born in state of residence (%) - Black or African American
Place of birth - Born in state of residence (%) - Asian
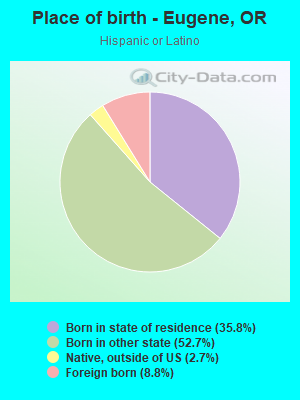
Place of birth - Born in state of residence (%) - Hispanic or Latino
Place of birth - Born in state of residence (%) - American Indian and Alaska Native
Place of birth - Born in state of residence (%) - Multirace
Place of birth - Born in state of residence (%) - Other Race
Place of birth - Born in other state (%)
Place of birth - Born in other state (%) - White
Place of birth - Born in other state (%) - Black or African American
Place of birth - Born in other state (%) - Asian
Place of birth - Born in other state (%) - Hispanic or Latino
Place of birth - Born in other state (%) - American Indian and Alaska Native
Place of birth - Born in other state (%) - Multirace
Place of birth - Born in other state (%) - Other Race
Place of birth - Native, outside of US (%)
Place of birth - Native, outside of US (%) - White
Place of birth - Native, outside of US (%) - Black or African American
Place of birth - Native, outside of US (%) - Asian
Place of birth - Native, outside of US (%) - Hispanic or Latino
Place of birth - Native, outside of US (%) - American Indian and Alaska Native
Place of birth - Native, outside of US (%) - Multirace
Place of birth - Native, outside of US (%) - Other Race
Place of birth - Foreign born (%)
Place of birth - Foreign born (%) - White
Place of birth - Foreign born (%) - Black or African American
Place of birth - Foreign born (%) - Asian
Place of birth - Foreign born (%) - Hispanic or Latino
Place of birth - Foreign born (%) - American Indian and Alaska Native
Place of birth - Foreign born (%) - Multirace
Place of birth - Foreign born (%) - Other Race
Residents speaking English at home (%)
Residents speaking English at home - Born in the United States (%)
Residents speaking English at home - Native, born elsewhere (%)
Residents speaking English at home - Foreign born (%)
Residents speaking Spanish at home (%)
Residents speaking Spanish at home - Born in the United States (%)
Residents speaking Spanish at home - Native, born elsewhere (%)
Residents speaking Spanish at home - Foreign born (%)
Residents speaking other language at home (%)
Residents speaking other language at home - Born in the United States (%)
Residents speaking other language at home - Native, born elsewhere (%)
Residents speaking other language at home - Foreign born (%)
Marital status - Never married (%)
Marital status - Now married (%)
Marital status - Separated (%)
Marital status - Widowed (%)
Marital status - Divorced (%)
Ancestries Reported - Arab (%)
Ancestries Reported - Czech (%)
Ancestries Reported - Danish (%)
Ancestries Reported - Dutch (%)
Ancestries Reported - English (%)
Ancestries Reported - French (%)
Ancestries Reported - French Canadian (%)
Ancestries Reported - German (%)
Ancestries Reported - Greek (%)
Ancestries Reported - Hungarian (%)
Ancestries Reported - Irish (%)
Ancestries Reported - Italian (%)
Ancestries Reported - Lithuanian (%)
Ancestries Reported - Norwegian (%)
Ancestries Reported - Polish (%)
Ancestries Reported - Portuguese (%)
Ancestries Reported - Russian (%)
Ancestries Reported - Scotch-Irish (%)
Ancestries Reported - Scottish (%)
Ancestries Reported - Slovak (%)
Ancestries Reported - Subsaharan African (%)
Ancestries Reported - Swedish (%)
Ancestries Reported - Swiss (%)
Ancestries Reported - Ukrainian (%)
Ancestries Reported - United States (%)
Ancestries Reported - Welsh (%)
Ancestries Reported - West Indian (%)
Ancestries Reported - Other (%)
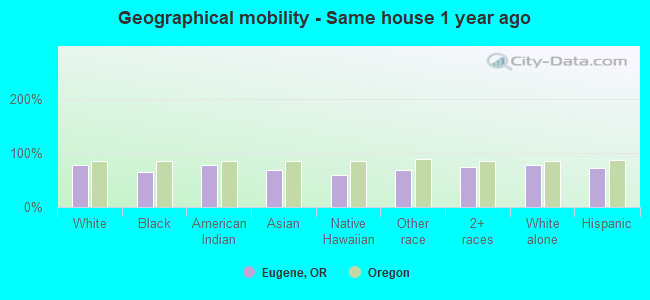
Geographical mobility - Same house 1 year ago (%)
Geographical mobility - Same house 1 year ago (%) - White
Geographical mobility - Same house 1 year ago (%) - Black or African American
Geographical mobility - Same house 1 year ago (%) - Asian
Geographical mobility - Same house 1 year ago (%) - Hispanic or Latino
Geographical mobility - Same house 1 year ago (%) - American Indian and Alaska Native
Geographical mobility - Same house 1 year ago (%) - Multirace
Geographical mobility - Same house 1 year ago (%) - Other Race
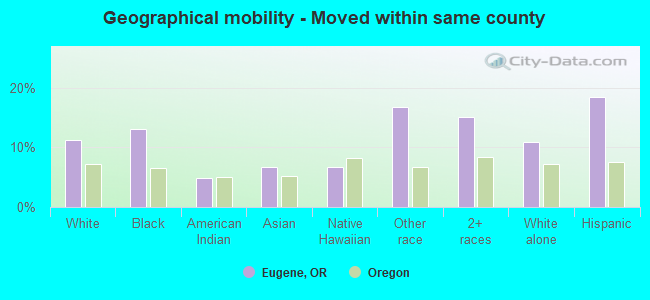
Geographical mobility - Moved within same county (%)
Geographical mobility - Moved within same county (%) - White
Geographical mobility - Moved within same county (%) - Black or African American
Geographical mobility - Moved within same county (%) - Asian
Geographical mobility - Moved within same county (%) - Hispanic or Latino
Geographical mobility - Moved within same county (%) - American Indian and Alaska Native
Geographical mobility - Moved within same county (%) - Multirace
Geographical mobility - Moved within same county (%) - Other Race
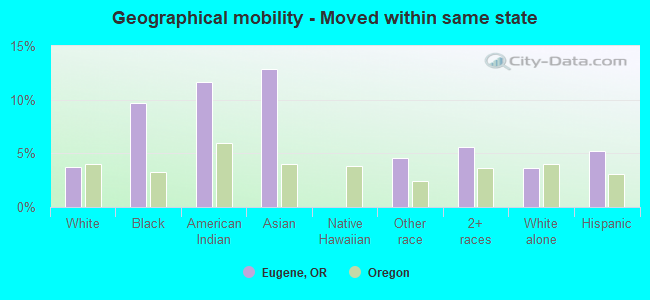
Geographical mobility - Moved from different county within same state (%)
Geographical mobility - Moved from different county within same state (%) - White
Geographical mobility - Moved from different county within same state (%) - Black or African American
Geographical mobility - Moved from different county within same state (%) - Asian
Geographical mobility - Moved from different county within same state (%) - Hispanic or Latino
Geographical mobility - Moved from different county within same state (%) - American Indian and Alaska Native
Geographical mobility - Moved from different county within same state (%) - Multirace
Geographical mobility - Moved from different county within same state (%) - Other Race
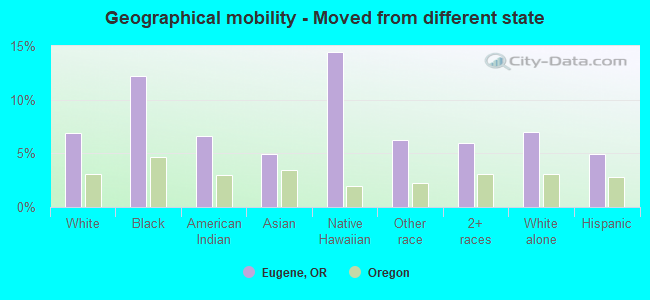
Geographical mobility - Moved from different state (%)
Geographical mobility - Moved from different state (%) - White
Geographical mobility - Moved from different state (%) - Black or African American
Geographical mobility - Moved from different state (%) - Asian
Geographical mobility - Moved from different state (%) - Hispanic or Latino
Geographical mobility - Moved from different state (%) - American Indian and Alaska Native
Geographical mobility - Moved from different state (%) - Multirace
Geographical mobility - Moved from different state (%) - Other Race
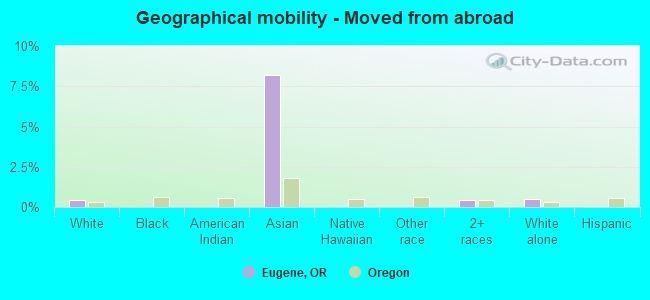
Geographical mobility - Moved from abroad (%)
Geographical mobility - Moved from abroad (%) - White
Geographical mobility - Moved from abroad (%) - Black or African American
Geographical mobility - Moved from abroad (%) - Asian
Geographical mobility - Moved from abroad (%) - Hispanic or Latino
Geographical mobility - Moved from abroad (%) - American Indian and Alaska Native
Geographical mobility - Moved from abroad (%) - Multirace
Geographical mobility - Moved from abroad (%) - Other Race
Place of birth for the foreign-born population - Ireland (%)
Place of birth for the foreign-born population - Denmark (%)
Place of birth for the foreign-born population - Norway (%)
Place of birth for the foreign-born population - Sweden (%)
Place of birth for the foreign-born population - United Kingdom (%)
Place of birth for the foreign-born population - England (%)
Place of birth for the foreign-born population - Scotland (%)
Place of birth for the foreign-born population - Other Northern Europe (%)
Place of birth for the foreign-born population - Austria (%)
Place of birth for the foreign-born population - Belgium (%)
Place of birth for the foreign-born population - France (%)
Place of birth for the foreign-born population - Germany (%)
Place of birth for the foreign-born population - Netherlands (%)
Place of birth for the foreign-born population - Switzerland (%)
Place of birth for the foreign-born population - Other Western Europe (%)
Place of birth for the foreign-born population - Greece (%)
Place of birth for the foreign-born population - Italy (%)
Place of birth for the foreign-born population - Portugal (%)
Place of birth for the foreign-born population - Spain (%)
Place of birth for the foreign-born population - Other Southern Europe (%)
Place of birth for the foreign-born population - Albania (%)
Place of birth for the foreign-born population - Belarus (%)
Place of birth for the foreign-born population - Bosnia and Herzegovina (%)
Place of birth for the foreign-born population - Bulgaria (%)
Place of birth for the foreign-born population - Croatia (%)
Place of birth for the foreign-born population - Czechoslovakia (%)
Place of birth for the foreign-born population - Hungary (%)
Place of birth for the foreign-born population - Latvia (%)
Place of birth for the foreign-born population - Lithuania (%)
Place of birth for the foreign-born population - North Macedonia (Macedonia) (%)
Place of birth for the foreign-born population - Moldova (%)
Place of birth for the foreign-born population - Poland (%)
Place of birth for the foreign-born population - Romania (%)
Place of birth for the foreign-born population - Russia (%)
Place of birth for the foreign-born population - Serbia (%)
Place of birth for the foreign-born population - Ukraine (%)
Place of birth for the foreign-born population - Other Eastern Europe (%)
Place of birth for the foreign-born population - China (%)
Place of birth for the foreign-born population - Hong Kong (%)
Place of birth for the foreign-born population - Taiwan (%)
Place of birth for the foreign-born population - Japan (%)
Place of birth for the foreign-born population - Korea (%)
Place of birth for the foreign-born population - Other Eastern Asia (%)
Place of birth for the foreign-born population - Afghanistan (%)
Place of birth for the foreign-born population - Bangladesh (%)
Place of birth for the foreign-born population - India (%)
Place of birth for the foreign-born population - Iran (%)
Place of birth for the foreign-born population - Kazakhstan (%)
Place of birth for the foreign-born population - Nepal (%)
Place of birth for the foreign-born population - Pakistan (%)
Place of birth for the foreign-born population - Sri Lanka (%)
Place of birth for the foreign-born population - Uzbekistan (%)
Place of birth for the foreign-born population - Other South Central Asia (%)
Place of birth for the foreign-born population - Burma (%)
Place of birth for the foreign-born population - Cambodia (%)
Place of birth for the foreign-born population - Indonesia (%)
Place of birth for the foreign-born population - Laos (%)
Place of birth for the foreign-born population - Malaysia (%)
Place of birth for the foreign-born population - Philippines (%)
Place of birth for the foreign-born population - Singapore (%)
Place of birth for the foreign-born population - Thailand (%)
Place of birth for the foreign-born population - Vietnam (%)
Place of birth for the foreign-born population - Other South Eastern Asia (%)
Place of birth for the foreign-born population - Armenia (%)
Place of birth for the foreign-born population - Iraq (%)
Place of birth for the foreign-born population - Israel (%)
Place of birth for the foreign-born population - Jordan (%)
Place of birth for the foreign-born population - Kuwait (%)
Place of birth for the foreign-born population - Lebanon (%)
Place of birth for the foreign-born population - Saudi Arabia (%)
Place of birth for the foreign-born population - Syria (%)
Place of birth for the foreign-born population - Turkey (%)
Place of birth for the foreign-born population - Yemen (%)
Place of birth for the foreign-born population - Other Western Asia (%)
Place of birth for the foreign-born population - Eritrea (%)
Place of birth for the foreign-born population - Ethiopia (%)
Place of birth for the foreign-born population - Kenya (%)
Place of birth for the foreign-born population - Somalia (%)
Place of birth for the foreign-born population - Uganda (%)
Place of birth for the foreign-born population - Zimbabwe (%)
Place of birth for the foreign-born population - Other Eastern Africa (%)
Place of birth for the foreign-born population - Cameroon (%)
Place of birth for the foreign-born population - Congo (%)
Place of birth for the foreign-born population - Democratic Republic of Congo (Zaire) (%)
Place of birth for the foreign-born population - Other Middle Africa (%)
Place of birth for the foreign-born population - Egypt (%)
Place of birth for the foreign-born population - Morocco (%)
Place of birth for the foreign-born population - Sudan (%)
Place of birth for the foreign-born population - Other Northern Africa (%)
Place of birth for the foreign-born population - South Africa (%)
Place of birth for the foreign-born population - Other Southern Africa (%)
Place of birth for the foreign-born population - Cabo Verde (%)
Place of birth for the foreign-born population - Ghana (%)
Place of birth for the foreign-born population - Liberia (%)
Place of birth for the foreign-born population - Nigeria (%)
Place of birth for the foreign-born population - Senegal (%)
Place of birth for the foreign-born population - Sierra Leone (%)
Place of birth for the foreign-born population - Other Western Africa (%)
Place of birth for the foreign-born population - Australia (%)
Place of birth for the foreign-born population - New Zealand (%)
Place of birth for the foreign-born population - Fiji (%)
Place of birth for the foreign-born population - Micronesia (%)
Place of birth for the foreign-born population - Bahamas (%)
Place of birth for the foreign-born population - Barbados (%)
Place of birth for the foreign-born population - Cuba (%)
Place of birth for the foreign-born population - Dominica (%)
Place of birth for the foreign-born population - Dominican Republic (%)
Place of birth for the foreign-born population - Grenada (%)
Place of birth for the foreign-born population - Haiti (%)
Place of birth for the foreign-born population - Jamaica (%)
Place of birth for the foreign-born population - St. Vincent and the Grenadines (%)
Place of birth for the foreign-born population - Trinidad and Tobago (%)
Place of birth for the foreign-born population - West Indies (%)
Place of birth for the foreign-born population - Other Caribbean (%)
Place of birth for the foreign-born population - Belize (%)
Place of birth for the foreign-born population - Costa Rica (%)
Place of birth for the foreign-born population - El Salvador (%)
Place of birth for the foreign-born population - Guatemala (%)
Place of birth for the foreign-born population - Honduras (%)
Place of birth for the foreign-born population - Mexico (%)
Place of birth for the foreign-born population - Nicaragua (%)
Place of birth for the foreign-born population - Panama (%)
Place of birth for the foreign-born population - Other Central America (%)
Place of birth for the foreign-born population - Argentina (%)
Place of birth for the foreign-born population - Bolivia (%)
Place of birth for the foreign-born population - Brazil (%)
Place of birth for the foreign-born population - Chile (%)
Place of birth for the foreign-born population - Colombia (%)
Place of birth for the foreign-born population - Ecuador (%)
Place of birth for the foreign-born population - Guyana (%)
Place of birth for the foreign-born population - Peru (%)
Place of birth for the foreign-born population - Uruguay (%)
Place of birth for the foreign-born population - Venezuela (%)
Place of birth for the foreign-born population - Other South America (%)
Place of birth for the foreign-born population - Canada (%)
Place of birth for the foreign-born population - Other Northern America (%)
Place of birth for the foreign-born population - Other (%)
Latest news about races in Eugene, OR collected exclusively by city-data.com from local newspapers, TV, and radio stations
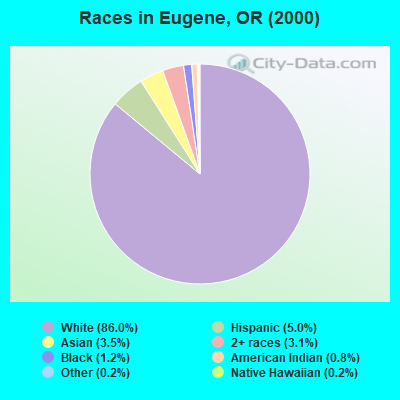
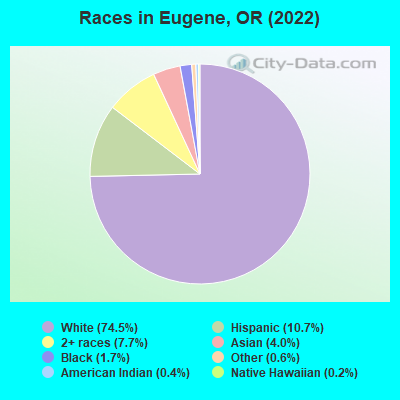
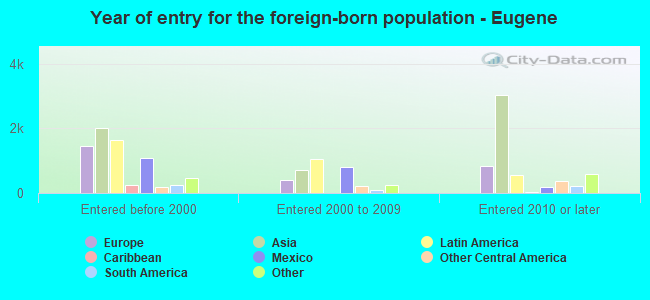
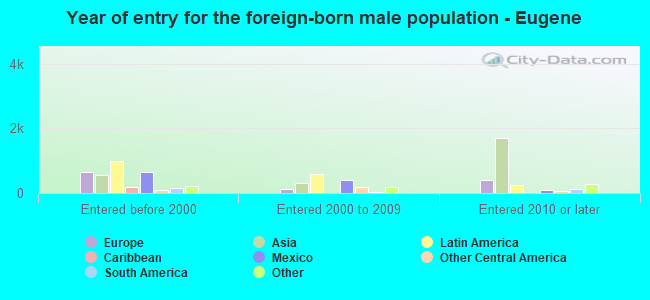
According to 2022 data, the most numerous races in Eugene, OR are White alone (132,612 residents), Hispanic (19,057 residents), and Two or more races (13,738 residents). 89.5% of Eugene residents speak English at home. 7.0% of Eugene, OR residents are foreign-born (2.8% born in Asia, 2.0% born in Latin America, 1.2% born in Europe), which is 28.8% less than the foreign-born rate of 9.0% across the entire state of Oregon.
Race distribution in Eugene
2000 2022
118,563 86.0% White alone 6,843 5.0% Hispanic 4,872 3.5% Asian alone 4,257 3.1% Two or more races 1,644 1.2% Black alone 1,115 0.8% American Indian alone 315 0.2% Other race alone 284 0.2% Native Hawaiian and Other
132,612 74.5% White alone 19,057 10.7% Hispanic 13,738 7.7% Two or more races 7,083 4.0% Asian alone 3,091 1.7% Black alone 1,140 0.6% Other race alone 800 0.4% American Indian alone 409 0.2% Native Hawaiian and Other
2000 2022
2,857,616 83.5% White alone 275,314 8.0% Hispanic 100,333 2.9% Asian alone 82,733 2.4% Two or more races 53,325 1.6% Black alone 40,130 1.2% American Indian alone 7,398 0.2% Native Hawaiian and Other 4,550 0.1% Other race alone
3,037,571 71.6% White alone 609,538 14.4% Hispanic 252,744 6.0% Two or more races 191,283 4.5% Asian alone 78,228 1.8% Black alone 29,399 0.7% American Indian alone 25,731 0.6% Other race alone 15,643 0.4% Native Hawaiian and Other
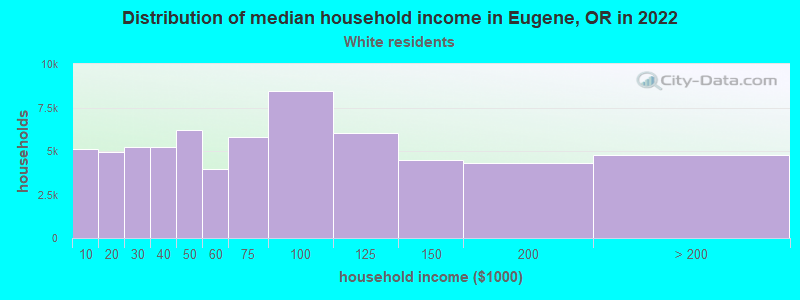
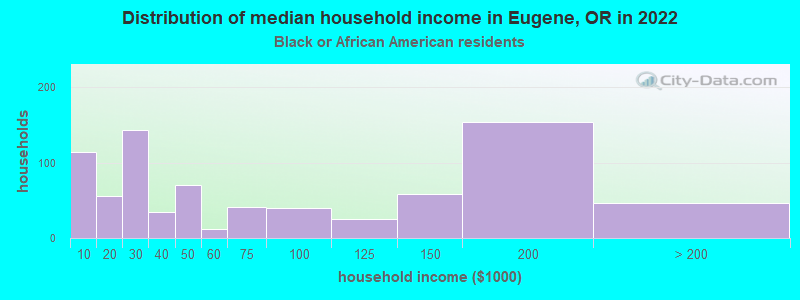
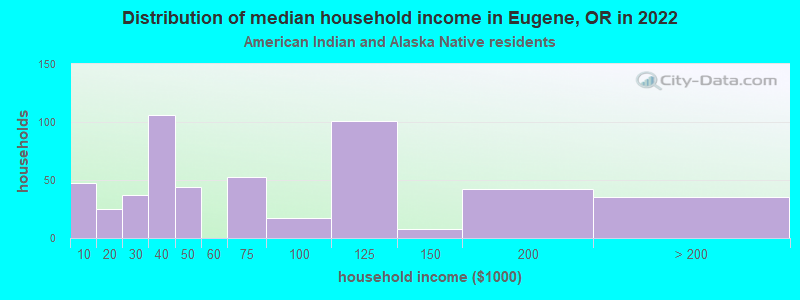
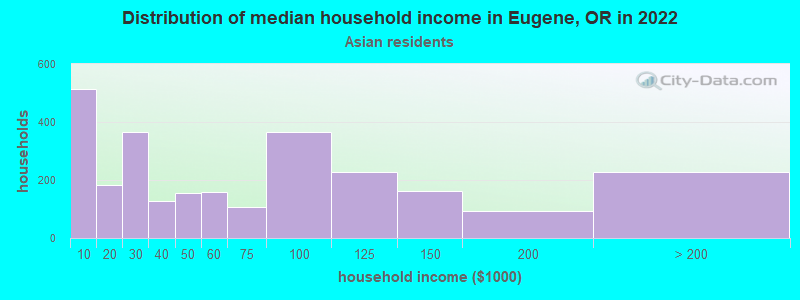
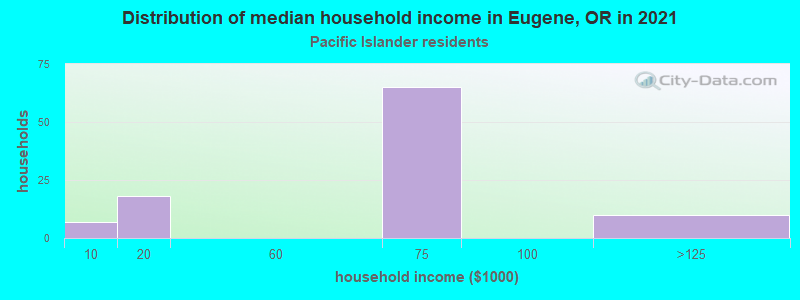
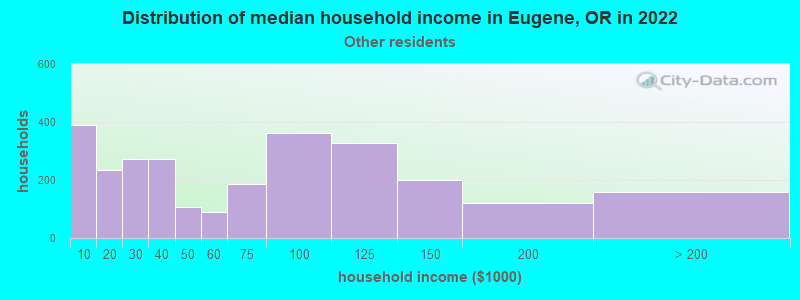
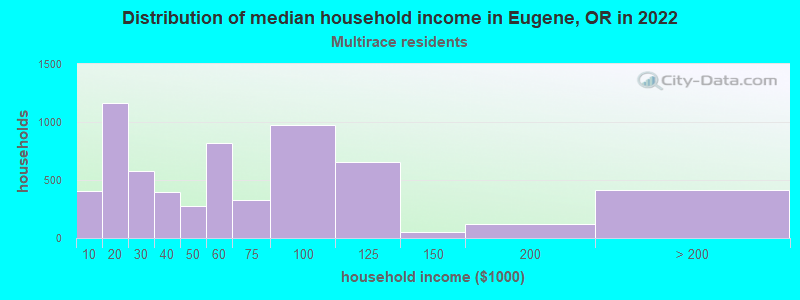
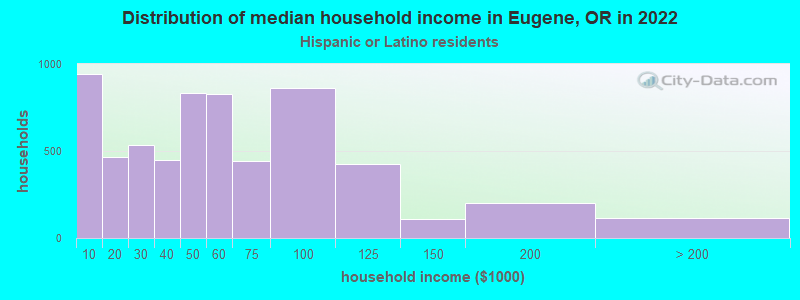
Income and house value in Eugene Median household income in 2022 $66,747 White non-Hispanic householders$43,432 Black householders$57,452 American Indian and Alaska Native householders$47,898 Asian householders$65,021 Some other race householders$52,163 Two or more races householders$48,890 Hispanic or Latino race householdersMedian 2022 house value $490,329 White Non-Hispanic householders$515,038 Black or African American householders$438,986 American Indian or Alaska Native householders $470,755 Asian householders$355,553 Native Hawaiian and other Pacific Islander householders$398,553 Some other race householders$459,523 Two or more races householders$445,404 Hispanic or Latino householders
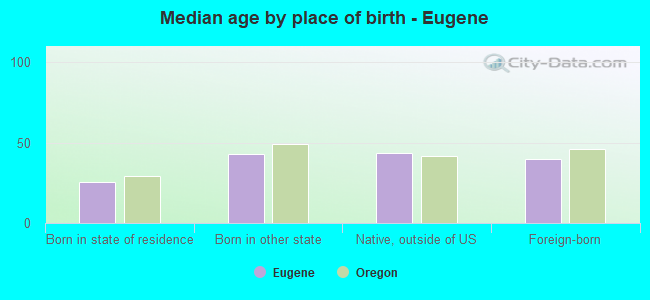
Median age by race in Eugene
39.5 Median age for White residents37.3 41.5 23.0 Median age for Black or African American residents34.1 18.9 41.1 Median age for American Indian / Alaska Native residents50.5 35.3 27.9 Median age for Asian residents27.4 31.1 25.3 Median age for Native Hawaiian / Pacific Islander residents-666,666,666.0 -666,666,666.0 23.0 Median age for Other race residents21.8 27.7 22.7 Median age for Two or more races residents21.8 24.4 40.3 Median age for White alone residents38.6 42.1 24.7 Median age for Hispanic or Latino residents22.6 26.8
Owner/renter occupied households by race in Eugene
House owners and renters - White residents 32,983 51.0% Owner occupied31,701 49.0% Renter occupiedHouse owners and renters - Black or African American residents 221 28.8% Owner occupied547 71.2% Renter occupiedHouse owners and renters - American Indian / Alaska Native residents 215 29.7% Owner occupied509 70.3% Renter occupiedHouse owners and renters - Asian residents 981 32.2% Owner occupied2,069 67.8% Renter occupiedHouse owners and renters - Native Hawaiian / Pacific Islander residents 145 100.0% Renter occupiedHouse owners and renters - Other race residents 373 30.1% Owner occupied868 69.9% Renter occupiedHouse owners and renters - Two or more races residents 2,129 34.4% Owner occupied4,060 65.6% Renter occupiedHouse owners and renters - White alone residents 32,257 52.0% Owner occupied29,803 48.0% Renter occupiedHouse owners and renters - Hispanic or Latino residents 1,746 28.1% Owner occupied4,471 71.9% Renter occupied
Language usage in Eugene
English speakers - Total 89.5% of residents of Eugene speak English at home.
4.2% of residents speak Spanish at home 6,280 86.8% Speak English very well953 13.2% Speak English less than very well6.3% of residents speak other language at home 8,559 79.6% Speak English very well2,192 20.4% Speak English less than very well
English speakers - Born in the United States 93.9% of residents of Eugene speak English at home.
3.1% of residents speak Spanish at home 2,469 87.6% Speak English very well351 12.4% Speak English less than very well3.1% of residents speak other language at home 2,668 94.9% Speak English very well143 5.1% Speak English less than very well
English speakers - Native, born elsewhere 76.0% of residents of Eugene speak English at home.
7.2% of residents speak Spanish at home 210 100.0% Speak English very well16.7% of residents speak other language at home 485 100.0% Speak English very well
English speakers - Foreign-born 31.1% of residents of Eugene speak English at home.
14.1% of residents speak Spanish at home 1,358 86.5% Speak English very well212 13.5% Speak English less than very well54.8% of residents speak other language at home 4,071 66.5% Speak English very well2,049 33.5% Speak English less than very well
White (Caucasian) - Speak only English Native:
95.8% (124,865)Foreign-born:
40.8% (1,640)
White (Caucasian) - Speak another language Native:
4.2% (5,455)Foreign-born:
59.2% (2,376)
Black or African American - Speak only English Native:
99.5% (2,184)Foreign-born:
18.9% (90)
American Indian / Alaska Native - Speak another language Native:
22.9% (238)Foreign-born:
100.0% (185)
Asian - Speak only English Native:
70.1% (1,514)Foreign-born:
25.7% (1,202)
Asian - Speak another language Native:
29.9% (647)Foreign-born:
74.3% (3,470)
Native Hawaiian / Pacific Islander - Speak only English Native:
57.7% (256)Foreign-born:
14.0% (8)
Native Hawaiian / Pacific Islander - Speak another language Native:
43.0% (190)Foreign-born:
87.1% (49)
Other race - Speak another language Native:
33.5% (1,283)Foreign-born:
100.0% (460)
Two or more races - Speak only English Native:
87.9% (16,942)Foreign-born:
43.2% (612)
Two or more races - Speak another language Native:
12.1% (2,328)Foreign-born:
56.8% (806)
White alone - Speak only English Native:
96.7% (120,647)Foreign-born:
44.7% (1,640)
White alone - Speak another language Native:
3.3% (4,057)Foreign-born:
55.3% (2,025)
Hispanic or Latino - Speak only English Native:
71.9% (11,542)Foreign-born:
6.3% (105)
Hispanic or Latino - Speak another language Native:
28.1% (4,507)Foreign-born:
93.7% (1,570)
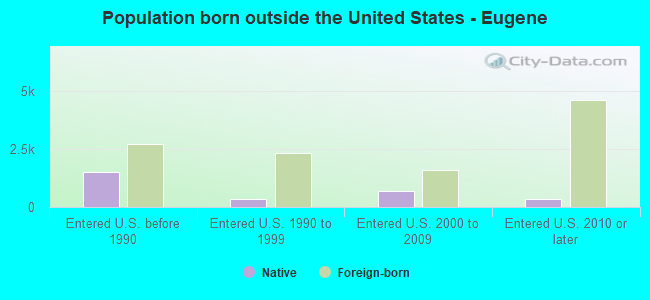
Foreign-born residents in Eugene 12,354 residents are foreign born (2.8% Asia , 2.0% Latin America , 1.2% Europe ).
This city:
7.0%Oregon:
9.8%
Marital status for residents in Eugene Marital status - White (Caucasian) population 15 years and over
Males 45.0% Never married39.0% Now married1.7% Separated2.3% Widowed12.2% DivorcedFemales 38.9% Never married33.1% Now married1.8% Separated9.4% Widowed16.7% DivorcedWomen who gave birth in the past 12 months Now married:
88.1% (634)Unmarried:
11.9% (86)
Women who did not give birth in the past 12 months Now married:
26.7% (10,076)Unmarried:
73.3% (27,700)
Marital status - Black or African American population 15 years and over
Males 64.9% Never married28.9% Now married0.0% Separated0.5% Widowed5.7% DivorcedFemales 55.7% Never married30.9% Now married3.1% Separated0.8% Widowed9.4% DivorcedWomen who did not give birth in the past 12 months Now married:
34.5% (276)Unmarried:
65.5% (522)
Marital status - American Indian / Alaska Native population 15 years and over
Males 38.2% Never married36.0% Now married0.0% Separated0.0% Widowed25.8% DivorcedFemales 64.6% Never married26.7% Now married0.0% Separated4.3% Widowed4.3% DivorcedWomen who gave birth in the past 12 months Now married:
100.0% (13)Unmarried:
0.0% (0)
Women who did not give birth in the past 12 months Now married:
15.1% (54)Unmarried:
84.9% (302)
Marital status - Asian population 15 years and over
Males 66.8% Never married29.4% Now married1.4% Separated0.0% Widowed2.4% DivorcedFemales 50.7% Never married41.5% Now married0.0% Separated2.2% Widowed5.6% DivorcedWomen who gave birth in the past 12 months Now married:
88.4% (87)Unmarried:
11.6% (11)
Women who did not give birth in the past 12 months Now married:
33.0% (969)Unmarried:
67.0% (1,963)
Marital status - Native Hawaiian / Pacific Islander population 15 years and over
Males 66.5% Never married32.6% Now married0.0% Separated0.9% Widowed0.0% DivorcedFemales 46.6% Never married41.9% Now married0.9% Separated4.3% Widowed6.4% DivorcedWomen who did not give birth in the past 12 months Now married:
11.4% (17)Unmarried:
88.6% (131)
Marital status - Other race population 15 years and over
Males 56.7% Never married32.3% Now married2.2% Separated5.1% Widowed3.6% DivorcedFemales 56.1% Never married28.8% Now married1.6% Separated3.0% Widowed10.5% DivorcedWomen who gave birth in the past 12 months Now married:
0.0% (0)Unmarried:
100.0% (8)
Women who did not give birth in the past 12 months Now married:
25.3% (352)Unmarried:
74.7% (1,041)
Marital status - Two or more races population 15 years and over
Males 61.0% Never married25.6% Now married2.3% Separated3.6% Widowed7.5% DivorcedFemales 60.2% Never married21.7% Now married1.3% Separated2.3% Widowed14.5% DivorcedWomen who gave birth in the past 12 months Now married:
23.9% (38)Unmarried:
76.1% (121)
Women who did not give birth in the past 12 months Now married:
18.4% (1,258)Unmarried:
81.6% (5,575)
Marital status - White alone, not Hispanic / Latino population 15 years and over
Males 43.6% Never married39.7% Now married1.7% Separated2.3% Widowed12.7% DivorcedFemales 37.8% Never married33.7% Now married1.9% Separated9.8% Widowed16.7% DivorcedWomen who gave birth in the past 12 months Now married:
87.2% (584)Unmarried:
12.8% (86)
Women who did not give birth in the past 12 months Now married:
27.6% (9,817)Unmarried:
72.4% (25,751)
Marital status - Hispanic or Latino population 15 years and over
Males 69.0% Never married25.2% Now married0.0% Separated0.7% Widowed5.1% DivorcedFemales 57.7% Never married24.6% Now married1.3% Separated3.2% Widowed13.2% DivorcedWomen who gave birth in the past 12 months Now married:
50.3% (88)Unmarried:
49.7% (87)
Women who did not give birth in the past 12 months Now married:
23.1% (1,528)Unmarried:
76.9% (5,093)
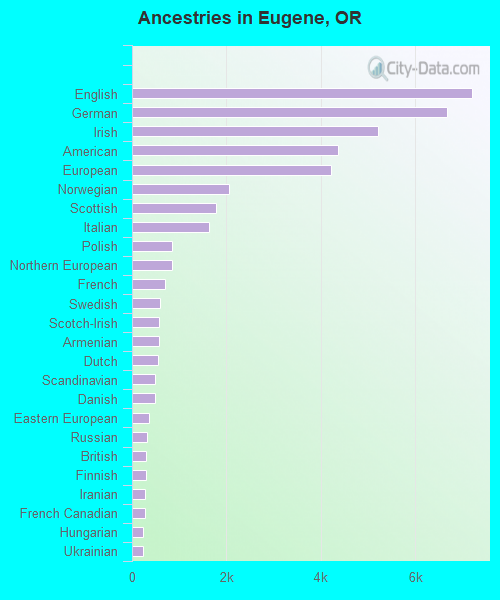
Ancestries in Eugene
7,198 10.9% English6,679 10.1% German5,213 7.9% Irish4,369 6.6% American4,210 6.4% European2,049 3.1% Norwegian1,778 2.7% Scottish1,624 2.5% Italian853 1.3% Polish848 1.3% Northern European697 1.1% French601 0.9% Swedish577 0.9% Scotch-Irish563 0.9% Armenian545 0.8% Dutch484 0.7% Scandinavian481 0.7% Danish367 0.6% Eastern European312 0.5% Russian302 0.5% British290 0.4% Finnish276 0.4% Iranian270 0.4% French Canadian241 0.4% Hungarian225 0.3% Ukrainian204 0.3% Portuguese184 0.3% Czech184 0.3% Welsh145 0.2% Romanian134 0.2% Austrian133 0.2% Swiss131 0.2% Ghanaian120 0.2% Croatian111 0.2% Greek102 0.2% Jordanian101 0.2% Icelander91 0.1% Israeli79 0.1% Canadian76 0.1% West Indian71 0.1% Afghan60 0.09% African56 0.08% Australian54 0.08% Alsatian48 0.07% Belgian48 0.07% Basque47 0.07% Arab42 0.06% Ugandan41 0.06% Estonian32 0.05% Serbian29 0.04% Palestinian25 0.04% Turkish25 0.04% Latvian24 0.04% Slavic23 0.03% Pennsylvania German21 0.03% German Russian20 0.03% New Zealander18 0.03% Lebanese18 0.03% Nigerian18 0.03% Belizean12 0.02% Jamaican11 0.02% Cajun9 0.01% Brazilian8 0.01% Bulgarian6 0.01% Czechoslovakian5 0.01% Slovak5 0.01% Kenyan4 0.01% Slovene4 0.01% Haitian
Geographical mobility in Eugene Same house 1 year ago 107,093 77.7% White (Caucasian)2,307 65.0% Black or African American955 77.9% American Indian / Alaska Native4,832 67.3% Asian291 59.1% Native Hawaiian / Pacific Islander5,385 68.6% Other race16,194 72.9% Two or more races102,586 78.0% White alone, not Hispanic / Latino13,615 71.4% Hispanic or LatinoMoved within same county 15,447 11.2% White / Caucasian463 13.1% Black or African American61 4.9% American Indian / Alaska Native478 6.7% Asian33 6.7% Native Hawaiian / Pacific Islander1,322 16.8% Other race3,362 15.1% Two or more races14,395 10.9% White alone, not Hispanic / Latino3,515 18.4% Hispanic or LatinoMoved within same state 5,127 3.7% White / Caucasian344 9.7% Black or African American143 11.6% American Indian / Alaska Native923 12.9% Asian355 4.5% Other race1,240 5.6% Two or more races4,721 3.6% White alone, not Hispanic / Latino988 5.2% Hispanic or LatinoMoved from different state 9,542 6.9% White / Caucasian433 12.2% Black or African American81 6.6% American Indian / Alaska Native355 4.9% Asian71 14.4% Native Hawaiian / Pacific Islander488 6.2% Other race1,317 5.9% Two or more races9,237 7.0% White alone, not Hispanic / Latino939 4.9% Hispanic or LatinoMoved from abroad 613 0.4% White588 8.2% Asian97 0.4% Two or more races613 0.5% White alone, not Hispanic / Latino
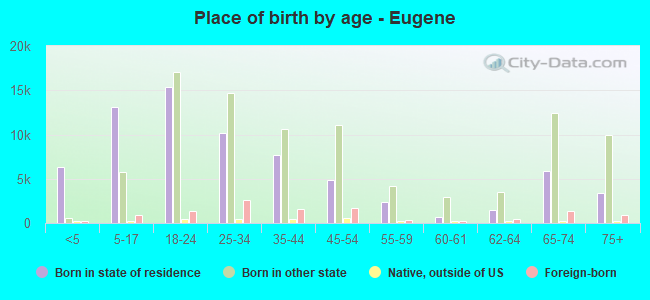
Children Nativity (place of birth) in Eugene
Children under 6 years - Living with two parents Both parents native 3,667 100.0% NativeBoth parents foreign-born 1,051 90.9% Native105 9.1% Foreign-bornOne native, one foreign-born parent 454 100.0% NativeChildren under 6 years - Living with one parent Native parent 1,937 98.4% Native32 1.6% Foreign-bornForeign-born parent 179 100.0% NativeChildren 6 to 17 years - Living with two parents Both parents native 10,048 99.4% Native60 0.6% Foreign-bornBoth parents foreign-born 719 64.5% Native395 35.5% Foreign-bornOne native, one foreign-born parent 1,935 96.9% Native63 3.1% Foreign-bornChildren 6 to 17 years - Living with one parent Native parent 4,760 100.0% NativeForeign-born parent 597 49.8% Native601 50.2% Foreign-born
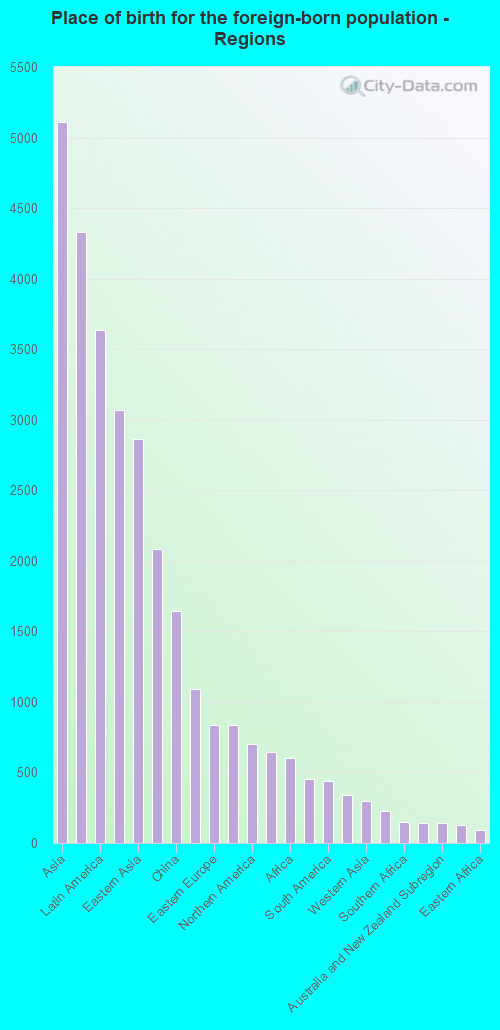
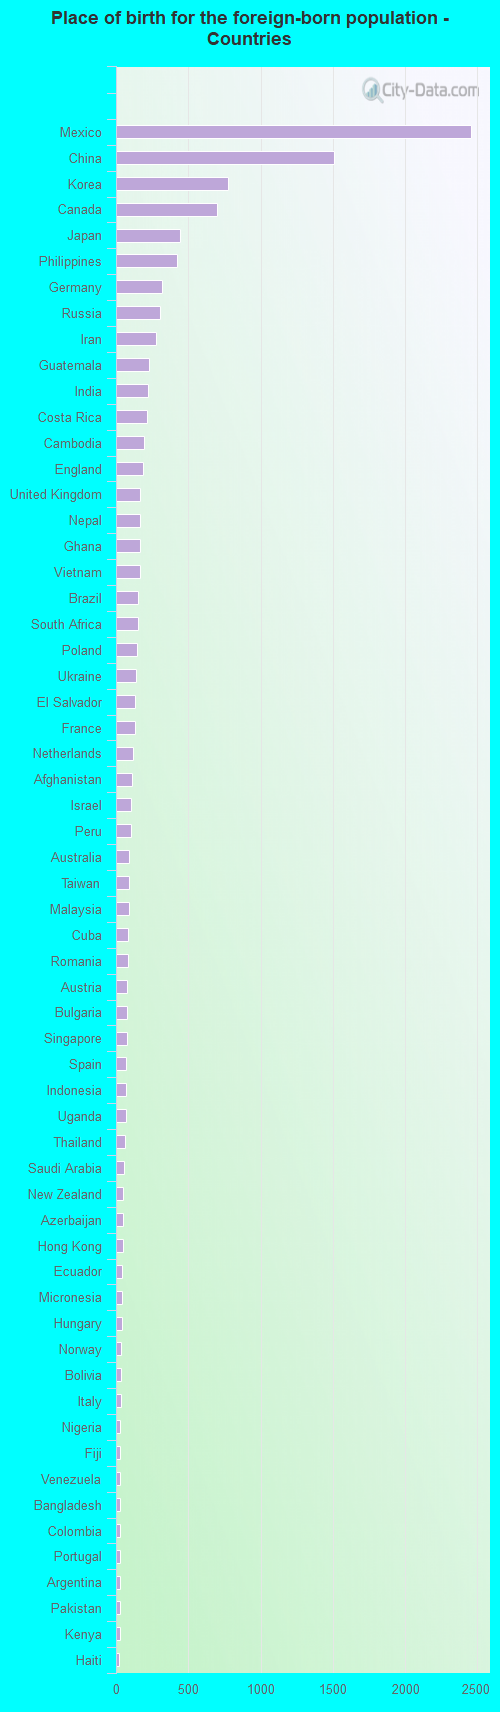
Place of birth for residents in Eugene 5,111 Asia4,333 Americas3,633 Latin America3,069 Central America2,863 Eastern Asia2,083 Europe1,643 China1,094 South Eastern Asia835 Eastern Europe834 South Central Asia699 Northern America647 Western Europe599 Africa456 Northern Europe436 South America337 Western Africa296 Western Asia226 Oceania149 Southern Africa143 Southern Europe142 Australia and New Zealand Subregion128 Caribbean95 Eastern Africa9 Northern Africa7 Middle Africa2,457 Mexico1,509 China774 Korea699 Canada445 Japan425 Philippines317 Germany301 Russia279 Iran227 Guatemala222 India216 Costa Rica191 Cambodia185 England166 United Kingdom165 Nepal164 Ghana163 Vietnam151 Brazil149 South Africa146 Poland140 Ukraine133 El Salvador128 France117 Netherlands111 Afghanistan104 Israel102 Peru90 Australia87 Taiwan87 Malaysia85 Cuba82 Romania77 Austria76 Bulgaria73 Singapore69 Spain68 Indonesia68 Uganda60 Thailand54 Saudi Arabia51 New Zealand47 Azerbaijan45 Hong Kong42 Ecuador41 Micronesia41 Hungary38 Norway36 Bolivia35 Italy31 Nigeria31 Fiji30 Venezuela29 Bangladesh29 Colombia29 Portugal28 Argentina27 Pakistan27 Kenya23 Haiti22 Serbia21 Burma (Myanmar)21 Kuwait18 Belize18 Lebanon17 Georgia16 Jordan16 Panama14 Scotland14 Denmark13 Uruguay12 Jamaica11 Iraq9 Sweden9 Azores Islands9 Greece7 Dominica7 Switzerland5 Turkey4 Laos3 Czechoslovakia
Grandparents responsible for own grandchildren in Eugene
Grandparents (30 to 59 years) White / Caucasian 235 64.0% Responsible for grandchildren132 36.0% Not responsible for grandchildrenBlack or African American 47 100.0% Responsible for grandchildrenAsian 18 100.0% Not responsible for grandchildrenOther race 12 100.0% Responsible for grandchildrenTwo or more races 37 81.9% Responsible for grandchildren8 18.1% Not responsible for grandchildrenWhite alone, not Hispanic / Latino 221 61.5% Responsible for grandchildren138 38.5% Not responsible for grandchildrenHispanic or Latino 33 100.0% Responsible for grandchildrenGrandparents (60 years and over) White / Caucasian 175 24.8% Responsible for grandchildren530 75.2% Not responsible for grandchildrenAsian 3 100.0% Not responsible for grandchildrenOther race 15 100.0% Not responsible for grandchildrenTwo or more races 33 34.3% Responsible for grandchildren63 65.7% Not responsible for grandchildrenWhite alone, not Hispanic / Latino 188 26.2% Responsible for grandchildren530 73.8% Not responsible for grandchildrenHispanic or Latino 4 24.6% Responsible for grandchildren13 75.4% Not responsible for grandchildren