Races in Euless, Texas (TX) Detailed Stats
Data:
Races - White alone (%)
Races - White alone (% change since 2000)
Races - Black alone (%)
Races - Black alone (% change since 2000)
Races - American Indian alone (%)
Races - American Indian alone (% change since 2000)
Races - Asian alone (%)
Races - Asian alone (% change since 2000)
Races - Hispanic (%)
Races - Hispanic (% change since 2000)
Races - Native Hawaiian and Other Pacific Islander alone (%)
Races - Native Hawaiian and Other Pacific Islander alone (% change since 2000)
Races - Two or more races(%)
Races - Two or more races(% change since 2000)
Races - Other race alone (%)
Races - Other race alone (% change since 2000)
Racial diversity
Place of birth - Born in state of residence (%)
Place of birth - Born in state of residence (%) - White
Place of birth - Born in state of residence (%) - Black or African American
Place of birth - Born in state of residence (%) - Asian
Place of birth - Born in state of residence (%) - Hispanic or Latino
Place of birth - Born in state of residence (%) - American Indian and Alaska Native
Place of birth - Born in state of residence (%) - Multirace
Place of birth - Born in state of residence (%) - Other Race
Place of birth - Born in other state (%)
Place of birth - Born in other state (%) - White
Place of birth - Born in other state (%) - Black or African American
Place of birth - Born in other state (%) - Asian
Place of birth - Born in other state (%) - Hispanic or Latino
Place of birth - Born in other state (%) - American Indian and Alaska Native
Place of birth - Born in other state (%) - Multirace
Place of birth - Born in other state (%) - Other Race
Place of birth - Native, outside of US (%)
Place of birth - Native, outside of US (%) - White
Place of birth - Native, outside of US (%) - Black or African American
Place of birth - Native, outside of US (%) - Asian
Place of birth - Native, outside of US (%) - Hispanic or Latino
Place of birth - Native, outside of US (%) - American Indian and Alaska Native
Place of birth - Native, outside of US (%) - Multirace
Place of birth - Native, outside of US (%) - Other Race
Place of birth - Foreign born (%)
Place of birth - Foreign born (%) - White
Place of birth - Foreign born (%) - Black or African American
Place of birth - Foreign born (%) - Asian
Place of birth - Foreign born (%) - Hispanic or Latino
Place of birth - Foreign born (%) - American Indian and Alaska Native
Place of birth - Foreign born (%) - Multirace
Place of birth - Foreign born (%) - Other Race
Residents speaking English at home (%)
Residents speaking English at home - Born in the United States (%)
Residents speaking English at home - Native, born elsewhere (%)
Residents speaking English at home - Foreign born (%)
Residents speaking Spanish at home (%)
Residents speaking Spanish at home - Born in the United States (%)
Residents speaking Spanish at home - Native, born elsewhere (%)
Residents speaking Spanish at home - Foreign born (%)
Residents speaking other language at home (%)
Residents speaking other language at home - Born in the United States (%)
Residents speaking other language at home - Native, born elsewhere (%)
Residents speaking other language at home - Foreign born (%)
Marital status - Never married (%)
Marital status - Now married (%)
Marital status - Separated (%)
Marital status - Widowed (%)
Marital status - Divorced (%)
Ancestries Reported - Arab (%)
Ancestries Reported - Czech (%)
Ancestries Reported - Danish (%)
Ancestries Reported - Dutch (%)
Ancestries Reported - English (%)
Ancestries Reported - French (%)
Ancestries Reported - French Canadian (%)
Ancestries Reported - German (%)
Ancestries Reported - Greek (%)
Ancestries Reported - Hungarian (%)
Ancestries Reported - Irish (%)
Ancestries Reported - Italian (%)
Ancestries Reported - Lithuanian (%)
Ancestries Reported - Norwegian (%)
Ancestries Reported - Polish (%)
Ancestries Reported - Portuguese (%)
Ancestries Reported - Russian (%)
Ancestries Reported - Scotch-Irish (%)
Ancestries Reported - Scottish (%)
Ancestries Reported - Slovak (%)
Ancestries Reported - Subsaharan African (%)
Ancestries Reported - Swedish (%)
Ancestries Reported - Swiss (%)
Ancestries Reported - Ukrainian (%)
Ancestries Reported - United States (%)
Ancestries Reported - Welsh (%)
Ancestries Reported - West Indian (%)
Ancestries Reported - Other (%)
Geographical mobility - Same house 1 year ago (%)
Geographical mobility - Same house 1 year ago (%) - White
Geographical mobility - Same house 1 year ago (%) - Black or African American
Geographical mobility - Same house 1 year ago (%) - Asian
Geographical mobility - Same house 1 year ago (%) - Hispanic or Latino
Geographical mobility - Same house 1 year ago (%) - American Indian and Alaska Native
Geographical mobility - Same house 1 year ago (%) - Multirace
Geographical mobility - Same house 1 year ago (%) - Other Race
Geographical mobility - Moved within same county (%)
Geographical mobility - Moved within same county (%) - White
Geographical mobility - Moved within same county (%) - Black or African American
Geographical mobility - Moved within same county (%) - Asian
Geographical mobility - Moved within same county (%) - Hispanic or Latino
Geographical mobility - Moved within same county (%) - American Indian and Alaska Native
Geographical mobility - Moved within same county (%) - Multirace
Geographical mobility - Moved within same county (%) - Other Race
Geographical mobility - Moved from different county within same state (%)
Geographical mobility - Moved from different county within same state (%) - White
Geographical mobility - Moved from different county within same state (%) - Black or African American
Geographical mobility - Moved from different county within same state (%) - Asian
Geographical mobility - Moved from different county within same state (%) - Hispanic or Latino
Geographical mobility - Moved from different county within same state (%) - American Indian and Alaska Native
Geographical mobility - Moved from different county within same state (%) - Multirace
Geographical mobility - Moved from different county within same state (%) - Other Race
Geographical mobility - Moved from different state (%)
Geographical mobility - Moved from different state (%) - White
Geographical mobility - Moved from different state (%) - Black or African American
Geographical mobility - Moved from different state (%) - Asian
Geographical mobility - Moved from different state (%) - Hispanic or Latino
Geographical mobility - Moved from different state (%) - American Indian and Alaska Native
Geographical mobility - Moved from different state (%) - Multirace
Geographical mobility - Moved from different state (%) - Other Race
Geographical mobility - Moved from abroad (%)
Geographical mobility - Moved from abroad (%) - White
Geographical mobility - Moved from abroad (%) - Black or African American
Geographical mobility - Moved from abroad (%) - Asian
Geographical mobility - Moved from abroad (%) - Hispanic or Latino
Geographical mobility - Moved from abroad (%) - American Indian and Alaska Native
Geographical mobility - Moved from abroad (%) - Multirace
Geographical mobility - Moved from abroad (%) - Other Race
Place of birth for the foreign-born population - Ireland (%)
Place of birth for the foreign-born population - Denmark (%)
Place of birth for the foreign-born population - Norway (%)
Place of birth for the foreign-born population - Sweden (%)
Place of birth for the foreign-born population - United Kingdom (%)
Place of birth for the foreign-born population - England (%)
Place of birth for the foreign-born population - Scotland (%)
Place of birth for the foreign-born population - Other Northern Europe (%)
Place of birth for the foreign-born population - Austria (%)
Place of birth for the foreign-born population - Belgium (%)
Place of birth for the foreign-born population - France (%)
Place of birth for the foreign-born population - Germany (%)
Place of birth for the foreign-born population - Netherlands (%)
Place of birth for the foreign-born population - Switzerland (%)
Place of birth for the foreign-born population - Other Western Europe (%)
Place of birth for the foreign-born population - Greece (%)
Place of birth for the foreign-born population - Italy (%)
Place of birth for the foreign-born population - Portugal (%)
Place of birth for the foreign-born population - Spain (%)
Place of birth for the foreign-born population - Other Southern Europe (%)
Place of birth for the foreign-born population - Albania (%)
Place of birth for the foreign-born population - Belarus (%)
Place of birth for the foreign-born population - Bosnia and Herzegovina (%)
Place of birth for the foreign-born population - Bulgaria (%)
Place of birth for the foreign-born population - Croatia (%)
Place of birth for the foreign-born population - Czechoslovakia (%)
Place of birth for the foreign-born population - Hungary (%)
Place of birth for the foreign-born population - Latvia (%)
Place of birth for the foreign-born population - Lithuania (%)
Place of birth for the foreign-born population - North Macedonia (Macedonia) (%)
Place of birth for the foreign-born population - Moldova (%)
Place of birth for the foreign-born population - Poland (%)
Place of birth for the foreign-born population - Romania (%)
Place of birth for the foreign-born population - Russia (%)
Place of birth for the foreign-born population - Serbia (%)
Place of birth for the foreign-born population - Ukraine (%)
Place of birth for the foreign-born population - Other Eastern Europe (%)
Place of birth for the foreign-born population - China (%)
Place of birth for the foreign-born population - Hong Kong (%)
Place of birth for the foreign-born population - Taiwan (%)
Place of birth for the foreign-born population - Japan (%)
Place of birth for the foreign-born population - Korea (%)
Place of birth for the foreign-born population - Other Eastern Asia (%)
Place of birth for the foreign-born population - Afghanistan (%)
Place of birth for the foreign-born population - Bangladesh (%)
Place of birth for the foreign-born population - India (%)
Place of birth for the foreign-born population - Iran (%)
Place of birth for the foreign-born population - Kazakhstan (%)
Place of birth for the foreign-born population - Nepal (%)
Place of birth for the foreign-born population - Pakistan (%)
Place of birth for the foreign-born population - Sri Lanka (%)
Place of birth for the foreign-born population - Uzbekistan (%)
Place of birth for the foreign-born population - Other South Central Asia (%)
Place of birth for the foreign-born population - Burma (%)
Place of birth for the foreign-born population - Cambodia (%)
Place of birth for the foreign-born population - Indonesia (%)
Place of birth for the foreign-born population - Laos (%)
Place of birth for the foreign-born population - Malaysia (%)
Place of birth for the foreign-born population - Philippines (%)
Place of birth for the foreign-born population - Singapore (%)
Place of birth for the foreign-born population - Thailand (%)
Place of birth for the foreign-born population - Vietnam (%)
Place of birth for the foreign-born population - Other South Eastern Asia (%)
Place of birth for the foreign-born population - Armenia (%)
Place of birth for the foreign-born population - Iraq (%)
Place of birth for the foreign-born population - Israel (%)
Place of birth for the foreign-born population - Jordan (%)
Place of birth for the foreign-born population - Kuwait (%)
Place of birth for the foreign-born population - Lebanon (%)
Place of birth for the foreign-born population - Saudi Arabia (%)
Place of birth for the foreign-born population - Syria (%)
Place of birth for the foreign-born population - Turkey (%)
Place of birth for the foreign-born population - Yemen (%)
Place of birth for the foreign-born population - Other Western Asia (%)
Place of birth for the foreign-born population - Eritrea (%)
Place of birth for the foreign-born population - Ethiopia (%)
Place of birth for the foreign-born population - Kenya (%)
Place of birth for the foreign-born population - Somalia (%)
Place of birth for the foreign-born population - Uganda (%)
Place of birth for the foreign-born population - Zimbabwe (%)
Place of birth for the foreign-born population - Other Eastern Africa (%)
Place of birth for the foreign-born population - Cameroon (%)
Place of birth for the foreign-born population - Congo (%)
Place of birth for the foreign-born population - Democratic Republic of Congo (Zaire) (%)
Place of birth for the foreign-born population - Other Middle Africa (%)
Place of birth for the foreign-born population - Egypt (%)
Place of birth for the foreign-born population - Morocco (%)
Place of birth for the foreign-born population - Sudan (%)
Place of birth for the foreign-born population - Other Northern Africa (%)
Place of birth for the foreign-born population - South Africa (%)
Place of birth for the foreign-born population - Other Southern Africa (%)
Place of birth for the foreign-born population - Cabo Verde (%)
Place of birth for the foreign-born population - Ghana (%)
Place of birth for the foreign-born population - Liberia (%)
Place of birth for the foreign-born population - Nigeria (%)
Place of birth for the foreign-born population - Senegal (%)
Place of birth for the foreign-born population - Sierra Leone (%)
Place of birth for the foreign-born population - Other Western Africa (%)
Place of birth for the foreign-born population - Australia (%)
Place of birth for the foreign-born population - New Zealand (%)
Place of birth for the foreign-born population - Fiji (%)
Place of birth for the foreign-born population - Micronesia (%)
Place of birth for the foreign-born population - Bahamas (%)
Place of birth for the foreign-born population - Barbados (%)
Place of birth for the foreign-born population - Cuba (%)
Place of birth for the foreign-born population - Dominica (%)
Place of birth for the foreign-born population - Dominican Republic (%)
Place of birth for the foreign-born population - Grenada (%)
Place of birth for the foreign-born population - Haiti (%)
Place of birth for the foreign-born population - Jamaica (%)
Place of birth for the foreign-born population - St. Vincent and the Grenadines (%)
Place of birth for the foreign-born population - Trinidad and Tobago (%)
Place of birth for the foreign-born population - West Indies (%)
Place of birth for the foreign-born population - Other Caribbean (%)
Place of birth for the foreign-born population - Belize (%)
Place of birth for the foreign-born population - Costa Rica (%)
Place of birth for the foreign-born population - El Salvador (%)
Place of birth for the foreign-born population - Guatemala (%)
Place of birth for the foreign-born population - Honduras (%)
Place of birth for the foreign-born population - Mexico (%)
Place of birth for the foreign-born population - Nicaragua (%)
Place of birth for the foreign-born population - Panama (%)
Place of birth for the foreign-born population - Other Central America (%)
Place of birth for the foreign-born population - Argentina (%)
Place of birth for the foreign-born population - Bolivia (%)
Place of birth for the foreign-born population - Brazil (%)
Place of birth for the foreign-born population - Chile (%)
Place of birth for the foreign-born population - Colombia (%)
Place of birth for the foreign-born population - Ecuador (%)
Place of birth for the foreign-born population - Guyana (%)
Place of birth for the foreign-born population - Peru (%)
Place of birth for the foreign-born population - Uruguay (%)
Place of birth for the foreign-born population - Venezuela (%)
Place of birth for the foreign-born population - Other South America (%)
Place of birth for the foreign-born population - Canada (%)
Place of birth for the foreign-born population - Other Northern America (%)
Place of birth for the foreign-born population - Other (%)
Latest news about races in Euless, TX collected exclusively by city-data.com from local newspapers, TV, and radio stations
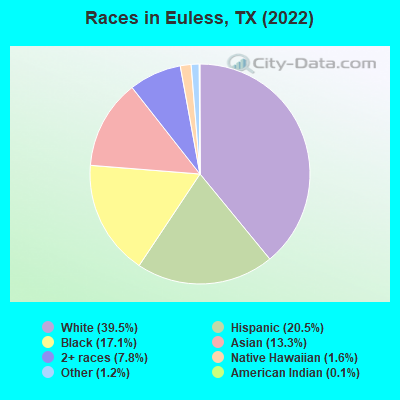
According to 2022 data, the most numerous races in Euless, TX are Hispanic (12,606 residents), White alone (24,331 residents), and Black alone (10,504 residents). 69.8% of Euless residents speak English at home. 20.8% of Euless, TX residents are foreign-born (9.9% born in Asia, 5.4% born in Latin America, 3.7% born in Africa), which is 18.3% greater than the foreign-born rate of 17.0% across the entire state of Texas.
Race distribution in Euless
2000 2022
31,468 68.4% White alone 6,125 13.3% Hispanic 3,272 7.1% Asian alone 2,943 6.4% Black alone 987 2.1% Two or more races 847 1.8% Native Hawaiian and Other 260 0.6% American Indian alone 103 0.2% Other race alone
24,331 39.5% White alone 12,606 20.5% Hispanic 10,504 17.1% Black alone 8,169 13.3% Asian alone 4,796 7.8% Two or more races 1,013 1.6% Native Hawaiian and Other 713 1.2% Other race alone 73 0.1% American Indian alone
2000 2022
10,933,313 52.4% White alone 6,669,666 32.0% Hispanic 2,364,255 11.3% Black alone 554,445 2.7% Asian alone 230,567 1.1% Two or more races 68,859 0.3% American Indian alone 19,958 0.10% Other race alone 10,757 0.05% Native Hawaiian and Other
12,070,642 40.2% Hispanic 11,683,430 38.9% White alone 3,508,706 11.7% Black alone 1,608,173 5.4% Asian alone 956,560 3.2% Two or more races 125,763 0.4% Other race alone 47,023 0.2% American Indian alone 29,275 0.10% Native Hawaiian and Other
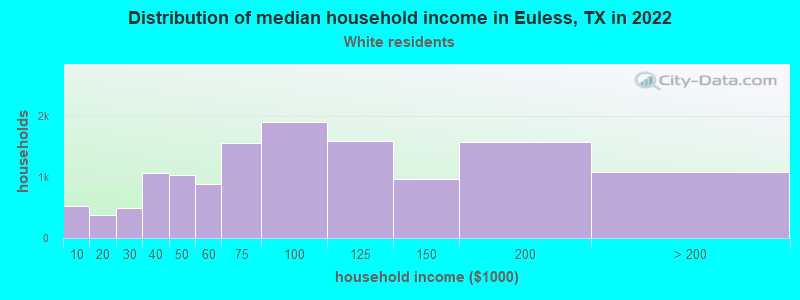
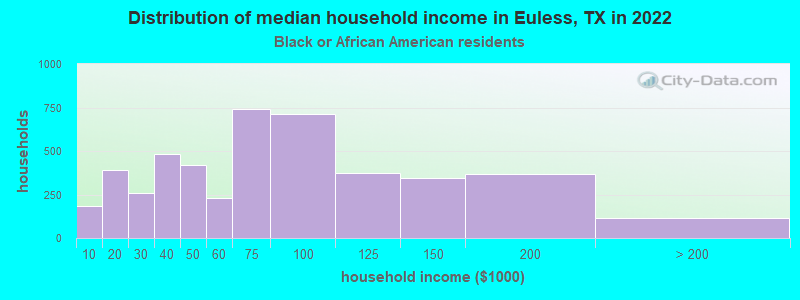
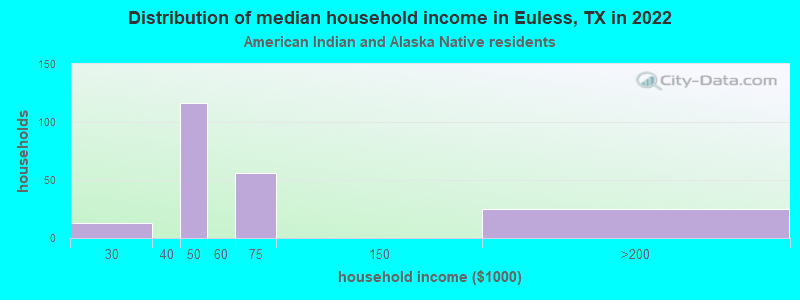
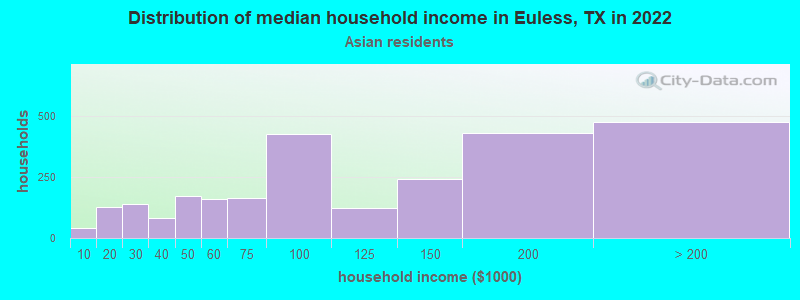
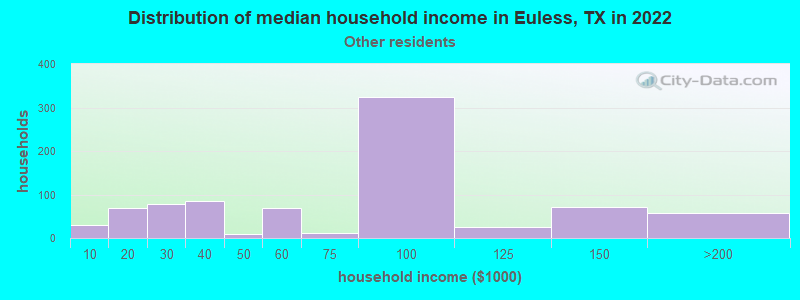
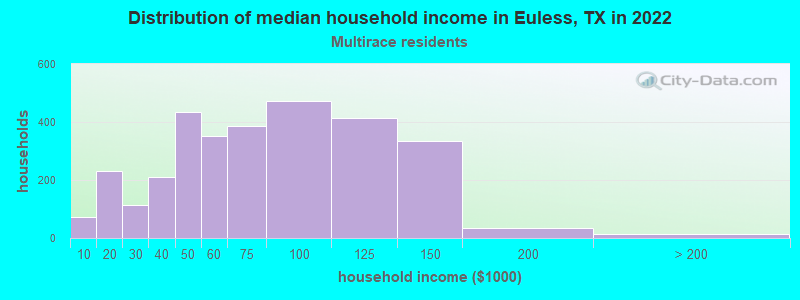
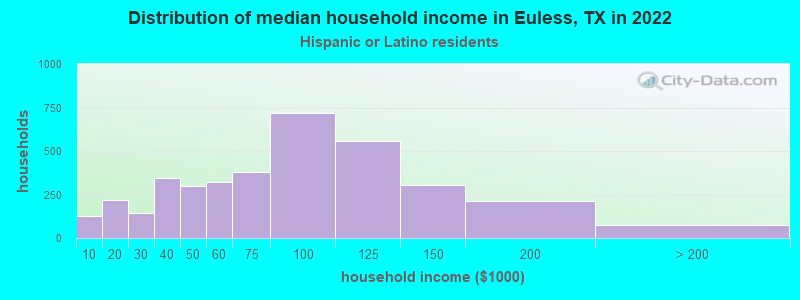
Income and house value in Euless Median household income in 2022 $80,424 White non-Hispanic householders$69,834 Black householders$53,069 American Indian and Alaska Native householders$92,756 Asian householders$38,231 Native Hawaiian and other Pacific Islander householders$74,341 Some other race householders$66,240 Two or more races householders$72,422 Hispanic or Latino race householdersMedian 2022 house value $317,655 White Non-Hispanic householders$364,379 Black or African American householders$224,207 American Indian or Alaska Native householders $363,370 Asian householders$378,160 Native Hawaiian and other Pacific Islander householders$301,184 Some other race householders$369,085 Two or more races householders$293,116 Hispanic or Latino householders
Median age by race in Euless
40.7 Median age for White residents37.8 42.5 31.6 Median age for Black or African American residents34.0 31.3 42.8 Median age for American Indian / Alaska Native residents57.5 24.0 37.9 Median age for Asian residents40.2 35.2 27.6 Median age for Native Hawaiian / Pacific Islander residents18.6 30.8 30.6 Median age for Other race residents30.9 31.0 24.2 Median age for Two or more races residents23.2 27.7 41.5 Median age for White alone residents39.7 43.5 28.8 Median age for Hispanic or Latino residents30.1 26.9
Owner/renter occupied households by race in Euless
House owners and renters - White residents 6,209 48.4% Owner occupied6,622 51.6% Renter occupiedHouse owners and renters - Black or African American residents 562 12.2% Owner occupied4,056 87.8% Renter occupiedHouse owners and renters - American Indian / Alaska Native residents 27 18.7% Owner occupied117 81.3% Renter occupiedHouse owners and renters - Asian residents 1,556 58.9% Owner occupied1,084 41.1% Renter occupiedHouse owners and renters - Native Hawaiian / Pacific Islander residents 110 24.5% Owner occupied339 75.5% Renter occupiedHouse owners and renters - Other race residents 430 51.0% Owner occupied413 49.0% Renter occupiedHouse owners and renters - Two or more races residents 1,002 30.6% Owner occupied2,272 69.4% Renter occupiedHouse owners and renters - White alone residents 5,954 47.7% Owner occupied6,537 52.3% Renter occupiedHouse owners and renters - Hispanic or Latino residents 1,507 40.9% Owner occupied2,176 59.1% Renter occupied
Language usage in Euless
English speakers - Total 69.8% of residents of Euless speak English at home.
13.1% of residents speak Spanish at home 5,553 73.5% Speak English very well2,002 26.5% Speak English less than very well16.8% of residents speak other language at home 6,515 66.9% Speak English very well3,219 33.1% Speak English less than very well
English speakers - Born in the United States 92.7% of residents of Euless speak English at home.
3.6% of residents speak Spanish at home 568 89.6% Speak English very well66 10.4% Speak English less than very well2.9% of residents speak other language at home 520 100.0% Speak English very well
English speakers - Native, born elsewhere 52.4% of residents of Euless speak English at home.
38.0% of residents speak Spanish at home 560 74.3% Speak English very well194 25.7% Speak English less than very well7.9% of residents speak other language at home 132 84.6% Speak English very well24 15.4% Speak English less than very well
English speakers - Foreign-born 12.8% of residents of Euless speak English at home.
22.0% of residents speak Spanish at home 1,227 44.5% Speak English very well1,528 55.5% Speak English less than very well64.6% of residents speak other language at home 5,150 63.7% Speak English very well2,939 36.3% Speak English less than very well
White (Caucasian) - Speak only English Native:
95.3% (23,522)Foreign-born:
33.5% (371)
White (Caucasian) - Speak another language Native:
5.5% (1,361)Foreign-born:
70.3% (778)
Black or African American - Speak only English Native:
93.9% (6,887)Foreign-born:
17.6% (425)
Black or African American - Speak another language Native:
6.6% (484)Foreign-born:
83.1% (2,005)
American Indian / Alaska Native - Speak another language Native:
21.3% (87)Foreign-born:
100.0% (52)
Asian - Speak only English Native:
51.3% (858)Foreign-born:
9.3% (568)
Asian - Speak another language Native:
48.2% (806)Foreign-born:
90.5% (5,501)
Native Hawaiian / Pacific Islander - Speak only English Native:
75.0% (459)Foreign-born:
17.2% (78)
Native Hawaiian / Pacific Islander - Speak another language Native:
25.0% (153)Foreign-born:
78.2% (354)
Other race - Speak only English Native:
56.3% (977)Foreign-born:
13.3% (91)
Other race - Speak another language Native:
46.7% (811)Foreign-born:
88.3% (605)
Two or more races - Speak only English Native:
66.2% (6,602)Foreign-born:
2.5% (39)
Two or more races - Speak another language Native:
26.5% (2,646)Foreign-born:
99.0% (1,568)
White alone - Speak only English Native:
97.7% (22,279)Foreign-born:
38.2% (256)
White alone - Speak another language Native:
2.3% (517)Foreign-born:
61.8% (414)
Hispanic or Latino - Speak only English Native:
50.1% (4,238)Foreign-born:
7.9% (239)
Hispanic or Latino - Speak another language Native:
49.2% (4,160)Foreign-born:
91.9% (2,770)
Foreign-born residents in Euless 12,799 residents are foreign born (9.9% Asia , 5.4% Latin America , 3.7% Africa ).
This city:
20.8%Texas:
17.1%
Marital status for residents in Euless Marital status - White (Caucasian) population 15 years and over
Males 33.0% Never married49.8% Now married2.2% Separated1.6% Widowed13.3% DivorcedFemales 28.6% Never married46.8% Now married1.8% Separated7.2% Widowed15.5% DivorcedWomen who gave birth in the past 12 months Now married:
71.9% (137)Unmarried:
28.1% (54)
Women who did not give birth in the past 12 months Now married:
48.3% (2,962)Unmarried:
51.7% (3,177)
Marital status - Black or African American population 15 years and over
Males 45.7% Never married34.2% Now married0.9% Separated7.6% Widowed11.5% DivorcedFemales 56.7% Never married26.6% Now married0.7% Separated2.8% Widowed13.2% DivorcedWomen who gave birth in the past 12 months Now married:
39.5% (67)Unmarried:
60.5% (103)
Women who did not give birth in the past 12 months Now married:
27.2% (786)Unmarried:
72.8% (2,102)
Marital status - American Indian / Alaska Native population 15 years and over
Males 11.4% Never married37.1% Now married0.0% Separated0.0% Widowed51.5% DivorcedFemales 24.0% Never married76.0% Now married0.0% Separated0.0% Widowed0.0% DivorcedWomen who did not give birth in the past 12 months Now married:
60.0% (52)Unmarried:
40.0% (34)
Marital status - Asian population 15 years and over
Males 22.3% Never married72.6% Now married0.0% Separated0.0% Widowed5.2% DivorcedFemales 20.9% Never married66.6% Now married0.6% Separated6.5% Widowed5.5% DivorcedWomen who gave birth in the past 12 months Now married:
100.0% (127)Unmarried:
0.0% (0)
Women who did not give birth in the past 12 months Now married:
65.8% (1,534)Unmarried:
34.2% (797)
Marital status - Native Hawaiian / Pacific Islander population 15 years and over
Males 72.9% Never married20.5% Now married0.0% Separated0.0% Widowed6.5% DivorcedFemales 32.0% Never married40.0% Now married0.0% Separated16.0% Widowed12.0% DivorcedWomen who gave birth in the past 12 months Now married:
0.0% (0)Unmarried:
100.0% (8)
Women who did not give birth in the past 12 months Now married:
47.7% (160)Unmarried:
52.3% (176)
Marital status - Other race population 15 years and over
Males 47.8% Never married39.3% Now married0.0% Separated3.0% Widowed10.0% DivorcedFemales 44.5% Never married37.3% Now married4.5% Separated1.3% Widowed12.3% DivorcedWomen who gave birth in the past 12 months Now married:
70.8% (80)Unmarried:
29.2% (33)
Women who did not give birth in the past 12 months Now married:
31.4% (225)Unmarried:
68.6% (493)
Marital status - Two or more races population 15 years and over
Males 65.2% Never married25.5% Now married0.0% Separated0.3% Widowed8.9% DivorcedFemales 45.2% Never married40.9% Now married1.9% Separated2.0% Widowed10.0% DivorcedWomen who gave birth in the past 12 months Now married:
55.7% (118)Unmarried:
44.3% (93)
Women who did not give birth in the past 12 months Now married:
41.1% (1,073)Unmarried:
58.9% (1,537)
Marital status - White alone, not Hispanic / Latino population 15 years and over
Males 32.5% Never married49.8% Now married1.9% Separated1.9% Widowed13.9% DivorcedFemales 28.8% Never married46.1% Now married1.6% Separated7.9% Widowed15.6% DivorcedWomen who gave birth in the past 12 months Now married:
81.5% (115)Unmarried:
18.5% (26)
Women who did not give birth in the past 12 months Now married:
47.9% (2,676)Unmarried:
52.1% (2,912)
Marital status - Hispanic or Latino population 15 years and over
Males 43.2% Never married43.6% Now married1.6% Separated0.8% Widowed10.7% DivorcedFemales 37.9% Never married46.0% Now married2.9% Separated2.7% Widowed10.5% DivorcedWomen who gave birth in the past 12 months Now married:
62.3% (205)Unmarried:
37.7% (124)
Women who did not give birth in the past 12 months Now married:
43.0% (1,335)Unmarried:
57.0% (1,773)
Ancestries in Euless
3,402 10.2% English1,463 4.4% African1,291 3.9% American1,253 3.8% German1,101 3.3% Irish517 1.5% European379 1.1% Italian299 0.9% Scottish251 0.8% Kenyan223 0.7% Scotch-Irish200 0.6% Brazilian200 0.6% French172 0.5% Eastern European171 0.5% Ghanaian161 0.5% Jamaican160 0.5% Egyptian137 0.4% Ukrainian135 0.4% Ugandan128 0.4% Polish124 0.4% Turkish113 0.3% Greek98 0.3% Swedish90 0.3% British90 0.3% Nigerian83 0.2% Cajun77 0.2% Dutch72 0.2% Haitian64 0.2% Belgian64 0.2% Sudanese64 0.2% Welsh61 0.2% Iranian56 0.2% Ethiopian55 0.2% Bulgarian52 0.2% Scandinavian43 0.1% French Canadian38 0.1% Arab24 0.07% Canadian24 0.07% Yugoslavian23 0.07% Swiss22 0.07% Liberian20 0.06% Northern European19 0.06% Czech19 0.06% Slavic19 0.06% West Indian16 0.05% Moroccan16 0.05% Finnish16 0.05% South African14 0.04% Norwegian14 0.04% Danish11 0.03% Serbian10 0.03% Slovak8 0.02% Albanian5 0.01% Hungarian4 0.01% Trinidadian and Tobagonian3 0.01% Czechoslovakian2 0.01% Romanian
Geographical mobility in Euless Same house 1 year ago 22,815 85.8% White (Caucasian)7,906 74.8% Black or African American336 70.1% American Indian / Alaska Native7,250 89.2% Asian919 84.4% Native Hawaiian / Pacific Islander2,092 85.5% Other race10,815 83.3% Two or more races20,816 85.8% White alone, not Hispanic / Latino10,106 82.2% Hispanic or LatinoMoved within same county 2,340 8.8% White / Caucasian1,880 17.8% Black or African American104 21.6% American Indian / Alaska Native510 6.3% Asian68 6.2% Native Hawaiian / Pacific Islander146 6.0% Other race1,203 9.3% Two or more races2,097 8.6% White alone, not Hispanic / Latino1,258 10.2% Hispanic or LatinoMoved within same state 1,089 4.1% White / Caucasian257 2.4% Black or African American102 1.3% Asian62 2.5% Other race446 3.4% Two or more races1,049 4.3% White alone, not Hispanic / Latino300 2.4% Hispanic or LatinoMoved from different state 306 1.2% White / Caucasian391 3.7% Black or African American13 2.7% American Indian / Alaska Native110 1.4% Asian90 3.7% Other race370 2.8% Two or more races261 1.1% White alone, not Hispanic / Latino376 3.1% Hispanic or LatinoMoved from abroad 21 0.1% White72 0.7% Black or African American138 1.7% Asian32 1.3% Other race92 0.7% Two or more races27 0.1% White alone, not Hispanic / Latino122 1.0% Hispanic or Latino
Children Nativity (place of birth) in Euless
Children under 6 years - Living with two parents Both parents native 1,238 100.0% NativeBoth parents foreign-born 858 95.9% Native36 4.1% Foreign-bornOne native, one foreign-born parent 946 100.0% NativeChildren under 6 years - Living with one parent Native parent 1,240 99.9% Native1 0.1% Foreign-bornForeign-born parent 197 92.8% Native15 7.2% Foreign-bornChildren 6 to 17 years - Living with two parents Both parents native 2,970 99.8% Native6 0.2% Foreign-bornBoth parents foreign-born 1,552 78.4% Native427 21.6% Foreign-bornOne native, one foreign-born parent 1,066 96.4% Native40 3.6% Foreign-bornChildren 6 to 17 years - Living with one parent Native parent 2,907 100.0% NativeForeign-born parent 540 53.7% Native465 46.3% Foreign-born
Place of birth for residents in Euless 6,178 Asia4,033 South Central Asia3,488 Americas3,402 Latin America2,357 Central America2,341 Africa1,433 South Eastern Asia704 South America676 Western Africa618 Eastern Africa459 Eastern Asia414 Middle Africa396 Oceania394 Europe357 Northern Africa339 Caribbean252 Western Asia194 China176 Western Europe126 Southern Africa103 Eastern Europe86 Northern America59 Northern Europe55 Southern Europe17 Australia and New Zealand Subregion1,941 Mexico1,532 India1,380 Nepal1,005 Pakistan523 Laos398 Vietnam350 Ghana331 Philippines315 Kenya304 Democratic Republic of Congo (Zaire)267 Ecuador264 Brazil250 Korea246 El Salvador160 China156 Nigeria156 Thailand137 Egypt126 South Africa126 Sudan118 Micronesia113 Jamaica113 Peru107 Somalia100 Dominican Republic98 Panama93 Algeria91 France86 Canada70 Congo70 Cuba69 Germany68 Uganda61 Ethiopia59 Bangladesh59 Turkey51 Honduras50 Ireland47 Bulgaria47 Togo45 Iran42 Sierra Leone41 St. Vincent and the Grenadines36 Colombia35 Iraq34 Taiwan34 Spain33 United Arab Emirates30 Poland25 Senegal24 Saudi Arabia22 Chile21 Italy18 Costa Rica17 New Zealand16 Indonesia15 Kuwait15 Belgium13 Japan13 Czechoslovakia12 Marshall Islands12 Bosnia and Herzegovina10 Sri Lanka8 Scotland8 Dominica6 Malaysia5 Ivory Coast5 Trinidad and Tobago1 Guatemala
Grandparents responsible for own grandchildren in Euless
Grandparents (30 to 59 years) White / Caucasian 90 75.3% Responsible for grandchildren30 24.7% Not responsible for grandchildrenBlack or African American 26 100.0% Not responsible for grandchildrenAsian 36 53.1% Responsible for grandchildren32 46.9% Not responsible for grandchildrenNative Hawaiian / Pacific Islander 64 100.0% Not responsible for grandchildrenOther race 6 100.0% Not responsible for grandchildrenTwo or more races 13 69.5% Responsible for grandchildren6 30.5% Not responsible for grandchildrenWhite alone, not Hispanic / Latino 61 62.1% Responsible for grandchildren37 37.9% Not responsible for grandchildrenHispanic or Latino 70 95.7% Responsible for grandchildren3 4.3% Not responsible for grandchildrenGrandparents (60 years and over) White / Caucasian 79 26.4% Responsible for grandchildren220 73.6% Not responsible for grandchildrenBlack or African American 24 100.0% Not responsible for grandchildrenAsian 22 5.7% Responsible for grandchildren364 94.3% Not responsible for grandchildrenNative Hawaiian / Pacific Islander 8 100.0% Not responsible for grandchildrenOther race 63 100.0% Not responsible for grandchildrenTwo or more races 145 100.0% Not responsible for grandchildrenWhite alone, not Hispanic / Latino 85 29.3% Responsible for grandchildren206 70.7% Not responsible for grandchildrenHispanic or Latino 91 100.0% Not responsible for grandchildren