Races in Ewing, New Jersey (NJ) Detailed Stats
Ancestries, Foreign-born residents, place of birth

Recent posts about races in Ewing, New Jersey on our local forum with over 2,400,000 registered users:
 | Ewing (compared to Hamilton West) (16 replies) |
| ewing by halo farms (6 replies) |
| FTHB Where to buy? (14 replies) |
| Need suggestions on Indian communities near Ewing (3 replies) |
| Princeton or Ewing (8 replies) |
| Places to rent in or around Trenton? (59 replies) |
8.2% of Ewing, NJ residents are foreign-born (3.0% born in Europe, 2.6% born in Latin America, 1.9% born in Asia), which is 180.4% less than the foreign-born rate of 23.0% across the entire state of New Jersey.
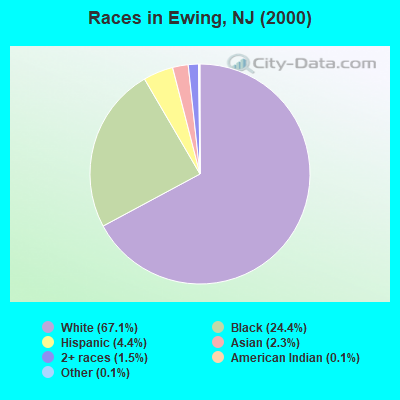
Race distribution in Ewing

- 23,96867.1%White alone
- 8,70724.4%Black alone
- 1,5864.4%Hispanic
- 8052.3%Asian alone
- 5391.5%Two or more races
- 450.1%Other race alone
- 450.1%American Indian alone
- 120.03%Native Hawaiian and Other
Pacific Islander alone
2000
2022
-
- 5,557,20966.0%White alone
- 1,117,19113.3%Hispanic
- 1,096,17113.0%Black alone
- 477,0125.7%Asian alone
- 133,6891.6%Two or more races
- 19,5650.2%Other race alone
- 11,3380.1%American Indian alone
- 2,1750.03%Native Hawaiian and Other
Pacific Islander alone

-
- 4,766,47651.5%White alone
- 2,028,47021.9%Hispanic
- 1,111,63212.0%Black alone
- 923,54610.0%Asian alone
- 332,2373.6%Two or more races
- 89,8471.0%Other race alone
- 8,5570.09%American Indian alone
- 9340.01%Native Hawaiian and Other
Pacific Islander alone

Income and house value in Ewing
- Median household income in 2022
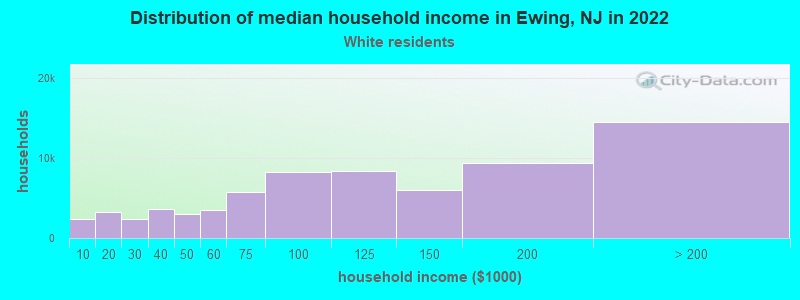
- $97,197White non-Hispanic householders
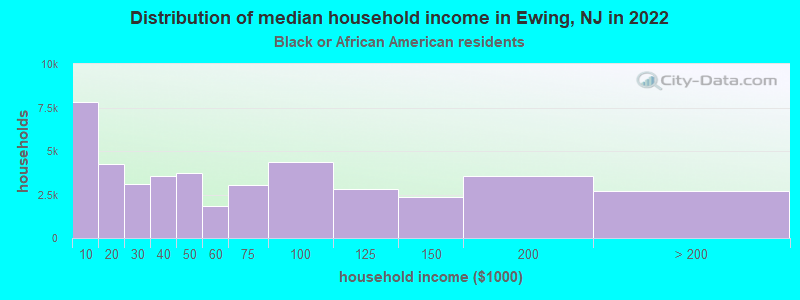
- $72,181Black householders
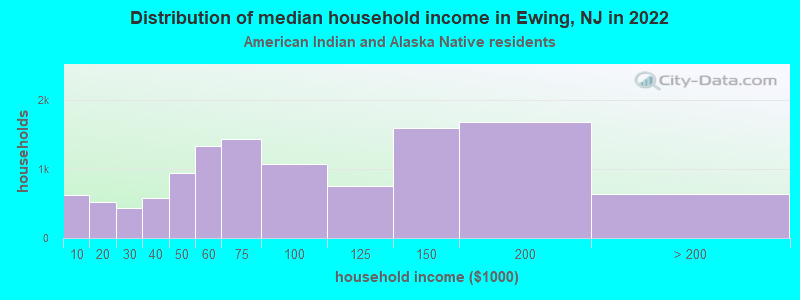
- $61,803American Indian and Alaska Native householders
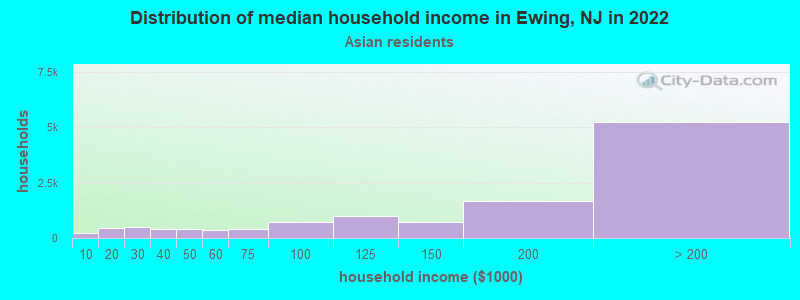
- $127,062Asian householders
- $100,650Some other race householders
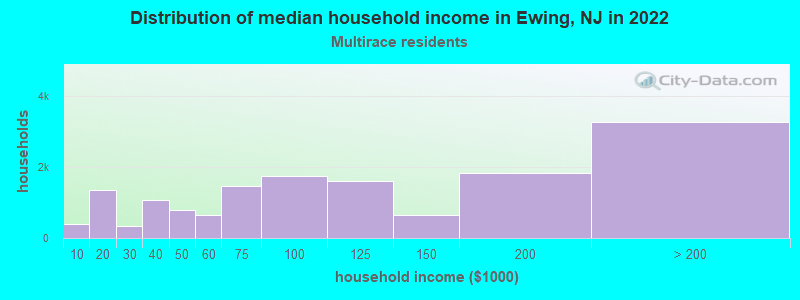
- $108,127Two or more races householders
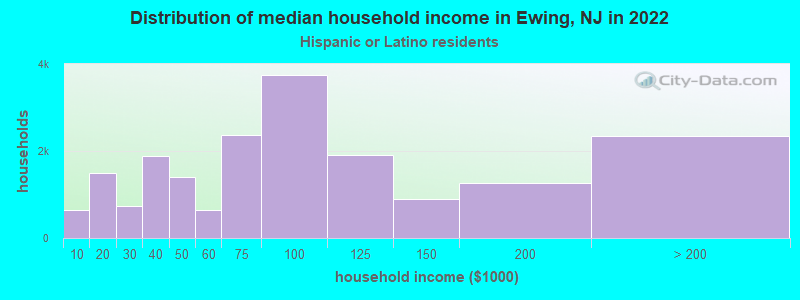
- $71,293Hispanic or Latino race householders
- Median 2022 house value
- $332,073White Non-Hispanic householders
- $287,765Black or African American householders
- $108,363American Indian or Alaska Native householders
- $436,825Asian householders
- $281,022Some other race householders
- $280,300Two or more races householders
- $246,346Hispanic or Latino householders
Household income for White non-Hispanic householders
Household income for Black householders
Household income for American Indian and Alaska Native householders
Household income for Asian householders
Household income for Two or more races householders
Household income for Hispanic or Latino race householders
Foreign-born residents in Ewing
2,929 residents are foreign born (3.0% Europe, 2.6% Latin America, 1.9% Asia).
| This city: | 8.2% |
| New Jersey: | 17.5% |
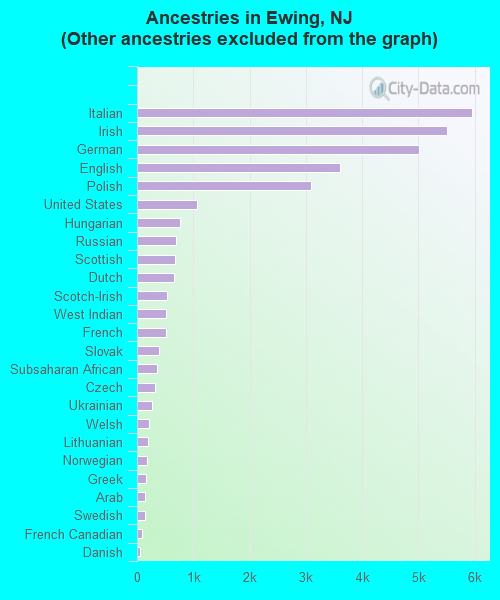
Ancestries in Ewing

- 10,49225.2%Other
- 5,95514.3%Italian
- 5,50113.2%Irish
- 5,01612.0%German
- 3,6008.6%English
- 3,0917.4%Polish
- 1,0602.5%United States
- 7631.8%Hungarian
- 6921.7%Russian
- 6701.6%Scottish
- 6531.6%Dutch
- 5311.3%Scotch-Irish
- 5241.3%West Indian
- 5231.3%French
- 3971.0%Slovak
- 3640.9%Subsaharan African
- 3150.8%Czech
- 2600.6%Ukrainian
- 2090.5%Welsh
- 1940.5%Lithuanian
- 1740.4%Norwegian
- 1680.4%Greek
- 1470.4%Arab
- 1470.4%Swedish
- 920.2%French Canadian
- 610.1%Danish
- 340.08%Swiss
- 300.07%Portuguese
Zip codes: 08618.