Races in Fairview, California (CA) Detailed Stats
Data:
Races - White alone (%)
Races - White alone (% change since 2000)
Races - Black alone (%)
Races - Black alone (% change since 2000)
Races - American Indian alone (%)
Races - American Indian alone (% change since 2000)
Races - Asian alone (%)
Races - Asian alone (% change since 2000)
Races - Hispanic (%)
Races - Hispanic (% change since 2000)
Races - Native Hawaiian and Other Pacific Islander alone (%)
Races - Native Hawaiian and Other Pacific Islander alone (% change since 2000)
Races - Two or more races(%)
Races - Two or more races(% change since 2000)
Races - Other race alone (%)
Races - Other race alone (% change since 2000)
Racial diversity
Place of birth - Born in state of residence (%)
Place of birth - Born in state of residence (%) - White
Place of birth - Born in state of residence (%) - Black or African American
Place of birth - Born in state of residence (%) - Asian
Place of birth - Born in state of residence (%) - Hispanic or Latino
Place of birth - Born in state of residence (%) - American Indian and Alaska Native
Place of birth - Born in state of residence (%) - Multirace
Place of birth - Born in state of residence (%) - Other Race
Place of birth - Born in other state (%)
Place of birth - Born in other state (%) - White
Place of birth - Born in other state (%) - Black or African American
Place of birth - Born in other state (%) - Asian
Place of birth - Born in other state (%) - Hispanic or Latino
Place of birth - Born in other state (%) - American Indian and Alaska Native
Place of birth - Born in other state (%) - Multirace
Place of birth - Born in other state (%) - Other Race
Place of birth - Native, outside of US (%)
Place of birth - Native, outside of US (%) - White
Place of birth - Native, outside of US (%) - Black or African American
Place of birth - Native, outside of US (%) - Asian
Place of birth - Native, outside of US (%) - Hispanic or Latino
Place of birth - Native, outside of US (%) - American Indian and Alaska Native
Place of birth - Native, outside of US (%) - Multirace
Place of birth - Native, outside of US (%) - Other Race
Place of birth - Foreign born (%)
Place of birth - Foreign born (%) - White
Place of birth - Foreign born (%) - Black or African American
Place of birth - Foreign born (%) - Asian
Place of birth - Foreign born (%) - Hispanic or Latino
Place of birth - Foreign born (%) - American Indian and Alaska Native
Place of birth - Foreign born (%) - Multirace
Place of birth - Foreign born (%) - Other Race
Residents speaking English at home (%)
Residents speaking English at home - Born in the United States (%)
Residents speaking English at home - Native, born elsewhere (%)
Residents speaking English at home - Foreign born (%)
Residents speaking Spanish at home (%)
Residents speaking Spanish at home - Born in the United States (%)
Residents speaking Spanish at home - Native, born elsewhere (%)
Residents speaking Spanish at home - Foreign born (%)
Residents speaking other language at home (%)
Residents speaking other language at home - Born in the United States (%)
Residents speaking other language at home - Native, born elsewhere (%)
Residents speaking other language at home - Foreign born (%)
Marital status - Never married (%)
Marital status - Now married (%)
Marital status - Separated (%)
Marital status - Widowed (%)
Marital status - Divorced (%)
Ancestries Reported - Arab (%)
Ancestries Reported - Czech (%)
Ancestries Reported - Danish (%)
Ancestries Reported - Dutch (%)
Ancestries Reported - English (%)
Ancestries Reported - French (%)
Ancestries Reported - French Canadian (%)
Ancestries Reported - German (%)
Ancestries Reported - Greek (%)
Ancestries Reported - Hungarian (%)
Ancestries Reported - Irish (%)
Ancestries Reported - Italian (%)
Ancestries Reported - Lithuanian (%)
Ancestries Reported - Norwegian (%)
Ancestries Reported - Polish (%)
Ancestries Reported - Portuguese (%)
Ancestries Reported - Russian (%)
Ancestries Reported - Scotch-Irish (%)
Ancestries Reported - Scottish (%)
Ancestries Reported - Slovak (%)
Ancestries Reported - Subsaharan African (%)
Ancestries Reported - Swedish (%)
Ancestries Reported - Swiss (%)
Ancestries Reported - Ukrainian (%)
Ancestries Reported - United States (%)
Ancestries Reported - Welsh (%)
Ancestries Reported - West Indian (%)
Ancestries Reported - Other (%)
Geographical mobility - Same house 1 year ago (%)
Geographical mobility - Same house 1 year ago (%) - White
Geographical mobility - Same house 1 year ago (%) - Black or African American
Geographical mobility - Same house 1 year ago (%) - Asian
Geographical mobility - Same house 1 year ago (%) - Hispanic or Latino
Geographical mobility - Same house 1 year ago (%) - American Indian and Alaska Native
Geographical mobility - Same house 1 year ago (%) - Multirace
Geographical mobility - Same house 1 year ago (%) - Other Race
Geographical mobility - Moved within same county (%)
Geographical mobility - Moved within same county (%) - White
Geographical mobility - Moved within same county (%) - Black or African American
Geographical mobility - Moved within same county (%) - Asian
Geographical mobility - Moved within same county (%) - Hispanic or Latino
Geographical mobility - Moved within same county (%) - American Indian and Alaska Native
Geographical mobility - Moved within same county (%) - Multirace
Geographical mobility - Moved within same county (%) - Other Race
Geographical mobility - Moved from different county within same state (%)
Geographical mobility - Moved from different county within same state (%) - White
Geographical mobility - Moved from different county within same state (%) - Black or African American
Geographical mobility - Moved from different county within same state (%) - Asian
Geographical mobility - Moved from different county within same state (%) - Hispanic or Latino
Geographical mobility - Moved from different county within same state (%) - American Indian and Alaska Native
Geographical mobility - Moved from different county within same state (%) - Multirace
Geographical mobility - Moved from different county within same state (%) - Other Race
Geographical mobility - Moved from different state (%)
Geographical mobility - Moved from different state (%) - White
Geographical mobility - Moved from different state (%) - Black or African American
Geographical mobility - Moved from different state (%) - Asian
Geographical mobility - Moved from different state (%) - Hispanic or Latino
Geographical mobility - Moved from different state (%) - American Indian and Alaska Native
Geographical mobility - Moved from different state (%) - Multirace
Geographical mobility - Moved from different state (%) - Other Race
Geographical mobility - Moved from abroad (%)
Geographical mobility - Moved from abroad (%) - White
Geographical mobility - Moved from abroad (%) - Black or African American
Geographical mobility - Moved from abroad (%) - Asian
Geographical mobility - Moved from abroad (%) - Hispanic or Latino
Geographical mobility - Moved from abroad (%) - American Indian and Alaska Native
Geographical mobility - Moved from abroad (%) - Multirace
Geographical mobility - Moved from abroad (%) - Other Race
Place of birth for the foreign-born population - Ireland (%)
Place of birth for the foreign-born population - Denmark (%)
Place of birth for the foreign-born population - Norway (%)
Place of birth for the foreign-born population - Sweden (%)
Place of birth for the foreign-born population - United Kingdom (%)
Place of birth for the foreign-born population - England (%)
Place of birth for the foreign-born population - Scotland (%)
Place of birth for the foreign-born population - Other Northern Europe (%)
Place of birth for the foreign-born population - Austria (%)
Place of birth for the foreign-born population - Belgium (%)
Place of birth for the foreign-born population - France (%)
Place of birth for the foreign-born population - Germany (%)
Place of birth for the foreign-born population - Netherlands (%)
Place of birth for the foreign-born population - Switzerland (%)
Place of birth for the foreign-born population - Other Western Europe (%)
Place of birth for the foreign-born population - Greece (%)
Place of birth for the foreign-born population - Italy (%)
Place of birth for the foreign-born population - Portugal (%)
Place of birth for the foreign-born population - Spain (%)
Place of birth for the foreign-born population - Other Southern Europe (%)
Place of birth for the foreign-born population - Albania (%)
Place of birth for the foreign-born population - Belarus (%)
Place of birth for the foreign-born population - Bosnia and Herzegovina (%)
Place of birth for the foreign-born population - Bulgaria (%)
Place of birth for the foreign-born population - Croatia (%)
Place of birth for the foreign-born population - Czechoslovakia (%)
Place of birth for the foreign-born population - Hungary (%)
Place of birth for the foreign-born population - Latvia (%)
Place of birth for the foreign-born population - Lithuania (%)
Place of birth for the foreign-born population - North Macedonia (Macedonia) (%)
Place of birth for the foreign-born population - Moldova (%)
Place of birth for the foreign-born population - Poland (%)
Place of birth for the foreign-born population - Romania (%)
Place of birth for the foreign-born population - Russia (%)
Place of birth for the foreign-born population - Serbia (%)
Place of birth for the foreign-born population - Ukraine (%)
Place of birth for the foreign-born population - Other Eastern Europe (%)
Place of birth for the foreign-born population - China (%)
Place of birth for the foreign-born population - Hong Kong (%)
Place of birth for the foreign-born population - Taiwan (%)
Place of birth for the foreign-born population - Japan (%)
Place of birth for the foreign-born population - Korea (%)
Place of birth for the foreign-born population - Other Eastern Asia (%)
Place of birth for the foreign-born population - Afghanistan (%)
Place of birth for the foreign-born population - Bangladesh (%)
Place of birth for the foreign-born population - India (%)
Place of birth for the foreign-born population - Iran (%)
Place of birth for the foreign-born population - Kazakhstan (%)
Place of birth for the foreign-born population - Nepal (%)
Place of birth for the foreign-born population - Pakistan (%)
Place of birth for the foreign-born population - Sri Lanka (%)
Place of birth for the foreign-born population - Uzbekistan (%)
Place of birth for the foreign-born population - Other South Central Asia (%)
Place of birth for the foreign-born population - Burma (%)
Place of birth for the foreign-born population - Cambodia (%)
Place of birth for the foreign-born population - Indonesia (%)
Place of birth for the foreign-born population - Laos (%)
Place of birth for the foreign-born population - Malaysia (%)
Place of birth for the foreign-born population - Philippines (%)
Place of birth for the foreign-born population - Singapore (%)
Place of birth for the foreign-born population - Thailand (%)
Place of birth for the foreign-born population - Vietnam (%)
Place of birth for the foreign-born population - Other South Eastern Asia (%)
Place of birth for the foreign-born population - Armenia (%)
Place of birth for the foreign-born population - Iraq (%)
Place of birth for the foreign-born population - Israel (%)
Place of birth for the foreign-born population - Jordan (%)
Place of birth for the foreign-born population - Kuwait (%)
Place of birth for the foreign-born population - Lebanon (%)
Place of birth for the foreign-born population - Saudi Arabia (%)
Place of birth for the foreign-born population - Syria (%)
Place of birth for the foreign-born population - Turkey (%)
Place of birth for the foreign-born population - Yemen (%)
Place of birth for the foreign-born population - Other Western Asia (%)
Place of birth for the foreign-born population - Eritrea (%)
Place of birth for the foreign-born population - Ethiopia (%)
Place of birth for the foreign-born population - Kenya (%)
Place of birth for the foreign-born population - Somalia (%)
Place of birth for the foreign-born population - Uganda (%)
Place of birth for the foreign-born population - Zimbabwe (%)
Place of birth for the foreign-born population - Other Eastern Africa (%)
Place of birth for the foreign-born population - Cameroon (%)
Place of birth for the foreign-born population - Congo (%)
Place of birth for the foreign-born population - Democratic Republic of Congo (Zaire) (%)
Place of birth for the foreign-born population - Other Middle Africa (%)
Place of birth for the foreign-born population - Egypt (%)
Place of birth for the foreign-born population - Morocco (%)
Place of birth for the foreign-born population - Sudan (%)
Place of birth for the foreign-born population - Other Northern Africa (%)
Place of birth for the foreign-born population - South Africa (%)
Place of birth for the foreign-born population - Other Southern Africa (%)
Place of birth for the foreign-born population - Cabo Verde (%)
Place of birth for the foreign-born population - Ghana (%)
Place of birth for the foreign-born population - Liberia (%)
Place of birth for the foreign-born population - Nigeria (%)
Place of birth for the foreign-born population - Senegal (%)
Place of birth for the foreign-born population - Sierra Leone (%)
Place of birth for the foreign-born population - Other Western Africa (%)
Place of birth for the foreign-born population - Australia (%)
Place of birth for the foreign-born population - New Zealand (%)
Place of birth for the foreign-born population - Fiji (%)
Place of birth for the foreign-born population - Micronesia (%)
Place of birth for the foreign-born population - Bahamas (%)
Place of birth for the foreign-born population - Barbados (%)
Place of birth for the foreign-born population - Cuba (%)
Place of birth for the foreign-born population - Dominica (%)
Place of birth for the foreign-born population - Dominican Republic (%)
Place of birth for the foreign-born population - Grenada (%)
Place of birth for the foreign-born population - Haiti (%)
Place of birth for the foreign-born population - Jamaica (%)
Place of birth for the foreign-born population - St. Vincent and the Grenadines (%)
Place of birth for the foreign-born population - Trinidad and Tobago (%)
Place of birth for the foreign-born population - West Indies (%)
Place of birth for the foreign-born population - Other Caribbean (%)
Place of birth for the foreign-born population - Belize (%)
Place of birth for the foreign-born population - Costa Rica (%)
Place of birth for the foreign-born population - El Salvador (%)
Place of birth for the foreign-born population - Guatemala (%)
Place of birth for the foreign-born population - Honduras (%)
Place of birth for the foreign-born population - Mexico (%)
Place of birth for the foreign-born population - Nicaragua (%)
Place of birth for the foreign-born population - Panama (%)
Place of birth for the foreign-born population - Other Central America (%)
Place of birth for the foreign-born population - Argentina (%)
Place of birth for the foreign-born population - Bolivia (%)
Place of birth for the foreign-born population - Brazil (%)
Place of birth for the foreign-born population - Chile (%)
Place of birth for the foreign-born population - Colombia (%)
Place of birth for the foreign-born population - Ecuador (%)
Place of birth for the foreign-born population - Guyana (%)
Place of birth for the foreign-born population - Peru (%)
Place of birth for the foreign-born population - Uruguay (%)
Place of birth for the foreign-born population - Venezuela (%)
Place of birth for the foreign-born population - Other South America (%)
Place of birth for the foreign-born population - Canada (%)
Place of birth for the foreign-born population - Other Northern America (%)
Place of birth for the foreign-born population - Other (%)
Latest news about races in Fairview, CA collected exclusively by city-data.com from local newspapers, TV, and radio stations
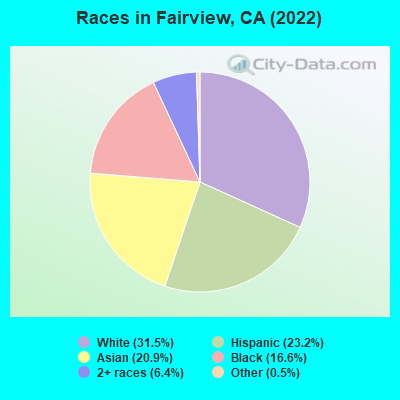
According to 2022 data, the most numerous races in Fairview, CA are Hispanic (2,541 residents), White alone (3,379 residents), and Asian alone (1,945 residents). 66.9% of Fairview residents speak English at home. 22.0% of Fairview, CA residents are foreign-born (11.4% born in Asia, 7.0% born in Latin America, 2.4% born in Europe), which is 18.1% less than the foreign-born rate of 26.0% across the entire state of California.
Race distribution in Fairview
2000 2022
15,816,790 46.7% White alone 10,966,556 32.4% Hispanic 3,648,860 10.8% Asian alone 2,181,926 6.4% Black alone 903,115 2.7% Two or more races 178,984 0.5% American Indian alone 103,736 0.3% Native Hawaiian and Other 71,681 0.2% Other race alone
15,732,184 40.3% Hispanic 13,160,426 33.7% White alone 5,957,867 15.3% Asian alone 2,025,218 5.2% Black alone 1,663,222 4.3% Two or more races 251,618 0.6% Other race alone 135,777 0.3% Native Hawaiian and Other 103,030 0.3% American Indian alone
Income and house value in Fairview Median household income in 2022 $146,124 White non-Hispanic householders$129,872 Black householders$189,062 American Indian and Alaska Native householders$187,003 Asian householders$147,705 Native Hawaiian and other Pacific Islander householders$125,295 Some other race householders$162,118 Two or more races householders$164,481 Hispanic or Latino race householdersMedian 2022 house value over $1,000,000 White Non-Hispanic householders$895,144 Black or African American householders over $1,000,000 Asian householdersover $1,000,000 Native Hawaiian and other Pacific Islander householders$921,059 Some other race householdersover $1,000,000 Two or more races householders$962,811 Hispanic or Latino householders
Median age by race in Fairview
54.9 Median age for White residents52.8 57.1 52.4 Median age for Black or African American residents48.1 60.0 45.1 Median age for American Indian / Alaska Native residents48.2 Median age for Asian residents43.5 56.2 27.1 Median age for Native Hawaiian / Pacific Islander residents39.1 Median age for Other race residents37.5 39.2 31.8 Median age for Two or more races residents39.0 27.3 52.1 Median age for White alone residents51.4 52.2 41.7 Median age for Hispanic or Latino residents37.8 46.6
Owner/renter occupied households by race in Fairview
House owners and renters - White residents 1,475 86.2% Owner occupied237 13.8% Renter occupiedHouse owners and renters - Black or African American residents 609 74.0% Owner occupied214 26.0% Renter occupiedHouse owners and renters - American Indian / Alaska Native residents 7 100.0% Owner occupiedHouse owners and renters - Asian residents 664 98.4% Owner occupied11 1.6% Renter occupiedHouse owners and renters - Other race residents 223 56.9% Owner occupied169 43.1% Renter occupiedHouse owners and renters - Two or more races residents 519 82.3% Owner occupied111 17.7% Renter occupiedHouse owners and renters - White alone residents 1,225 84.5% Owner occupied224 15.5% Renter occupiedHouse owners and renters - Hispanic or Latino residents 686 79.4% Owner occupied178 20.6% Renter occupied
Language usage in Fairview
English speakers - Total 66.9% of residents of Fairview speak English at home.
16.1% of residents speak Spanish at home 1,234 76.9% Speak English very well371 23.1% Speak English less than very well17.4% of residents speak other language at home 961 55.5% Speak English very well769 44.5% Speak English less than very well
English speakers - Born in the United States 92.4% of residents of Fairview speak English at home.
6.9% of residents speak Spanish at home 97 85.8% Speak English very well16 14.2% Speak English less than very well0.4% of residents speak other language at home 6 100.0% Speak English very well
English speakers - Native, born elsewhere 70.3% of residents of Fairview speak English at home.
27.2% of residents speak Spanish at home 76 100.0% Speak English very well2.9% of residents speak other language at home 8 100.0% Speak English very well
English speakers - Foreign-born 10.9% of residents of Fairview speak English at home.
28.7% of residents speak Spanish at home 363 55.2% Speak English very well295 44.8% Speak English less than very well61.5% of residents speak other language at home 676 48.0% Speak English very well733 52.0% Speak English less than very well
White (Caucasian) - Speak only English Native:
89.0% (2,880)Foreign-born:
21.0% (81)
White (Caucasian) - Speak another language Native:
12.4% (402)Foreign-born:
79.3% (304)
Black or African American - Speak only English Native:
99.3% (1,776)Foreign-born:
11.5% (14)
Black or African American - Speak another language Native:
0.5% (9)Foreign-born:
78.7% (98)
Asian - Speak only English Native:
74.1% (487)Foreign-born:
10.7% (133)
Asian - Speak another language Native:
27.1% (178)Foreign-born:
89.3% (1,108)
Other race - Speak only English Native:
59.0% (414)Foreign-born:
10.0% (37)
Other race - Speak another language Native:
49.0% (344)Foreign-born:
92.1% (343)
Two or more races - Speak another language Native:
43.1% (815)Foreign-born:
100.0% (262)
White alone - Speak only English Native:
93.6% (2,737)Foreign-born:
25.3% (71)
White alone - Speak another language Native:
6.4% (188)Foreign-born:
75.3% (211)
Hispanic or Latino - Speak only English Native:
51.9% (924)Foreign-born:
7.8% (52)
Hispanic or Latino - Speak another language Native:
49.1% (874)Foreign-born:
93.0% (614)
Foreign-born residents in Fairview 2,343 residents are foreign born (11.4% Asia , 7.0% Latin America , 2.4% Europe ).
This city:
22.0%California:
100.0%
Marital status for residents in Fairview Marital status - White (Caucasian) population 15 years and over
Males 23.4% Never married55.8% Now married3.8% Separated4.3% Widowed12.8% DivorcedFemales 17.1% Never married61.5% Now married2.3% Separated9.6% Widowed9.4% DivorcedWomen who gave birth in the past 12 months Now married:
100.0% (33)Unmarried:
0.0% (0)
Women who did not give birth in the past 12 months Now married:
56.4% (311)Unmarried:
43.6% (240)
Marital status - Black or African American population 15 years and over
Males 52.5% Never married34.6% Now married0.0% Separated2.4% Widowed10.6% DivorcedFemales 41.5% Never married28.0% Now married0.0% Separated18.4% Widowed12.0% DivorcedWomen who did not give birth in the past 12 months Now married:
22.3% (78)Unmarried:
77.7% (272)
Marital status - American Indian / Alaska Native population 15 years and over
Males 0.0% Never married0.0% Now married0.0% Separated100.0% Widowed0.0% DivorcedFemales 42.9% Never married0.0% Now married0.0% Separated0.0% Widowed57.1% DivorcedWomen who did not give birth in the past 12 months Now married:
0.0% (0)Unmarried:
100.0% (12)
Marital status - Asian population 15 years and over
Males 25.1% Never married66.8% Now married1.0% Separated0.8% Widowed6.2% DivorcedFemales 26.1% Never married55.9% Now married0.0% Separated12.7% Widowed5.3% DivorcedWomen who gave birth in the past 12 months Now married:
100.0% (9)Unmarried:
0.0% (0)
Women who did not give birth in the past 12 months Now married:
45.4% (190)Unmarried:
54.6% (228)
Marital status - Other race population 15 years and over
Males 41.8% Never married29.1% Now married0.0% Separated0.0% Widowed29.1% DivorcedFemales 24.5% Never married30.4% Now married1.3% Separated8.3% Widowed35.5% DivorcedWomen who gave birth in the past 12 months Now married:
100.0% (12)Unmarried:
0.0% (0)
Women who did not give birth in the past 12 months Now married:
19.5% (44)Unmarried:
80.5% (184)
Marital status - Two or more races population 15 years and over
Males 78.3% Never married18.6% Now married3.2% Separated0.0% Widowed0.0% DivorcedFemales 54.0% Never married41.2% Now married1.7% Separated3.1% Widowed0.0% DivorcedWomen who gave birth in the past 12 months Now married:
0.0% (0)Unmarried:
100.0% (110)
Women who did not give birth in the past 12 months Now married:
50.9% (430)Unmarried:
49.1% (416)
Marital status - White alone, not Hispanic / Latino population 15 years and over
Males 21.9% Never married57.7% Now married1.1% Separated5.0% Widowed14.3% DivorcedFemales 16.0% Never married63.3% Now married1.4% Separated10.8% Widowed8.6% DivorcedWomen who gave birth in the past 12 months Now married:
100.0% (39)Unmarried:
0.0% (0)
Women who did not give birth in the past 12 months Now married:
64.2% (325)Unmarried:
35.8% (182)
Marital status - Hispanic or Latino population 15 years and over
Males 39.7% Never married37.4% Now married6.7% Separated0.9% Widowed15.3% DivorcedFemales 33.8% Never married40.6% Now married2.9% Separated6.2% Widowed16.5% DivorcedWomen who did not give birth in the past 12 months Now married:
22.6% (116)Unmarried:
77.4% (398)
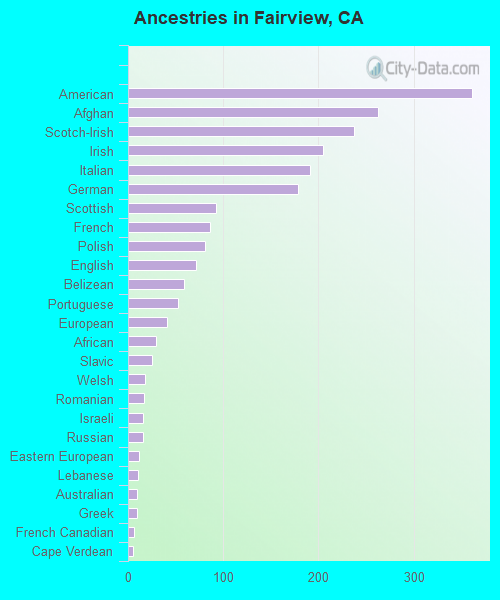
Ancestries in Fairview
262 4.3% American168 2.7% Portuguese148 2.4% Scotch-Irish132 2.2% Irish121 2.0% European99 1.6% German93 1.5% Scottish90 1.5% Ethiopian60 1.0% Haitian59 1.0% Italian47 0.8% Ukrainian46 0.7% Romanian45 0.7% English42 0.7% Swiss34 0.6% Eastern European34 0.6% Russian33 0.5% African25 0.4% French19 0.3% Northern European15 0.2% Armenian14 0.2% Welsh13 0.2% British13 0.2% Cape Verdean13 0.2% Swedish10 0.2% Danish9 0.1% Greek8 0.1% Norwegian6 0.10% Dutch
Geographical mobility in Fairview Same house 1 year ago 3,574 96.6% White (Caucasian)1,964 100.0% Black or African American10 72.1% American Indian / Alaska Native1,861 94.0% Asian1,122 96.6% Other race2,552 94.0% Two or more races3,327 96.9% White alone, not Hispanic / Latino2,487 98.1% Hispanic or LatinoMoved within same county 73 2.0% White / Caucasian29 1.5% Black or African American3 23.9% American Indian / Alaska Native99 5.0% Asian1 91.4% Native Hawaiian / Pacific Islander42 3.6% Other race196 7.2% Two or more races70 2.0% White alone, not Hispanic / Latino53 2.1% Hispanic or LatinoMoved within same state 79 2.1% White / Caucasian5 0.3% Black or African American18 0.9% Asian16 0.6% Two or more races73 2.1% White alone, not Hispanic / Latino20 0.8% Hispanic or LatinoMoved from abroad 12 0.6% Asian
Children Nativity (place of birth) in Fairview
Children under 6 years - Living with two parents Both parents native 306 100.0% NativeBoth parents foreign-born 65 100.0% NativeOne native, one foreign-born parent 145 100.0% NativeChildren under 6 years - Living with one parent Native parent 76 100.0% NativeForeign-born parent 57 100.0% NativeChildren 6 to 17 years - Living with two parents Both parents native 451 100.0% Native0 0.0% Foreign-bornBoth parents foreign-born 91 97.2% Native3 2.8% Foreign-bornOne native, one foreign-born parent 20 100.0% NativeChildren 6 to 17 years - Living with one parent Native parent 238 100.0% NativeForeign-born parent 117 53.4% Native103 46.6% Foreign-born
Grandparents responsible for own grandchildren in Fairview
Grandparents (30 to 59 years) White / Caucasian 7 100.0% Not responsible for grandchildrenBlack or African American 13 100.0% Not responsible for grandchildrenWhite alone, not Hispanic / Latino 11 100.0% Not responsible for grandchildrenGrandparents (60 years and over) White / Caucasian 26 62.2% Responsible for grandchildren16 37.8% Not responsible for grandchildrenBlack or African American 25 100.0% Not responsible for grandchildrenWhite alone, not Hispanic / Latino 27 100.0% Not responsible for grandchildren