Races in Folsom, California (CA) Detailed Stats
Data:
Races - White alone (%)
Races - White alone (% change since 2000)
Races - Black alone (%)
Races - Black alone (% change since 2000)
Races - American Indian alone (%)
Races - American Indian alone (% change since 2000)
Races - Asian alone (%)
Races - Asian alone (% change since 2000)
Races - Hispanic (%)
Races - Hispanic (% change since 2000)
Races - Native Hawaiian and Other Pacific Islander alone (%)
Races - Native Hawaiian and Other Pacific Islander alone (% change since 2000)
Races - Two or more races(%)
Races - Two or more races(% change since 2000)
Races - Other race alone (%)
Races - Other race alone (% change since 2000)
Racial diversity
Place of birth - Born in state of residence (%)
Place of birth - Born in state of residence (%) - White
Place of birth - Born in state of residence (%) - Black or African American
Place of birth - Born in state of residence (%) - Asian
Place of birth - Born in state of residence (%) - Hispanic or Latino
Place of birth - Born in state of residence (%) - American Indian and Alaska Native
Place of birth - Born in state of residence (%) - Multirace
Place of birth - Born in state of residence (%) - Other Race
Place of birth - Born in other state (%)
Place of birth - Born in other state (%) - White
Place of birth - Born in other state (%) - Black or African American
Place of birth - Born in other state (%) - Asian
Place of birth - Born in other state (%) - Hispanic or Latino
Place of birth - Born in other state (%) - American Indian and Alaska Native
Place of birth - Born in other state (%) - Multirace
Place of birth - Born in other state (%) - Other Race
Place of birth - Native, outside of US (%)
Place of birth - Native, outside of US (%) - White
Place of birth - Native, outside of US (%) - Black or African American
Place of birth - Native, outside of US (%) - Asian
Place of birth - Native, outside of US (%) - Hispanic or Latino
Place of birth - Native, outside of US (%) - American Indian and Alaska Native
Place of birth - Native, outside of US (%) - Multirace
Place of birth - Native, outside of US (%) - Other Race
Place of birth - Foreign born (%)
Place of birth - Foreign born (%) - White
Place of birth - Foreign born (%) - Black or African American
Place of birth - Foreign born (%) - Asian
Place of birth - Foreign born (%) - Hispanic or Latino
Place of birth - Foreign born (%) - American Indian and Alaska Native
Place of birth - Foreign born (%) - Multirace
Place of birth - Foreign born (%) - Other Race
Residents speaking English at home (%)
Residents speaking English at home - Born in the United States (%)
Residents speaking English at home - Native, born elsewhere (%)
Residents speaking English at home - Foreign born (%)
Residents speaking Spanish at home (%)
Residents speaking Spanish at home - Born in the United States (%)
Residents speaking Spanish at home - Native, born elsewhere (%)
Residents speaking Spanish at home - Foreign born (%)
Residents speaking other language at home (%)
Residents speaking other language at home - Born in the United States (%)
Residents speaking other language at home - Native, born elsewhere (%)
Residents speaking other language at home - Foreign born (%)
Marital status - Never married (%)
Marital status - Now married (%)
Marital status - Separated (%)
Marital status - Widowed (%)
Marital status - Divorced (%)
Ancestries Reported - Arab (%)
Ancestries Reported - Czech (%)
Ancestries Reported - Danish (%)
Ancestries Reported - Dutch (%)
Ancestries Reported - English (%)
Ancestries Reported - French (%)
Ancestries Reported - French Canadian (%)
Ancestries Reported - German (%)
Ancestries Reported - Greek (%)
Ancestries Reported - Hungarian (%)
Ancestries Reported - Irish (%)
Ancestries Reported - Italian (%)
Ancestries Reported - Lithuanian (%)
Ancestries Reported - Norwegian (%)
Ancestries Reported - Polish (%)
Ancestries Reported - Portuguese (%)
Ancestries Reported - Russian (%)
Ancestries Reported - Scotch-Irish (%)
Ancestries Reported - Scottish (%)
Ancestries Reported - Slovak (%)
Ancestries Reported - Subsaharan African (%)
Ancestries Reported - Swedish (%)
Ancestries Reported - Swiss (%)
Ancestries Reported - Ukrainian (%)
Ancestries Reported - United States (%)
Ancestries Reported - Welsh (%)
Ancestries Reported - West Indian (%)
Ancestries Reported - Other (%)
Geographical mobility - Same house 1 year ago (%)
Geographical mobility - Same house 1 year ago (%) - White
Geographical mobility - Same house 1 year ago (%) - Black or African American
Geographical mobility - Same house 1 year ago (%) - Asian
Geographical mobility - Same house 1 year ago (%) - Hispanic or Latino
Geographical mobility - Same house 1 year ago (%) - American Indian and Alaska Native
Geographical mobility - Same house 1 year ago (%) - Multirace
Geographical mobility - Same house 1 year ago (%) - Other Race
Geographical mobility - Moved within same county (%)
Geographical mobility - Moved within same county (%) - White
Geographical mobility - Moved within same county (%) - Black or African American
Geographical mobility - Moved within same county (%) - Asian
Geographical mobility - Moved within same county (%) - Hispanic or Latino
Geographical mobility - Moved within same county (%) - American Indian and Alaska Native
Geographical mobility - Moved within same county (%) - Multirace
Geographical mobility - Moved within same county (%) - Other Race
Geographical mobility - Moved from different county within same state (%)
Geographical mobility - Moved from different county within same state (%) - White
Geographical mobility - Moved from different county within same state (%) - Black or African American
Geographical mobility - Moved from different county within same state (%) - Asian
Geographical mobility - Moved from different county within same state (%) - Hispanic or Latino
Geographical mobility - Moved from different county within same state (%) - American Indian and Alaska Native
Geographical mobility - Moved from different county within same state (%) - Multirace
Geographical mobility - Moved from different county within same state (%) - Other Race
Geographical mobility - Moved from different state (%)
Geographical mobility - Moved from different state (%) - White
Geographical mobility - Moved from different state (%) - Black or African American
Geographical mobility - Moved from different state (%) - Asian
Geographical mobility - Moved from different state (%) - Hispanic or Latino
Geographical mobility - Moved from different state (%) - American Indian and Alaska Native
Geographical mobility - Moved from different state (%) - Multirace
Geographical mobility - Moved from different state (%) - Other Race
Geographical mobility - Moved from abroad (%)
Geographical mobility - Moved from abroad (%) - White
Geographical mobility - Moved from abroad (%) - Black or African American
Geographical mobility - Moved from abroad (%) - Asian
Geographical mobility - Moved from abroad (%) - Hispanic or Latino
Geographical mobility - Moved from abroad (%) - American Indian and Alaska Native
Geographical mobility - Moved from abroad (%) - Multirace
Geographical mobility - Moved from abroad (%) - Other Race
Place of birth for the foreign-born population - Ireland (%)
Place of birth for the foreign-born population - Denmark (%)
Place of birth for the foreign-born population - Norway (%)
Place of birth for the foreign-born population - Sweden (%)
Place of birth for the foreign-born population - United Kingdom (%)
Place of birth for the foreign-born population - England (%)
Place of birth for the foreign-born population - Scotland (%)
Place of birth for the foreign-born population - Other Northern Europe (%)
Place of birth for the foreign-born population - Austria (%)
Place of birth for the foreign-born population - Belgium (%)
Place of birth for the foreign-born population - France (%)
Place of birth for the foreign-born population - Germany (%)
Place of birth for the foreign-born population - Netherlands (%)
Place of birth for the foreign-born population - Switzerland (%)
Place of birth for the foreign-born population - Other Western Europe (%)
Place of birth for the foreign-born population - Greece (%)
Place of birth for the foreign-born population - Italy (%)
Place of birth for the foreign-born population - Portugal (%)
Place of birth for the foreign-born population - Spain (%)
Place of birth for the foreign-born population - Other Southern Europe (%)
Place of birth for the foreign-born population - Albania (%)
Place of birth for the foreign-born population - Belarus (%)
Place of birth for the foreign-born population - Bosnia and Herzegovina (%)
Place of birth for the foreign-born population - Bulgaria (%)
Place of birth for the foreign-born population - Croatia (%)
Place of birth for the foreign-born population - Czechoslovakia (%)
Place of birth for the foreign-born population - Hungary (%)
Place of birth for the foreign-born population - Latvia (%)
Place of birth for the foreign-born population - Lithuania (%)
Place of birth for the foreign-born population - North Macedonia (Macedonia) (%)
Place of birth for the foreign-born population - Moldova (%)
Place of birth for the foreign-born population - Poland (%)
Place of birth for the foreign-born population - Romania (%)
Place of birth for the foreign-born population - Russia (%)
Place of birth for the foreign-born population - Serbia (%)
Place of birth for the foreign-born population - Ukraine (%)
Place of birth for the foreign-born population - Other Eastern Europe (%)
Place of birth for the foreign-born population - China (%)
Place of birth for the foreign-born population - Hong Kong (%)
Place of birth for the foreign-born population - Taiwan (%)
Place of birth for the foreign-born population - Japan (%)
Place of birth for the foreign-born population - Korea (%)
Place of birth for the foreign-born population - Other Eastern Asia (%)
Place of birth for the foreign-born population - Afghanistan (%)
Place of birth for the foreign-born population - Bangladesh (%)
Place of birth for the foreign-born population - India (%)
Place of birth for the foreign-born population - Iran (%)
Place of birth for the foreign-born population - Kazakhstan (%)
Place of birth for the foreign-born population - Nepal (%)
Place of birth for the foreign-born population - Pakistan (%)
Place of birth for the foreign-born population - Sri Lanka (%)
Place of birth for the foreign-born population - Uzbekistan (%)
Place of birth for the foreign-born population - Other South Central Asia (%)
Place of birth for the foreign-born population - Burma (%)
Place of birth for the foreign-born population - Cambodia (%)
Place of birth for the foreign-born population - Indonesia (%)
Place of birth for the foreign-born population - Laos (%)
Place of birth for the foreign-born population - Malaysia (%)
Place of birth for the foreign-born population - Philippines (%)
Place of birth for the foreign-born population - Singapore (%)
Place of birth for the foreign-born population - Thailand (%)
Place of birth for the foreign-born population - Vietnam (%)
Place of birth for the foreign-born population - Other South Eastern Asia (%)
Place of birth for the foreign-born population - Armenia (%)
Place of birth for the foreign-born population - Iraq (%)
Place of birth for the foreign-born population - Israel (%)
Place of birth for the foreign-born population - Jordan (%)
Place of birth for the foreign-born population - Kuwait (%)
Place of birth for the foreign-born population - Lebanon (%)
Place of birth for the foreign-born population - Saudi Arabia (%)
Place of birth for the foreign-born population - Syria (%)
Place of birth for the foreign-born population - Turkey (%)
Place of birth for the foreign-born population - Yemen (%)
Place of birth for the foreign-born population - Other Western Asia (%)
Place of birth for the foreign-born population - Eritrea (%)
Place of birth for the foreign-born population - Ethiopia (%)
Place of birth for the foreign-born population - Kenya (%)
Place of birth for the foreign-born population - Somalia (%)
Place of birth for the foreign-born population - Uganda (%)
Place of birth for the foreign-born population - Zimbabwe (%)
Place of birth for the foreign-born population - Other Eastern Africa (%)
Place of birth for the foreign-born population - Cameroon (%)
Place of birth for the foreign-born population - Congo (%)
Place of birth for the foreign-born population - Democratic Republic of Congo (Zaire) (%)
Place of birth for the foreign-born population - Other Middle Africa (%)
Place of birth for the foreign-born population - Egypt (%)
Place of birth for the foreign-born population - Morocco (%)
Place of birth for the foreign-born population - Sudan (%)
Place of birth for the foreign-born population - Other Northern Africa (%)
Place of birth for the foreign-born population - South Africa (%)
Place of birth for the foreign-born population - Other Southern Africa (%)
Place of birth for the foreign-born population - Cabo Verde (%)
Place of birth for the foreign-born population - Ghana (%)
Place of birth for the foreign-born population - Liberia (%)
Place of birth for the foreign-born population - Nigeria (%)
Place of birth for the foreign-born population - Senegal (%)
Place of birth for the foreign-born population - Sierra Leone (%)
Place of birth for the foreign-born population - Other Western Africa (%)
Place of birth for the foreign-born population - Australia (%)
Place of birth for the foreign-born population - New Zealand (%)
Place of birth for the foreign-born population - Fiji (%)
Place of birth for the foreign-born population - Micronesia (%)
Place of birth for the foreign-born population - Bahamas (%)
Place of birth for the foreign-born population - Barbados (%)
Place of birth for the foreign-born population - Cuba (%)
Place of birth for the foreign-born population - Dominica (%)
Place of birth for the foreign-born population - Dominican Republic (%)
Place of birth for the foreign-born population - Grenada (%)
Place of birth for the foreign-born population - Haiti (%)
Place of birth for the foreign-born population - Jamaica (%)
Place of birth for the foreign-born population - St. Vincent and the Grenadines (%)
Place of birth for the foreign-born population - Trinidad and Tobago (%)
Place of birth for the foreign-born population - West Indies (%)
Place of birth for the foreign-born population - Other Caribbean (%)
Place of birth for the foreign-born population - Belize (%)
Place of birth for the foreign-born population - Costa Rica (%)
Place of birth for the foreign-born population - El Salvador (%)
Place of birth for the foreign-born population - Guatemala (%)
Place of birth for the foreign-born population - Honduras (%)
Place of birth for the foreign-born population - Mexico (%)
Place of birth for the foreign-born population - Nicaragua (%)
Place of birth for the foreign-born population - Panama (%)
Place of birth for the foreign-born population - Other Central America (%)
Place of birth for the foreign-born population - Argentina (%)
Place of birth for the foreign-born population - Bolivia (%)
Place of birth for the foreign-born population - Brazil (%)
Place of birth for the foreign-born population - Chile (%)
Place of birth for the foreign-born population - Colombia (%)
Place of birth for the foreign-born population - Ecuador (%)
Place of birth for the foreign-born population - Guyana (%)
Place of birth for the foreign-born population - Peru (%)
Place of birth for the foreign-born population - Uruguay (%)
Place of birth for the foreign-born population - Venezuela (%)
Place of birth for the foreign-born population - Other South America (%)
Place of birth for the foreign-born population - Canada (%)
Place of birth for the foreign-born population - Other Northern America (%)
Place of birth for the foreign-born population - Other (%)
Latest news about races in Folsom, CA collected exclusively by city-data.com from local newspapers, TV, and radio stations
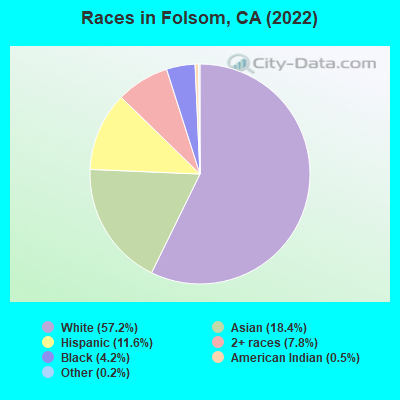
According to 2022 data, the most numerous races in Folsom, CA are Hispanic (7,716 residents), White alone (47,559 residents), and Asian alone (17,304 residents). 77.9% of Folsom residents speak English at home. 16.8% of Folsom, CA residents are foreign-born (11.9% born in Asia, 2.1% born in Latin America, 2.1% born in Europe), which is 54.3% less than the foreign-born rate of 26.0% across the entire state of California.
Race distribution in Folsom
2000 2022
38,500 74.2% White alone 4,914 9.5% Hispanic 3,693 7.1% Asian alone 3,086 5.9% Black alone 1,249 2.4% Two or more races 237 0.5% American Indian alone 112 0.2% Other race alone 93 0.2% Native Hawaiian and Other
47,559 58.4% White alone 17,304 21.2% Asian alone 7,716 9.5% Hispanic 4,314 5.3% Black alone 2,317 2.8% Two or more races 520 0.6% Other race alone 428 0.5% Native Hawaiian and Other
2000 2022
15,816,790 46.7% White alone 10,966,556 32.4% Hispanic 3,648,860 10.8% Asian alone 2,181,926 6.4% Black alone 903,115 2.7% Two or more races 178,984 0.5% American Indian alone 103,736 0.3% Native Hawaiian and Other 71,681 0.2% Other race alone
15,732,184 40.3% Hispanic 13,160,426 33.7% White alone 5,957,867 15.3% Asian alone 2,025,218 5.2% Black alone 1,663,222 4.3% Two or more races 251,618 0.6% Other race alone 135,777 0.3% Native Hawaiian and Other 103,030 0.3% American Indian alone
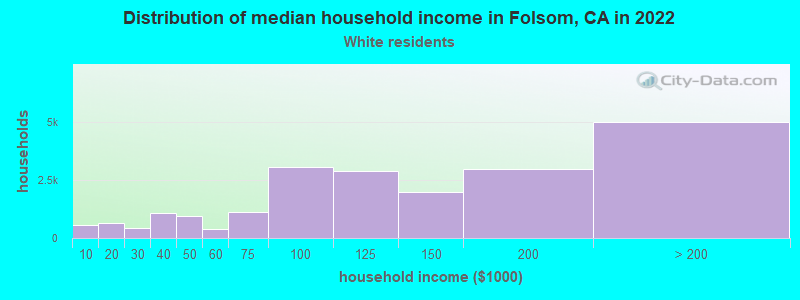
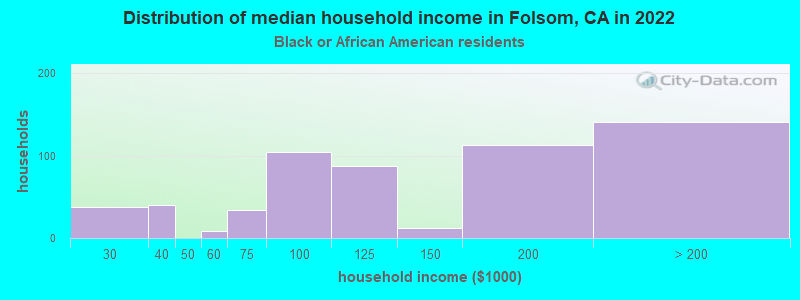
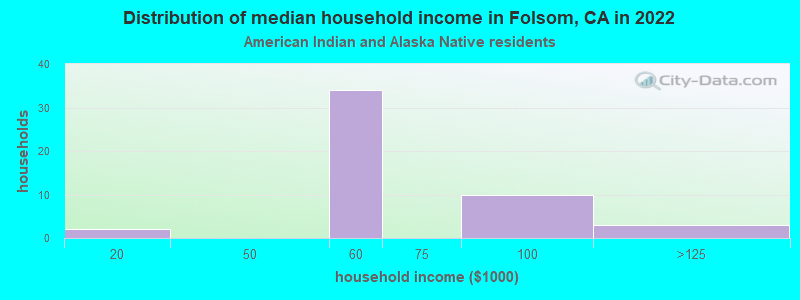
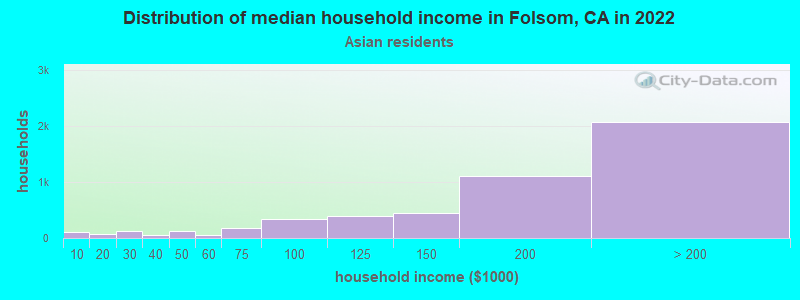
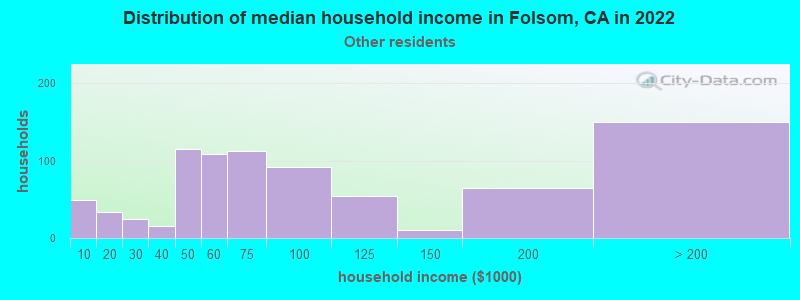
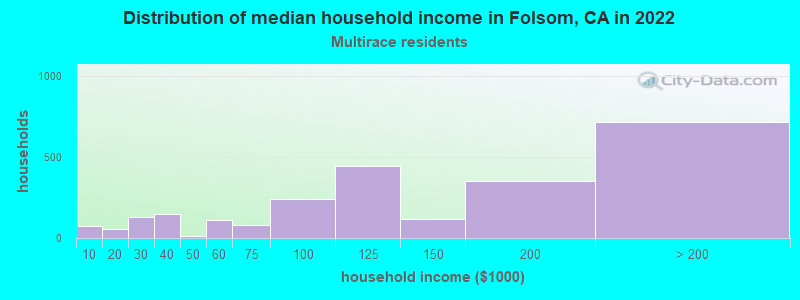
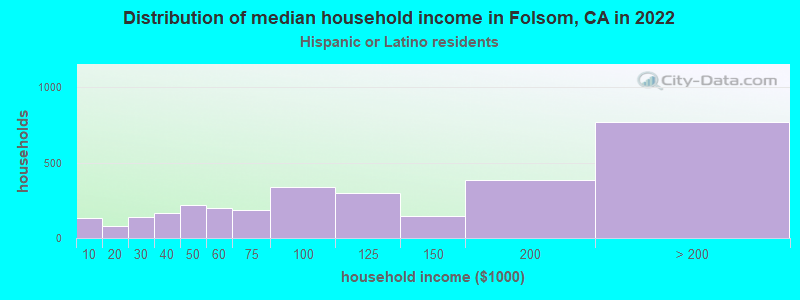
Income and house value in Folsom Median household income in 2022 $133,575 White non-Hispanic householders$113,675 Black householders$65,837 American Indian and Alaska Native householdersover $200,000 Asian householders$38,217 Native Hawaiian and other Pacific Islander householders$156,703 Some other race householders$85,326 Two or more races householders$88,193 Hispanic or Latino race householdersMedian 2022 house value $818,120 White Non-Hispanic householders$909,542 Black or African American householders$708,701 American Indian or Alaska Native householders $880,387 Asian householders$914,941 Native Hawaiian and other Pacific Islander householders$825,678 Some other race householders$737,135 Two or more races householders$810,561 Hispanic or Latino householders
Median age by race in Folsom
43.7 Median age for White residents41.4 45.8 42.8 Median age for Black or African American residents45.1 41.8 34.2 Median age for American Indian / Alaska Native residents43.8 35.3 37.8 Median age for Asian residents40.7 35.4 36.1 Median age for Native Hawaiian / Pacific Islander residents42.7 Median age for Other race residents42.6 45.1 35.8 Median age for Two or more races residents34.2 39.0 42.8 Median age for White alone residents40.1 44.7 39.7 Median age for Hispanic or Latino residents38.6 40.5
Owner/renter occupied households by race in Folsom
House owners and renters - White residents 12,454 68.5% Owner occupied5,720 31.5% Renter occupiedHouse owners and renters - Black or African American residents 93 31.0% Owner occupied206 69.0% Renter occupiedHouse owners and renters - American Indian / Alaska Native residents 76 47.4% Owner occupied85 52.6% Renter occupiedHouse owners and renters - Asian residents 4,140 80.9% Owner occupied978 19.1% Renter occupiedHouse owners and renters - Native Hawaiian / Pacific Islander residents 38 37.7% Owner occupied62 62.3% Renter occupiedHouse owners and renters - Other race residents 280 60.2% Owner occupied185 39.8% Renter occupiedHouse owners and renters - Two or more races residents 1,686 68.0% Owner occupied793 32.0% Renter occupiedHouse owners and renters - White alone residents 12,802 67.5% Owner occupied6,173 32.5% Renter occupiedHouse owners and renters - Hispanic or Latino residents 1,080 61.4% Owner occupied679 38.6% Renter occupied
Language usage in Folsom
English speakers - Total 77.9% of residents of Folsom speak English at home.
5.5% of residents speak Spanish at home 3,062 74.7% Speak English very well1,037 25.3% Speak English less than very well17.3% of residents speak other language at home 10,323 80.1% Speak English very well2,564 19.9% Speak English less than very well
English speakers - Born in the United States 92.4% of residents of Folsom speak English at home.
3.1% of residents speak Spanish at home 451 91.3% Speak English very well43 8.7% Speak English less than very well4.5% of residents speak other language at home 639 90.3% Speak English very well69 9.7% Speak English less than very well
English speakers - Native, born elsewhere 77.8% of residents of Folsom speak English at home.
16.6% of residents speak Spanish at home 135 74.2% Speak English very well47 25.8% Speak English less than very well6.0% of residents speak other language at home 45 68.2% Speak English very well21 31.8% Speak English less than very well
English speakers - Foreign-born 18.9% of residents of Folsom speak English at home.
10.8% of residents speak Spanish at home 703 50.2% Speak English very well697 49.8% Speak English less than very well73.8% of residents speak other language at home 7,403 77.1% Speak English very well2,205 22.9% Speak English less than very well
White (Caucasian) - Speak only English Native:
99.1% (40,077)Foreign-born:
55.6% (1,643)
White (Caucasian) - Speak another language Native:
5.1% (2,061)Foreign-born:
55.8% (1,648)
Black or African American - Speak only English Native:
98.6% (2,371)Foreign-born:
8.0% (11)
Black or African American - Speak another language Native:
0.8% (18)Foreign-born:
100.0% (144)
American Indian / Alaska Native - Speak only English Native:
83.5% (296)Foreign-born:
89.9% (15)
Asian - Speak only English Native:
60.1% (3,558)Foreign-born:
9.4% (1,011)
Asian - Speak another language Native:
40.0% (2,367)Foreign-born:
90.4% (9,762)
Native Hawaiian / Pacific Islander - Speak only English Native:
47.2% (133)Foreign-born:
44.6% (28)
Native Hawaiian / Pacific Islander - Speak another language Native:
50.4% (142)Foreign-born:
50.4% (32)
Other race - Speak only English Native:
61.5% (1,462)Foreign-born:
8.8% (39)
Other race - Speak another language Native:
42.6% (1,011)Foreign-born:
90.2% (404)
Two or more races - Speak only English Native:
67.5% (6,660)Foreign-born:
1.7% (34)
Two or more races - Speak another language Native:
26.2% (2,581)Foreign-born:
100.0% (1,997)
White alone - Speak only English Native:
94.9% (38,636)Foreign-born:
43.8% (1,720)
White alone - Speak another language Native:
5.1% (2,069)Foreign-born:
55.9% (2,192)
Hispanic or Latino - Speak only English Native:
72.0% (4,968)Foreign-born:
10.8% (93)
Hispanic or Latino - Speak another language Native:
30.4% (2,101)Foreign-born:
90.6% (780)
Foreign-born residents in Folsom 13,432 residents are foreign born (11.9% Asia , 2.1% Latin America , 2.1% Europe ).
This city:
16.8%California:
100.0%
Marital status for residents in Folsom Marital status - White (Caucasian) population 15 years and over
Males 32.0% Never married56.9% Now married0.8% Separated1.4% Widowed8.9% DivorcedFemales 22.5% Never married52.8% Now married2.5% Separated7.7% Widowed14.5% DivorcedWomen who gave birth in the past 12 months Now married:
100.0% (372)Unmarried:
0.0% (0)
Women who did not give birth in the past 12 months Now married:
50.9% (4,696)Unmarried:
49.1% (4,526)
Marital status - Black or African American population 15 years and over
Males 48.6% Never married29.5% Now married3.1% Separated1.5% Widowed17.3% DivorcedFemales 41.8% Never married23.4% Now married3.3% Separated4.2% Widowed27.3% DivorcedWomen who gave birth in the past 12 months Now married:
100.0% (13)Unmarried:
0.0% (0)
Women who did not give birth in the past 12 months Now married:
19.3% (37)Unmarried:
80.7% (156)
Marital status - American Indian / Alaska Native population 15 years and over
Males 43.9% Never married25.2% Now married0.0% Separated0.0% Widowed30.9% DivorcedFemales 57.0% Never married25.6% Now married0.0% Separated10.7% Widowed6.6% DivorcedWomen who did not give birth in the past 12 months Now married:
10.1% (10)Unmarried:
89.9% (90)
Marital status - Asian population 15 years and over
Males 24.2% Never married71.4% Now married0.2% Separated0.6% Widowed3.6% DivorcedFemales 19.8% Never married71.8% Now married0.7% Separated4.1% Widowed3.7% DivorcedWomen who gave birth in the past 12 months Now married:
100.0% (201)Unmarried:
0.0% (0)
Women who did not give birth in the past 12 months Now married:
70.8% (2,907)Unmarried:
29.2% (1,201)
Marital status - Native Hawaiian / Pacific Islander population 15 years and over
Males 60.9% Never married23.7% Now married0.0% Separated0.0% Widowed15.4% DivorcedFemales 0.0% Never married100.0% Now married0.0% Separated0.0% Widowed0.0% DivorcedWomen who did not give birth in the past 12 months Now married:
100.0% (6)Unmarried:
0.0% (0)
Marital status - Other race population 15 years and over
Males 51.5% Never married33.4% Now married1.1% Separated0.0% Widowed13.9% DivorcedFemales 35.9% Never married45.1% Now married2.4% Separated4.9% Widowed11.8% DivorcedWomen who did not give birth in the past 12 months Now married:
46.9% (225)Unmarried:
53.1% (255)
Marital status - Two or more races population 15 years and over
Males 35.2% Never married60.0% Now married0.0% Separated0.0% Widowed4.8% DivorcedFemales 35.9% Never married44.8% Now married4.0% Separated0.9% Widowed14.5% DivorcedWomen who gave birth in the past 12 months Now married:
53.2% (164)Unmarried:
46.8% (144)
Women who did not give birth in the past 12 months Now married:
43.6% (1,047)Unmarried:
56.4% (1,356)
Marital status - White alone, not Hispanic / Latino population 15 years and over
Males 29.1% Never married59.4% Now married0.9% Separated1.6% Widowed9.1% DivorcedFemales 20.7% Never married53.8% Now married2.7% Separated8.3% Widowed14.5% DivorcedWomen who gave birth in the past 12 months Now married:
100.0% (443)Unmarried:
0.0% (0)
Women who did not give birth in the past 12 months Now married:
53.1% (5,141)Unmarried:
46.9% (4,544)
Marital status - Hispanic or Latino population 15 years and over
Males 47.4% Never married44.7% Now married0.0% Separated0.0% Widowed8.0% DivorcedFemales 35.1% Never married45.6% Now married0.0% Separated4.7% Widowed14.5% DivorcedWomen who gave birth in the past 12 months Now married:
91.7% (106)Unmarried:
8.3% (10)
Women who did not give birth in the past 12 months Now married:
50.4% (1,139)Unmarried:
49.6% (1,122)
Ancestries in Folsom
4,514 11.3% European2,081 5.2% English1,825 4.6% German1,789 4.5% Irish1,342 3.4% Italian1,331 3.3% American722 1.8% Iranian526 1.3% Portuguese431 1.1% Polish373 0.9% Norwegian327 0.8% Swedish280 0.7% Scandinavian280 0.7% British242 0.6% Scottish237 0.6% Northern European218 0.5% Jordanian216 0.5% French166 0.4% Russian156 0.4% Armenian155 0.4% Greek144 0.4% Ukrainian126 0.3% Scotch-Irish119 0.3% Romanian116 0.3% Eastern European105 0.3% Danish83 0.2% Hungarian82 0.2% Dutch68 0.2% Welsh64 0.2% Swiss60 0.2% French Canadian60 0.2% Turkish57 0.1% Czechoslovakian51 0.1% Canadian45 0.1% Slovak43 0.1% Lebanese31 0.08% Afghan31 0.08% Serbian28 0.07% Egyptian27 0.07% Palestinian26 0.07% Austrian23 0.06% Czech23 0.06% Lithuanian22 0.06% Assyrian21 0.05% Cajun20 0.05% Yugoslavian17 0.04% Slavic16 0.04% Brazilian14 0.04% Basque14 0.04% Ethiopian13 0.03% Arab12 0.03% Belgian10 0.03% African9 0.02% Syrian9 0.02% South African8 0.02% Slovene8 0.02% Croatian7 0.02% Finnish6 0.02% Maltese
Geographical mobility in Folsom Same house 1 year ago 35,747 80.5% White (Caucasian)2,549 59.1% Black or African American335 82.0% American Indian / Alaska Native12,485 85.6% Asian147 39.4% Native Hawaiian / Pacific Islander1,938 71.5% Other race11,768 93.9% Two or more races39,815 87.6% White alone, not Hispanic / Latino8,243 85.2% Hispanic or LatinoMoved within same county 3,609 8.1% White / Caucasian526 12.2% Black or African American18 4.3% American Indian / Alaska Native1,020 7.0% Asian192 51.4% Native Hawaiian / Pacific Islander90 3.3% Other race617 4.9% Two or more races2,744 6.0% White alone, not Hispanic / Latino469 4.9% Hispanic or LatinoMoved within same state 3,367 7.6% White / Caucasian375 8.7% Black or African American34 8.2% American Indian / Alaska Native470 3.2% Asian17 4.7% Native Hawaiian / Pacific Islander656 24.2% Other race255 2.0% Two or more races2,376 5.2% White alone, not Hispanic / Latino779 8.1% Hispanic or LatinoMoved from different state 1,459 3.3% White / Caucasian779 18.0% Black or African American137 0.9% Asian28 1.0% Other race57 0.5% Two or more races510 1.1% White alone, not Hispanic / Latino118 1.2% Hispanic or LatinoMoved from abroad 253 0.6% White328 2.2% Asian15 0.6% Other race50 0.4% Two or more races108 0.2% White alone, not Hispanic / Latino73 0.8% Hispanic or Latino
Children Nativity (place of birth) in Folsom
Children under 6 years - Living with two parents Both parents native 3,257 100.0% NativeBoth parents foreign-born 470 83.1% Native96 16.9% Foreign-bornOne native, one foreign-born parent 260 100.0% NativeChildren under 6 years - Living with one parent Native parent 426 100.0% NativeChildren 6 to 17 years - Living with two parents Both parents native 6,453 100.0% NativeBoth parents foreign-born 2,821 78.3% Native782 21.7% Foreign-bornOne native, one foreign-born parent 2,047 100.0% NativeChildren 6 to 17 years - Living with one parent Native parent 973 96.3% Native37 3.7% Foreign-bornForeign-born parent 203 70.9% Native84 29.1% Foreign-born
Place of birth for residents in Folsom 9,395 Asia5,453 South Central Asia2,154 Americas1,970 South Eastern Asia1,710 Eastern Asia1,698 Latin America1,690 Europe1,423 Central America1,209 China617 Eastern Europe477 Western Europe455 Northern America422 Northern Europe261 Western Asia239 South America165 Southern Europe139 Oceania52 Africa36 Caribbean31 Australia and New Zealand Subregion23 Eastern Africa21 Northern Africa8 Southern Africa4,467 India1,153 Philippines936 Mexico737 China662 Iran580 Vietnam455 Canada346 Korea309 Hong Kong215 El Salvador208 England185 Germany163 Russia162 Taiwan158 Poland156 France154 Japan146 Italy123 Malaysia122 Ukraine120 United Kingdom108 Jordan107 Honduras97 Bangladesh97 Pakistan84 Fiji80 Switzerland71 Panama68 Sri Lanka65 Venezuela60 Romania52 Nicaragua52 Israel45 Afghanistan44 Brazil42 Ireland41 Colombia39 Ecuador38 Guatemala36 Bulgaria35 Thailand33 Moldova30 Czechoslovakia26 Lebanon25 Indonesia23 Austria21 Belgium21 Peru20 Singapore20 Kuwait19 Australia19 Cambodia18 Iraq18 Sweden18 Denmark14 Kazakhstan14 Saudi Arabia14 Argentina13 Ethiopia12 Laos12 Chile12 New Zealand10 Netherlands10 Zimbabwe9 Greece9 Portugal9 Azores Islands8 South Africa7 Cuba3 Belarus
Grandparents responsible for own grandchildren in Folsom
Grandparents (30 to 59 years) White / Caucasian 32 31.3% Responsible for grandchildren70 68.7% Not responsible for grandchildrenAsian 14 100.0% Not responsible for grandchildrenTwo or more races 11 6.7% Responsible for grandchildren147 93.3% Not responsible for grandchildrenWhite alone, not Hispanic / Latino 38 29.1% Responsible for grandchildren92 70.9% Not responsible for grandchildrenHispanic or Latino 9 100.0% Not responsible for grandchildrenGrandparents (60 years and over) White / Caucasian 34 12.5% Responsible for grandchildren241 87.5% Not responsible for grandchildrenAsian 12 3.8% Responsible for grandchildren305 96.2% Not responsible for grandchildrenTwo or more races 71 30.2% Responsible for grandchildren163 69.8% Not responsible for grandchildrenWhite alone, not Hispanic / Latino 32 8.5% Responsible for grandchildren342 91.5% Not responsible for grandchildrenHispanic or Latino 14 18.1% Responsible for grandchildren64 81.9% Not responsible for grandchildren