Races in Fort Benning South, Georgia (GA) Detailed Stats
Ancestries, Foreign-born residents, place of birth

Discuss Fort Benning South, Georgia races on our local forum with over 2,400,000 registered users
6.9% of Fort Benning South, GA residents are foreign-born (3.5% born in Latin America, 1.5% born in Europe, 1.3% born in Asia), which is 45.6% less than the foreign-born rate of 10.0% across the entire state of Georgia.
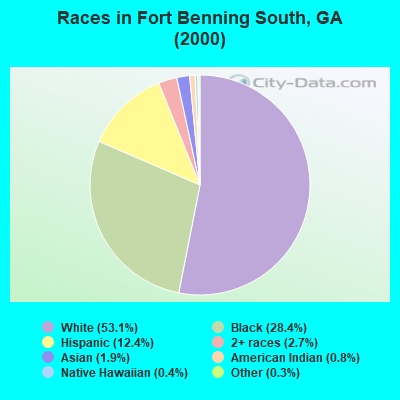
Race distribution in Fort Benning South

- 6,22953.1%White alone
- 3,33528.4%Black alone
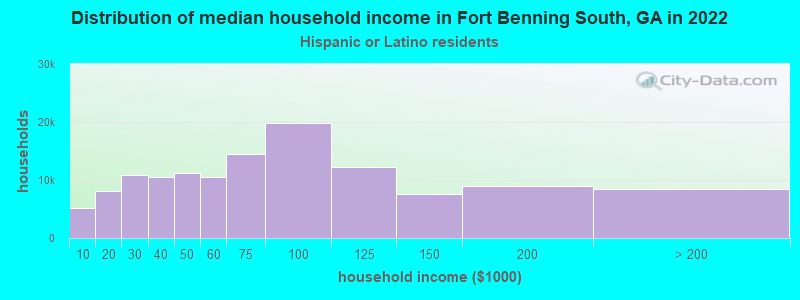
- 1,46112.4%Hispanic
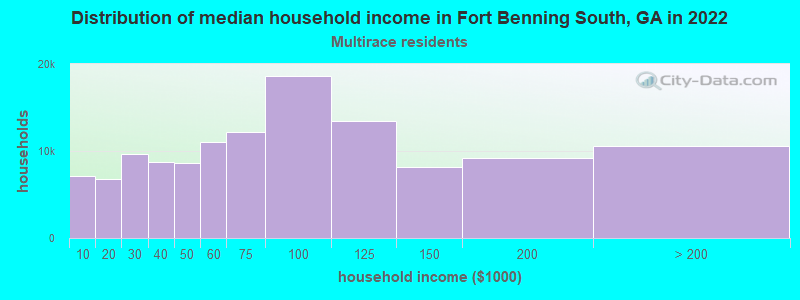
- 3182.7%Two or more races
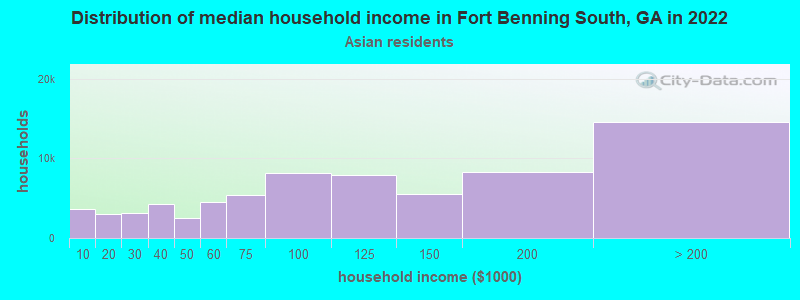
- 2261.9%Asian alone
- 890.8%American Indian alone
- 490.4%Native Hawaiian and Other
Pacific Islander alone - 300.3%Other race alone
2000
2022
-
- 5,128,66162.6%White alone
- 2,331,46528.5%Black alone
- 435,2275.3%Hispanic
- 171,5132.1%Asian alone
- 87,3641.1%Two or more races
- 17,6700.2%American Indian alone
- 11,2750.1%Other race alone
- 3,2780.04%Native Hawaiian and Other
Pacific Islander alone

-
- 5,415,65749.6%White alone
- 3,349,24030.7%Black alone
- 1,132,60410.4%Hispanic
- 479,1564.4%Asian alone
- 462,9234.2%Two or more races
- 54,4160.5%Other race alone
- 11,9230.1%American Indian alone
- 6,9570.06%Native Hawaiian and Other
Pacific Islander alone

Income and house value in Fort Benning South
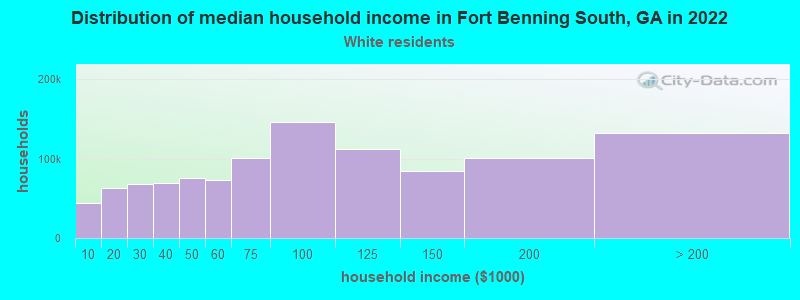
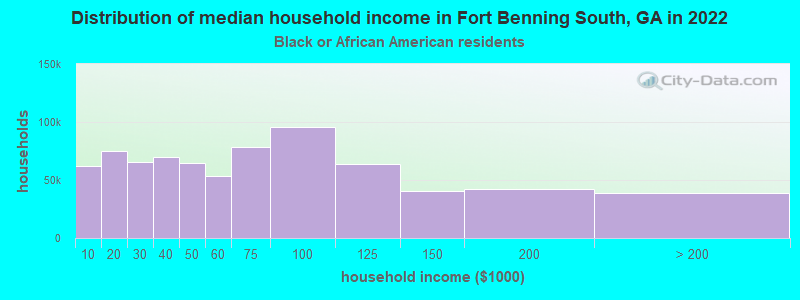
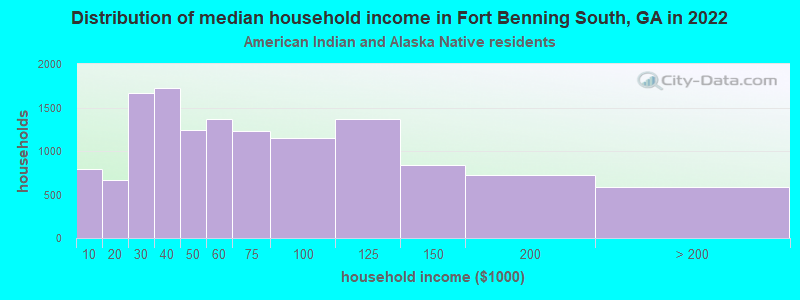
- Median household income in 2022
- $77,806White non-Hispanic householders
- $67,958Black householders
- $51,281American Indian and Alaska Native householders
- $88,480Asian householders
- $47,634Some other race householders
- $67,808Two or more races householders
- $55,367Hispanic or Latino race householders
- Median 2022 house value
- $314,156White Non-Hispanic householders
- over $1,000,000Black or African American householders
Household income for White non-Hispanic householders
Household income for Black householders
Household income for American Indian and Alaska Native householders
Household income for Asian householders
Household income for Two or more races householders
Household income for Hispanic or Latino race householders
Foreign-born residents in Fort Benning South
806 residents are foreign born (3.5% Latin America, 1.5% Europe, 1.3% Asia).
| This city: | 6.9% |
| Georgia: | 7.1% |
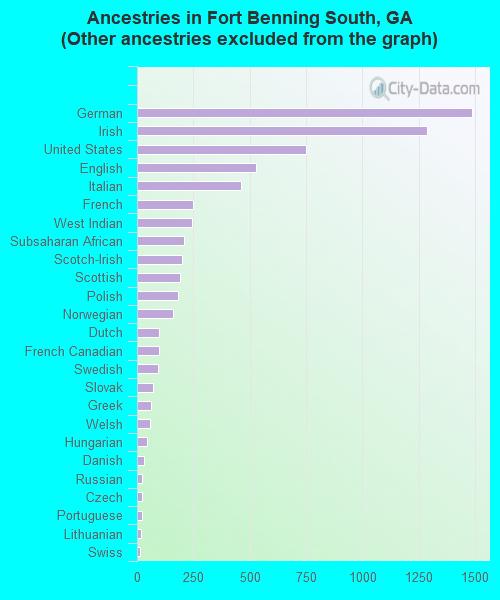
Ancestries in Fort Benning South

- 5,74146.5%Other
- 1,48812.1%German
- 1,28910.4%Irish
- 7506.1%United States
- 5304.3%English
- 4603.7%Italian
- 2502.0%French
- 2442.0%West Indian
- 2101.7%Subsaharan African
- 1991.6%Scotch-Irish
- 1921.6%Scottish
- 1801.5%Polish
- 1581.3%Norwegian
- 970.8%Dutch
- 970.8%French Canadian
- 910.7%Swedish
- 730.6%Slovak
- 640.5%Greek
- 560.5%Welsh
- 460.4%Hungarian
- 300.2%Danish
- 230.2%Russian
- 220.2%Czech
- 200.2%Portuguese
- 180.1%Lithuanian
- 140.1%Swiss
Zip codes: 31905.