Races in Fort Morgan, Colorado (CO) Detailed Stats
Data:
Races - White alone (%)
Races - White alone (% change since 2000)
Races - Black alone (%)
Races - Black alone (% change since 2000)
Races - American Indian alone (%)
Races - American Indian alone (% change since 2000)
Races - Asian alone (%)
Races - Asian alone (% change since 2000)
Races - Hispanic (%)
Races - Hispanic (% change since 2000)
Races - Native Hawaiian and Other Pacific Islander alone (%)
Races - Native Hawaiian and Other Pacific Islander alone (% change since 2000)
Races - Two or more races(%)
Races - Two or more races(% change since 2000)
Races - Other race alone (%)
Races - Other race alone (% change since 2000)
Racial diversity
Place of birth - Born in state of residence (%)
Place of birth - Born in state of residence (%) - White
Place of birth - Born in state of residence (%) - Black or African American
Place of birth - Born in state of residence (%) - Asian
Place of birth - Born in state of residence (%) - Hispanic or Latino
Place of birth - Born in state of residence (%) - American Indian and Alaska Native
Place of birth - Born in state of residence (%) - Multirace
Place of birth - Born in state of residence (%) - Other Race
Place of birth - Born in other state (%)
Place of birth - Born in other state (%) - White
Place of birth - Born in other state (%) - Black or African American
Place of birth - Born in other state (%) - Asian
Place of birth - Born in other state (%) - Hispanic or Latino
Place of birth - Born in other state (%) - American Indian and Alaska Native
Place of birth - Born in other state (%) - Multirace
Place of birth - Born in other state (%) - Other Race
Place of birth - Native, outside of US (%)
Place of birth - Native, outside of US (%) - White
Place of birth - Native, outside of US (%) - Black or African American
Place of birth - Native, outside of US (%) - Asian
Place of birth - Native, outside of US (%) - Hispanic or Latino
Place of birth - Native, outside of US (%) - American Indian and Alaska Native
Place of birth - Native, outside of US (%) - Multirace
Place of birth - Native, outside of US (%) - Other Race
Place of birth - Foreign born (%)
Place of birth - Foreign born (%) - White
Place of birth - Foreign born (%) - Black or African American
Place of birth - Foreign born (%) - Asian
Place of birth - Foreign born (%) - Hispanic or Latino
Place of birth - Foreign born (%) - American Indian and Alaska Native
Place of birth - Foreign born (%) - Multirace
Place of birth - Foreign born (%) - Other Race
Residents speaking English at home (%)
Residents speaking English at home - Born in the United States (%)
Residents speaking English at home - Native, born elsewhere (%)
Residents speaking English at home - Foreign born (%)
Residents speaking Spanish at home (%)
Residents speaking Spanish at home - Born in the United States (%)
Residents speaking Spanish at home - Native, born elsewhere (%)
Residents speaking Spanish at home - Foreign born (%)
Residents speaking other language at home (%)
Residents speaking other language at home - Born in the United States (%)
Residents speaking other language at home - Native, born elsewhere (%)
Residents speaking other language at home - Foreign born (%)
Marital status - Never married (%)
Marital status - Now married (%)
Marital status - Separated (%)
Marital status - Widowed (%)
Marital status - Divorced (%)
Ancestries Reported - Arab (%)
Ancestries Reported - Czech (%)
Ancestries Reported - Danish (%)
Ancestries Reported - Dutch (%)
Ancestries Reported - English (%)
Ancestries Reported - French (%)
Ancestries Reported - French Canadian (%)
Ancestries Reported - German (%)
Ancestries Reported - Greek (%)
Ancestries Reported - Hungarian (%)
Ancestries Reported - Irish (%)
Ancestries Reported - Italian (%)
Ancestries Reported - Lithuanian (%)
Ancestries Reported - Norwegian (%)
Ancestries Reported - Polish (%)
Ancestries Reported - Portuguese (%)
Ancestries Reported - Russian (%)
Ancestries Reported - Scotch-Irish (%)
Ancestries Reported - Scottish (%)
Ancestries Reported - Slovak (%)
Ancestries Reported - Subsaharan African (%)
Ancestries Reported - Swedish (%)
Ancestries Reported - Swiss (%)
Ancestries Reported - Ukrainian (%)
Ancestries Reported - United States (%)
Ancestries Reported - Welsh (%)
Ancestries Reported - West Indian (%)
Ancestries Reported - Other (%)
Geographical mobility - Same house 1 year ago (%)
Geographical mobility - Same house 1 year ago (%) - White
Geographical mobility - Same house 1 year ago (%) - Black or African American
Geographical mobility - Same house 1 year ago (%) - Asian
Geographical mobility - Same house 1 year ago (%) - Hispanic or Latino
Geographical mobility - Same house 1 year ago (%) - American Indian and Alaska Native
Geographical mobility - Same house 1 year ago (%) - Multirace
Geographical mobility - Same house 1 year ago (%) - Other Race
Geographical mobility - Moved within same county (%)
Geographical mobility - Moved within same county (%) - White
Geographical mobility - Moved within same county (%) - Black or African American
Geographical mobility - Moved within same county (%) - Asian
Geographical mobility - Moved within same county (%) - Hispanic or Latino
Geographical mobility - Moved within same county (%) - American Indian and Alaska Native
Geographical mobility - Moved within same county (%) - Multirace
Geographical mobility - Moved within same county (%) - Other Race
Geographical mobility - Moved from different county within same state (%)
Geographical mobility - Moved from different county within same state (%) - White
Geographical mobility - Moved from different county within same state (%) - Black or African American
Geographical mobility - Moved from different county within same state (%) - Asian
Geographical mobility - Moved from different county within same state (%) - Hispanic or Latino
Geographical mobility - Moved from different county within same state (%) - American Indian and Alaska Native
Geographical mobility - Moved from different county within same state (%) - Multirace
Geographical mobility - Moved from different county within same state (%) - Other Race
Geographical mobility - Moved from different state (%)
Geographical mobility - Moved from different state (%) - White
Geographical mobility - Moved from different state (%) - Black or African American
Geographical mobility - Moved from different state (%) - Asian
Geographical mobility - Moved from different state (%) - Hispanic or Latino
Geographical mobility - Moved from different state (%) - American Indian and Alaska Native
Geographical mobility - Moved from different state (%) - Multirace
Geographical mobility - Moved from different state (%) - Other Race
Geographical mobility - Moved from abroad (%)
Geographical mobility - Moved from abroad (%) - White
Geographical mobility - Moved from abroad (%) - Black or African American
Geographical mobility - Moved from abroad (%) - Asian
Geographical mobility - Moved from abroad (%) - Hispanic or Latino
Geographical mobility - Moved from abroad (%) - American Indian and Alaska Native
Geographical mobility - Moved from abroad (%) - Multirace
Geographical mobility - Moved from abroad (%) - Other Race
Place of birth for the foreign-born population - Ireland (%)
Place of birth for the foreign-born population - Denmark (%)
Place of birth for the foreign-born population - Norway (%)
Place of birth for the foreign-born population - Sweden (%)
Place of birth for the foreign-born population - United Kingdom (%)
Place of birth for the foreign-born population - England (%)
Place of birth for the foreign-born population - Scotland (%)
Place of birth for the foreign-born population - Other Northern Europe (%)
Place of birth for the foreign-born population - Austria (%)
Place of birth for the foreign-born population - Belgium (%)
Place of birth for the foreign-born population - France (%)
Place of birth for the foreign-born population - Germany (%)
Place of birth for the foreign-born population - Netherlands (%)
Place of birth for the foreign-born population - Switzerland (%)
Place of birth for the foreign-born population - Other Western Europe (%)
Place of birth for the foreign-born population - Greece (%)
Place of birth for the foreign-born population - Italy (%)
Place of birth for the foreign-born population - Portugal (%)
Place of birth for the foreign-born population - Spain (%)
Place of birth for the foreign-born population - Other Southern Europe (%)
Place of birth for the foreign-born population - Albania (%)
Place of birth for the foreign-born population - Belarus (%)
Place of birth for the foreign-born population - Bosnia and Herzegovina (%)
Place of birth for the foreign-born population - Bulgaria (%)
Place of birth for the foreign-born population - Croatia (%)
Place of birth for the foreign-born population - Czechoslovakia (%)
Place of birth for the foreign-born population - Hungary (%)
Place of birth for the foreign-born population - Latvia (%)
Place of birth for the foreign-born population - Lithuania (%)
Place of birth for the foreign-born population - North Macedonia (Macedonia) (%)
Place of birth for the foreign-born population - Moldova (%)
Place of birth for the foreign-born population - Poland (%)
Place of birth for the foreign-born population - Romania (%)
Place of birth for the foreign-born population - Russia (%)
Place of birth for the foreign-born population - Serbia (%)
Place of birth for the foreign-born population - Ukraine (%)
Place of birth for the foreign-born population - Other Eastern Europe (%)
Place of birth for the foreign-born population - China (%)
Place of birth for the foreign-born population - Hong Kong (%)
Place of birth for the foreign-born population - Taiwan (%)
Place of birth for the foreign-born population - Japan (%)
Place of birth for the foreign-born population - Korea (%)
Place of birth for the foreign-born population - Other Eastern Asia (%)
Place of birth for the foreign-born population - Afghanistan (%)
Place of birth for the foreign-born population - Bangladesh (%)
Place of birth for the foreign-born population - India (%)
Place of birth for the foreign-born population - Iran (%)
Place of birth for the foreign-born population - Kazakhstan (%)
Place of birth for the foreign-born population - Nepal (%)
Place of birth for the foreign-born population - Pakistan (%)
Place of birth for the foreign-born population - Sri Lanka (%)
Place of birth for the foreign-born population - Uzbekistan (%)
Place of birth for the foreign-born population - Other South Central Asia (%)
Place of birth for the foreign-born population - Burma (%)
Place of birth for the foreign-born population - Cambodia (%)
Place of birth for the foreign-born population - Indonesia (%)
Place of birth for the foreign-born population - Laos (%)
Place of birth for the foreign-born population - Malaysia (%)
Place of birth for the foreign-born population - Philippines (%)
Place of birth for the foreign-born population - Singapore (%)
Place of birth for the foreign-born population - Thailand (%)
Place of birth for the foreign-born population - Vietnam (%)
Place of birth for the foreign-born population - Other South Eastern Asia (%)
Place of birth for the foreign-born population - Armenia (%)
Place of birth for the foreign-born population - Iraq (%)
Place of birth for the foreign-born population - Israel (%)
Place of birth for the foreign-born population - Jordan (%)
Place of birth for the foreign-born population - Kuwait (%)
Place of birth for the foreign-born population - Lebanon (%)
Place of birth for the foreign-born population - Saudi Arabia (%)
Place of birth for the foreign-born population - Syria (%)
Place of birth for the foreign-born population - Turkey (%)
Place of birth for the foreign-born population - Yemen (%)
Place of birth for the foreign-born population - Other Western Asia (%)
Place of birth for the foreign-born population - Eritrea (%)
Place of birth for the foreign-born population - Ethiopia (%)
Place of birth for the foreign-born population - Kenya (%)
Place of birth for the foreign-born population - Somalia (%)
Place of birth for the foreign-born population - Uganda (%)
Place of birth for the foreign-born population - Zimbabwe (%)
Place of birth for the foreign-born population - Other Eastern Africa (%)
Place of birth for the foreign-born population - Cameroon (%)
Place of birth for the foreign-born population - Congo (%)
Place of birth for the foreign-born population - Democratic Republic of Congo (Zaire) (%)
Place of birth for the foreign-born population - Other Middle Africa (%)
Place of birth for the foreign-born population - Egypt (%)
Place of birth for the foreign-born population - Morocco (%)
Place of birth for the foreign-born population - Sudan (%)
Place of birth for the foreign-born population - Other Northern Africa (%)
Place of birth for the foreign-born population - South Africa (%)
Place of birth for the foreign-born population - Other Southern Africa (%)
Place of birth for the foreign-born population - Cabo Verde (%)
Place of birth for the foreign-born population - Ghana (%)
Place of birth for the foreign-born population - Liberia (%)
Place of birth for the foreign-born population - Nigeria (%)
Place of birth for the foreign-born population - Senegal (%)
Place of birth for the foreign-born population - Sierra Leone (%)
Place of birth for the foreign-born population - Other Western Africa (%)
Place of birth for the foreign-born population - Australia (%)
Place of birth for the foreign-born population - New Zealand (%)
Place of birth for the foreign-born population - Fiji (%)
Place of birth for the foreign-born population - Micronesia (%)
Place of birth for the foreign-born population - Bahamas (%)
Place of birth for the foreign-born population - Barbados (%)
Place of birth for the foreign-born population - Cuba (%)
Place of birth for the foreign-born population - Dominica (%)
Place of birth for the foreign-born population - Dominican Republic (%)
Place of birth for the foreign-born population - Grenada (%)
Place of birth for the foreign-born population - Haiti (%)
Place of birth for the foreign-born population - Jamaica (%)
Place of birth for the foreign-born population - St. Vincent and the Grenadines (%)
Place of birth for the foreign-born population - Trinidad and Tobago (%)
Place of birth for the foreign-born population - West Indies (%)
Place of birth for the foreign-born population - Other Caribbean (%)
Place of birth for the foreign-born population - Belize (%)
Place of birth for the foreign-born population - Costa Rica (%)
Place of birth for the foreign-born population - El Salvador (%)
Place of birth for the foreign-born population - Guatemala (%)
Place of birth for the foreign-born population - Honduras (%)
Place of birth for the foreign-born population - Mexico (%)
Place of birth for the foreign-born population - Nicaragua (%)
Place of birth for the foreign-born population - Panama (%)
Place of birth for the foreign-born population - Other Central America (%)
Place of birth for the foreign-born population - Argentina (%)
Place of birth for the foreign-born population - Bolivia (%)
Place of birth for the foreign-born population - Brazil (%)
Place of birth for the foreign-born population - Chile (%)
Place of birth for the foreign-born population - Colombia (%)
Place of birth for the foreign-born population - Ecuador (%)
Place of birth for the foreign-born population - Guyana (%)
Place of birth for the foreign-born population - Peru (%)
Place of birth for the foreign-born population - Uruguay (%)
Place of birth for the foreign-born population - Venezuela (%)
Place of birth for the foreign-born population - Other South America (%)
Place of birth for the foreign-born population - Canada (%)
Place of birth for the foreign-born population - Other Northern America (%)
Place of birth for the foreign-born population - Other (%)
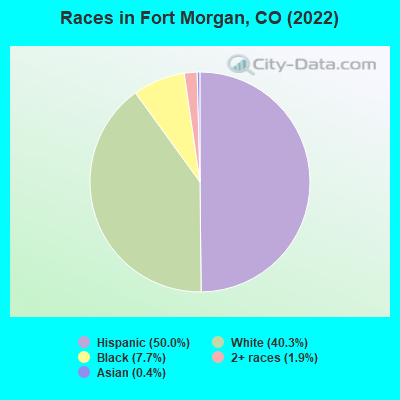
According to 2022 data, the most numerous races in Fort Morgan, CO are White alone (4,437 residents), Hispanic (6,461 residents), and Two or more races (275 residents). 59.5% of Fort Morgan residents speak English at home. 23.6% of Fort Morgan, CO residents are foreign-born (18.2% born in Latin America, 5.1% born in Africa), which is 61.9% greater than the foreign-born rate of 9.0% across the entire state of Colorado.
Race distribution in Fort Morgan
2000 2022
3,202,880 74.5% White alone 735,601 17.1% Hispanic 158,443 3.7% Black alone 93,277 2.2% Asian alone 72,721 1.7% Two or more races 28,982 0.7% American Indian alone 5,512 0.1% Other race alone 3,845 0.09% Native Hawaiian and Other
3,793,270 65.0% White alone 1,314,962 22.5% Hispanic 268,754 4.6% Two or more races 220,756 3.8% Black alone 182,658 3.1% Asian alone 29,798 0.5% Other race alone 23,389 0.4% American Indian alone 6,339 0.1% Native Hawaiian and Other
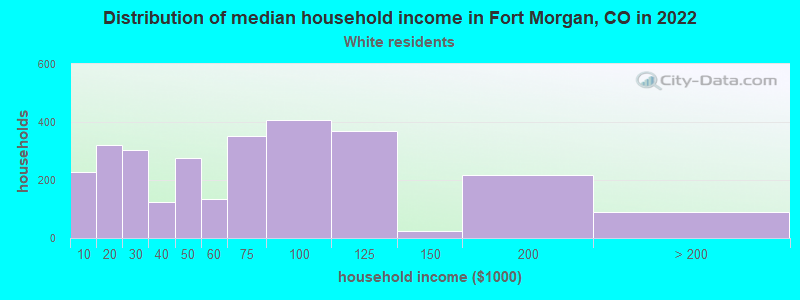
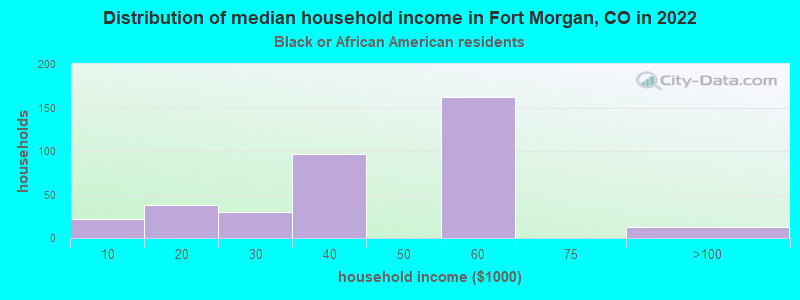
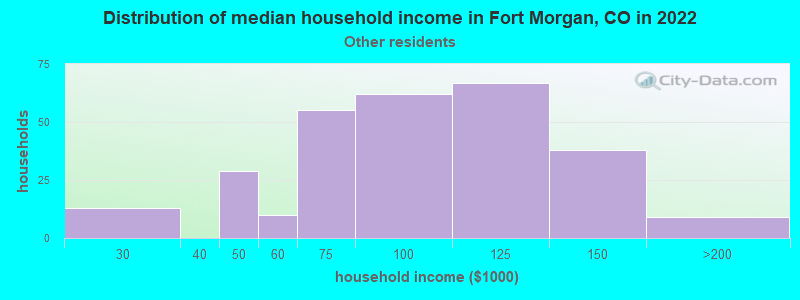
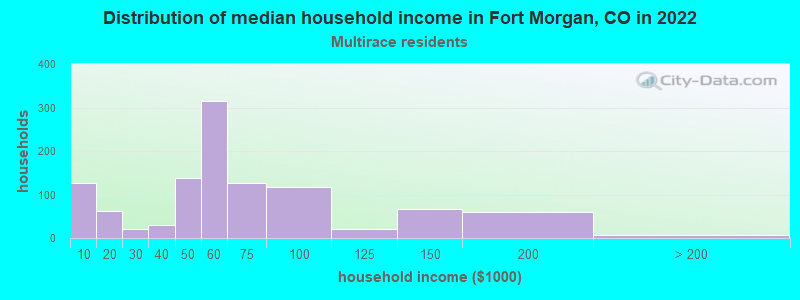
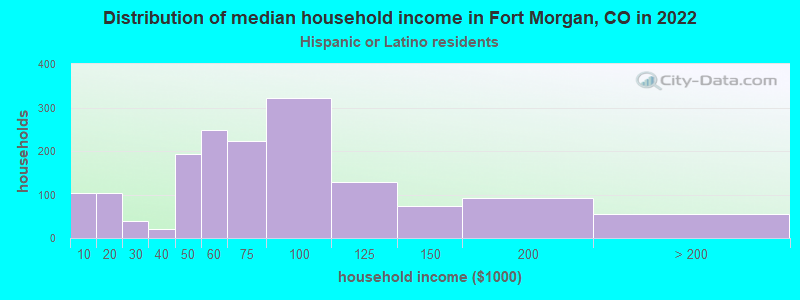
Income and house value in Fort Morgan Median household income in 2022 $65,240 White non-Hispanic householders$44,090 Black householders$50,291 American Indian and Alaska Native householders$95,068 Some other race householders$70,214 Two or more races householders$83,576 Hispanic or Latino race householdersMedian 2022 house value $333,057 White Non-Hispanic householders$215,624 American Indian or Alaska Native householders$268,037 Some other race householders$281,970 Two or more races householders$265,384 Hispanic or Latino householders
Median age by race in Fort Morgan
34.2 Median age for White residents33.9 35.9 20.1 Median age for Black or African American residents18.8 42.9 35.3 Median age for American Indian / Alaska Native residents31.1 Median age for Asian residents34.0 28.2 35.7 Median age for Other race residents38.8 32.1 41.9 Median age for Two or more races residents38.7 44.7 42.8 Median age for White alone residents40.0 47.9 28.0 Median age for Hispanic or Latino residents28.2 27.2
Owner/renter occupied households by race in Fort Morgan
House owners and renters - White residents 2,094 61.6% Owner occupied1,303 38.4% Renter occupiedHouse owners and renters - Black or African American residents 20 6.1% Owner occupied307 93.9% Renter occupiedHouse owners and renters - Asian residents 11 100.0% Renter occupiedHouse owners and renters - Other race residents 257 86.9% Owner occupied39 13.1% Renter occupiedHouse owners and renters - Two or more races residents 405 39.8% Owner occupied613 60.2% Renter occupiedHouse owners and renters - White alone residents 1,313 61.8% Owner occupied813 38.2% Renter occupiedHouse owners and renters - Hispanic or Latino residents 1,330 65.9% Owner occupied688 34.1% Renter occupied
Language usage in Fort Morgan
English speakers - Total 59.5% of residents of Fort Morgan speak English at home.
29.7% of residents speak Spanish at home 1,826 55.8% Speak English very well1,444 44.2% Speak English less than very well9.2% of residents speak other language at home 403 39.7% Speak English very well613 60.3% Speak English less than very well
English speakers - Born in the United States 71.3% of residents of Fort Morgan speak English at home.
26.0% of residents speak Spanish at home 840 98.0% Speak English very well17 2.0% Speak English less than very well2.7% of residents speak other language at home 90 100.0% Speak English very well
English speakers - Native, born elsewhere 69.2% of residents of Fort Morgan speak English at home.
31.8% of residents speak Spanish at home 11 32.4% Speak English very well23 67.6% Speak English less than very well
English speakers - Foreign-born 9.5% of residents of Fort Morgan speak English at home.
56.8% of residents speak Spanish at home 281 17.5% Speak English very well1,322 82.5% Speak English less than very well31.5% of residents speak other language at home 277 31.1% Speak English very well613 68.9% Speak English less than very well
White (Caucasian) - Speak only English Native:
80.6% (5,406)Foreign-born:
12.3% (148)
White (Caucasian) - Speak another language Native:
15.2% (1,017)Foreign-born:
80.8% (977)
Black or African American - Speak only English Native:
55.0% (127)Foreign-born:
13.5% (107)
Black or African American - Speak another language Native:
55.3% (127)Foreign-born:
87.3% (691)
Other race - Speak another language Native:
45.8% (246)Foreign-born:
95.1% (231)
Two or more races - Speak another language Native:
39.2% (507)Foreign-born:
100.0% (612)
White alone - Speak only English Native:
99.3% (4,126)Foreign-born:
12.4% (6)
White alone - Speak another language Native:
0.9% (38)Foreign-born:
84.3% (43)
Hispanic or Latino - Speak only English Native:
53.5% (2,115)Foreign-born:
11.6% (229)
Hispanic or Latino - Speak another language Native:
45.2% (1,787)Foreign-born:
90.0% (1,771)
Foreign-born residents in Fort Morgan 2,834 residents are foreign born (18.2% Latin America , 5.1% Africa ).
This city:
23.6%Colorado:
100.0%
Marital status for residents in Fort Morgan Marital status - White (Caucasian) population 15 years and over
Males 27.7% Never married52.8% Now married4.6% Separated2.9% Widowed12.0% DivorcedFemales 22.5% Never married44.9% Now married4.4% Separated12.7% Widowed15.4% DivorcedWomen who gave birth in the past 12 months Now married:
100.0% (109)Unmarried:
0.0% (0)
Women who did not give birth in the past 12 months Now married:
47.9% (916)Unmarried:
52.1% (997)
Marital status - Black or African American population 15 years and over
Males 67.8% Never married26.8% Now married3.8% Separated0.0% Widowed1.6% DivorcedFemales 14.4% Never married28.4% Now married6.6% Separated44.0% Widowed6.6% DivorcedWomen who did not give birth in the past 12 months Now married:
50.0% (88)Unmarried:
50.0% (88)
Marital status - Asian population 15 years and over
Males 0.0% Never married100.0% Now married0.0% Separated0.0% Widowed0.0% DivorcedFemales 30.6% Never married69.4% Now married0.0% Separated0.0% Widowed0.0% DivorcedWomen who did not give birth in the past 12 months Now married:
57.7% (17)Unmarried:
42.3% (12)
Marital status - Other race population 15 years and over
Males 23.7% Never married71.5% Now married0.0% Separated0.0% Widowed4.8% DivorcedFemales 17.2% Never married78.8% Now married3.9% Separated0.0% Widowed0.0% DivorcedWomen who gave birth in the past 12 months Now married:
100.0% (7)Unmarried:
0.0% (0)
Women who did not give birth in the past 12 months Now married:
86.1% (175)Unmarried:
13.9% (28)
Marital status - Two or more races population 15 years and over
Males 32.5% Never married50.0% Now married0.0% Separated0.0% Widowed17.5% DivorcedFemales 14.8% Never married26.6% Now married0.0% Separated16.4% Widowed42.2% DivorcedWomen who did not give birth in the past 12 months Now married:
31.3% (259)Unmarried:
68.7% (567)
Marital status - White alone, not Hispanic / Latino population 15 years and over
Males 28.1% Never married47.7% Now married2.5% Separated5.9% Widowed15.8% DivorcedFemales 16.9% Never married46.4% Now married1.0% Separated16.4% Widowed19.4% DivorcedWomen who gave birth in the past 12 months Now married:
100.0% (73)Unmarried:
0.0% (0)
Women who did not give birth in the past 12 months Now married:
43.2% (333)Unmarried:
56.8% (438)
Marital status - Hispanic or Latino population 15 years and over
Males 27.4% Never married59.6% Now married5.5% Separated0.0% Widowed7.4% DivorcedFemales 27.0% Never married46.6% Now married7.2% Separated8.7% Widowed10.5% DivorcedWomen who gave birth in the past 12 months Now married:
100.0% (54)Unmarried:
0.0% (0)
Women who did not give birth in the past 12 months Now married:
54.4% (938)Unmarried:
45.6% (786)
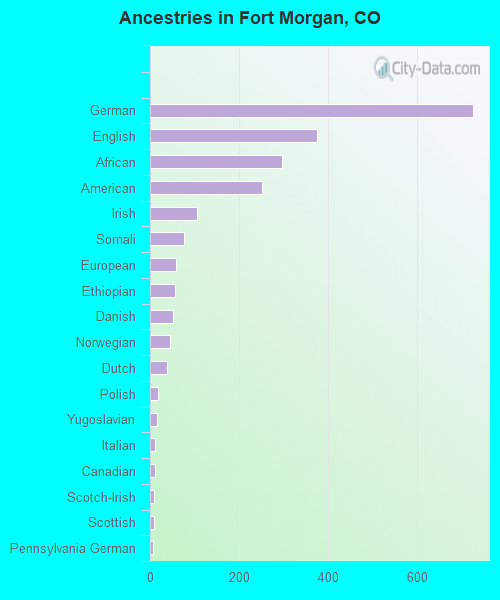
Ancestries in Fort Morgan
663 10.1% German366 5.6% Somali195 3.0% American126 1.9% African114 1.7% English85 1.3% Irish80 1.2% European53 0.8% Norwegian51 0.8% Dutch44 0.7% Russian36 0.5% Ethiopian33 0.5% Swedish32 0.5% Jamaican25 0.4% Scottish14 0.2% Welsh11 0.2% Polish11 0.2% Portuguese10 0.2% French10 0.2% Romanian7 0.1% Czech5 0.08% Iranian4 0.06% Canadian3 0.05% Scotch-Irish2 0.03% Celtic2 0.03% Pennsylvania German
Children Nativity (place of birth) in Fort Morgan
Children under 6 years - Living with two parents Both parents native 480 100.0% NativeBoth parents foreign-born 118 100.0% NativeOne native, one foreign-born parent 35 100.0% NativeChildren under 6 years - Living with one parent Native parent 145 100.0% NativeForeign-born parent 44 100.0% NativeChildren 6 to 17 years - Living with two parents Both parents native 673 99.0% Native6 1.0% Foreign-bornBoth parents foreign-born 273 85.2% Native47 14.8% Foreign-bornOne native, one foreign-born parent 60 100.0% NativeChildren 6 to 17 years - Living with one parent Native parent 339 96.2% Native13 3.8% Foreign-bornForeign-born parent 449 65.5% Native237 34.5% Foreign-born
Grandparents responsible for own grandchildren in Fort Morgan
Grandparents (30 to 59 years) White / Caucasian 38 41.0% Responsible for grandchildren55 59.0% Not responsible for grandchildrenAsian 12 100.0% Not responsible for grandchildrenWhite alone, not Hispanic / Latino 38 69.9% Responsible for grandchildren16 30.1% Not responsible for grandchildrenHispanic or Latino 50 100.0% Not responsible for grandchildrenGrandparents (60 years and over) White / Caucasian 8 4.6% Responsible for grandchildren160 95.4% Not responsible for grandchildrenAsian 8 100.0% Not responsible for grandchildrenWhite alone, not Hispanic / Latino 10 42.0% Responsible for grandchildren13 58.0% Not responsible for grandchildrenHispanic or Latino 22 14.1% Responsible for grandchildren131 85.9% Not responsible for grandchildren