Races in Fort Stockton, Texas (TX) Detailed Stats
Data:
Races - White alone (%)
Races - White alone (% change since 2000)
Races - Black alone (%)
Races - Black alone (% change since 2000)
Races - American Indian alone (%)
Races - American Indian alone (% change since 2000)
Races - Asian alone (%)
Races - Asian alone (% change since 2000)
Races - Hispanic (%)
Races - Hispanic (% change since 2000)
Races - Native Hawaiian and Other Pacific Islander alone (%)
Races - Native Hawaiian and Other Pacific Islander alone (% change since 2000)
Races - Two or more races(%)
Races - Two or more races(% change since 2000)
Races - Other race alone (%)
Races - Other race alone (% change since 2000)
Racial diversity
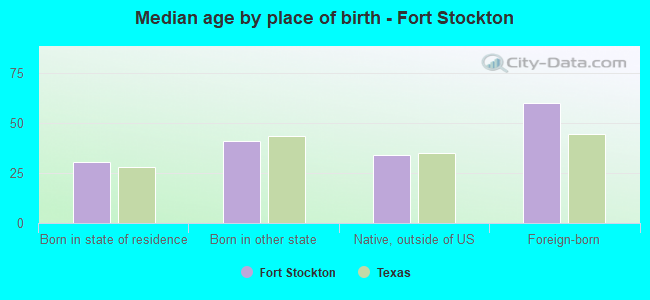
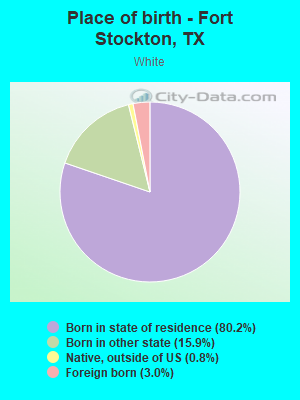
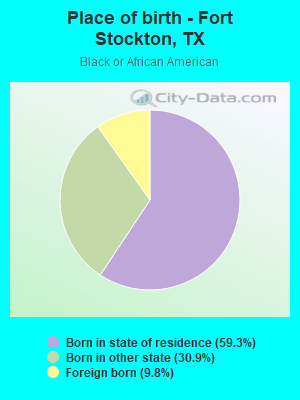
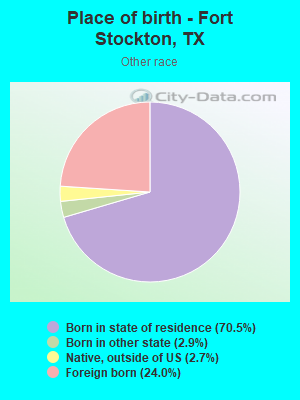
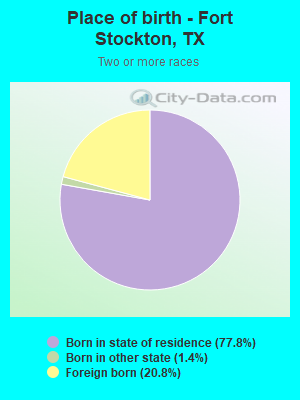
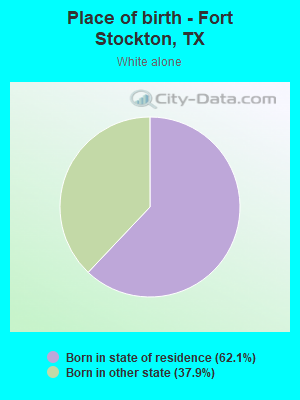
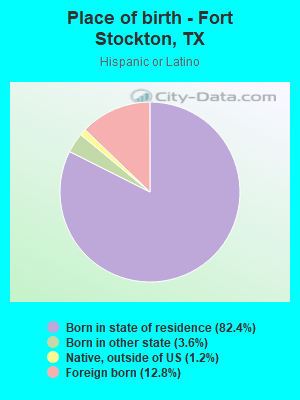
Place of birth - Born in state of residence (%)
Place of birth - Born in state of residence (%) - White
Place of birth - Born in state of residence (%) - Black or African American
Place of birth - Born in state of residence (%) - Asian
Place of birth - Born in state of residence (%) - Hispanic or Latino
Place of birth - Born in state of residence (%) - American Indian and Alaska Native
Place of birth - Born in state of residence (%) - Multirace
Place of birth - Born in state of residence (%) - Other Race
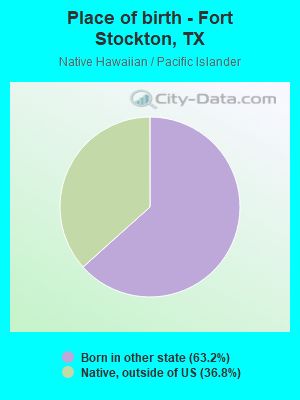
Place of birth - Born in other state (%)
Place of birth - Born in other state (%) - White
Place of birth - Born in other state (%) - Black or African American
Place of birth - Born in other state (%) - Asian
Place of birth - Born in other state (%) - Hispanic or Latino
Place of birth - Born in other state (%) - American Indian and Alaska Native
Place of birth - Born in other state (%) - Multirace
Place of birth - Born in other state (%) - Other Race
Place of birth - Native, outside of US (%)
Place of birth - Native, outside of US (%) - White
Place of birth - Native, outside of US (%) - Black or African American
Place of birth - Native, outside of US (%) - Asian
Place of birth - Native, outside of US (%) - Hispanic or Latino
Place of birth - Native, outside of US (%) - American Indian and Alaska Native
Place of birth - Native, outside of US (%) - Multirace
Place of birth - Native, outside of US (%) - Other Race
Place of birth - Foreign born (%)
Place of birth - Foreign born (%) - White
Place of birth - Foreign born (%) - Black or African American
Place of birth - Foreign born (%) - Asian
Place of birth - Foreign born (%) - Hispanic or Latino
Place of birth - Foreign born (%) - American Indian and Alaska Native
Place of birth - Foreign born (%) - Multirace
Place of birth - Foreign born (%) - Other Race
Residents speaking English at home (%)
Residents speaking English at home - Born in the United States (%)
Residents speaking English at home - Native, born elsewhere (%)
Residents speaking English at home - Foreign born (%)
Residents speaking Spanish at home (%)
Residents speaking Spanish at home - Born in the United States (%)
Residents speaking Spanish at home - Native, born elsewhere (%)
Residents speaking Spanish at home - Foreign born (%)
Residents speaking other language at home (%)
Residents speaking other language at home - Born in the United States (%)
Residents speaking other language at home - Native, born elsewhere (%)
Residents speaking other language at home - Foreign born (%)
Marital status - Never married (%)
Marital status - Now married (%)
Marital status - Separated (%)
Marital status - Widowed (%)
Marital status - Divorced (%)
Ancestries Reported - Arab (%)
Ancestries Reported - Czech (%)
Ancestries Reported - Danish (%)
Ancestries Reported - Dutch (%)
Ancestries Reported - English (%)
Ancestries Reported - French (%)
Ancestries Reported - French Canadian (%)
Ancestries Reported - German (%)
Ancestries Reported - Greek (%)
Ancestries Reported - Hungarian (%)
Ancestries Reported - Irish (%)
Ancestries Reported - Italian (%)
Ancestries Reported - Lithuanian (%)
Ancestries Reported - Norwegian (%)
Ancestries Reported - Polish (%)
Ancestries Reported - Portuguese (%)
Ancestries Reported - Russian (%)
Ancestries Reported - Scotch-Irish (%)
Ancestries Reported - Scottish (%)
Ancestries Reported - Slovak (%)
Ancestries Reported - Subsaharan African (%)
Ancestries Reported - Swedish (%)
Ancestries Reported - Swiss (%)
Ancestries Reported - Ukrainian (%)
Ancestries Reported - United States (%)
Ancestries Reported - Welsh (%)
Ancestries Reported - West Indian (%)
Ancestries Reported - Other (%)
Geographical mobility - Same house 1 year ago (%)
Geographical mobility - Same house 1 year ago (%) - White
Geographical mobility - Same house 1 year ago (%) - Black or African American
Geographical mobility - Same house 1 year ago (%) - Asian
Geographical mobility - Same house 1 year ago (%) - Hispanic or Latino
Geographical mobility - Same house 1 year ago (%) - American Indian and Alaska Native
Geographical mobility - Same house 1 year ago (%) - Multirace
Geographical mobility - Same house 1 year ago (%) - Other Race
Geographical mobility - Moved within same county (%)
Geographical mobility - Moved within same county (%) - White
Geographical mobility - Moved within same county (%) - Black or African American
Geographical mobility - Moved within same county (%) - Asian
Geographical mobility - Moved within same county (%) - Hispanic or Latino
Geographical mobility - Moved within same county (%) - American Indian and Alaska Native
Geographical mobility - Moved within same county (%) - Multirace
Geographical mobility - Moved within same county (%) - Other Race
Geographical mobility - Moved from different county within same state (%)
Geographical mobility - Moved from different county within same state (%) - White
Geographical mobility - Moved from different county within same state (%) - Black or African American
Geographical mobility - Moved from different county within same state (%) - Asian
Geographical mobility - Moved from different county within same state (%) - Hispanic or Latino
Geographical mobility - Moved from different county within same state (%) - American Indian and Alaska Native
Geographical mobility - Moved from different county within same state (%) - Multirace
Geographical mobility - Moved from different county within same state (%) - Other Race
Geographical mobility - Moved from different state (%)
Geographical mobility - Moved from different state (%) - White
Geographical mobility - Moved from different state (%) - Black or African American
Geographical mobility - Moved from different state (%) - Asian
Geographical mobility - Moved from different state (%) - Hispanic or Latino
Geographical mobility - Moved from different state (%) - American Indian and Alaska Native
Geographical mobility - Moved from different state (%) - Multirace
Geographical mobility - Moved from different state (%) - Other Race
Geographical mobility - Moved from abroad (%)
Geographical mobility - Moved from abroad (%) - White
Geographical mobility - Moved from abroad (%) - Black or African American
Geographical mobility - Moved from abroad (%) - Asian
Geographical mobility - Moved from abroad (%) - Hispanic or Latino
Geographical mobility - Moved from abroad (%) - American Indian and Alaska Native
Geographical mobility - Moved from abroad (%) - Multirace
Geographical mobility - Moved from abroad (%) - Other Race
Place of birth for the foreign-born population - Ireland (%)
Place of birth for the foreign-born population - Denmark (%)
Place of birth for the foreign-born population - Norway (%)
Place of birth for the foreign-born population - Sweden (%)
Place of birth for the foreign-born population - United Kingdom (%)
Place of birth for the foreign-born population - England (%)
Place of birth for the foreign-born population - Scotland (%)
Place of birth for the foreign-born population - Other Northern Europe (%)
Place of birth for the foreign-born population - Austria (%)
Place of birth for the foreign-born population - Belgium (%)
Place of birth for the foreign-born population - France (%)
Place of birth for the foreign-born population - Germany (%)
Place of birth for the foreign-born population - Netherlands (%)
Place of birth for the foreign-born population - Switzerland (%)
Place of birth for the foreign-born population - Other Western Europe (%)
Place of birth for the foreign-born population - Greece (%)
Place of birth for the foreign-born population - Italy (%)
Place of birth for the foreign-born population - Portugal (%)
Place of birth for the foreign-born population - Spain (%)
Place of birth for the foreign-born population - Other Southern Europe (%)
Place of birth for the foreign-born population - Albania (%)
Place of birth for the foreign-born population - Belarus (%)
Place of birth for the foreign-born population - Bosnia and Herzegovina (%)
Place of birth for the foreign-born population - Bulgaria (%)
Place of birth for the foreign-born population - Croatia (%)
Place of birth for the foreign-born population - Czechoslovakia (%)
Place of birth for the foreign-born population - Hungary (%)
Place of birth for the foreign-born population - Latvia (%)
Place of birth for the foreign-born population - Lithuania (%)
Place of birth for the foreign-born population - North Macedonia (Macedonia) (%)
Place of birth for the foreign-born population - Moldova (%)
Place of birth for the foreign-born population - Poland (%)
Place of birth for the foreign-born population - Romania (%)
Place of birth for the foreign-born population - Russia (%)
Place of birth for the foreign-born population - Serbia (%)
Place of birth for the foreign-born population - Ukraine (%)
Place of birth for the foreign-born population - Other Eastern Europe (%)
Place of birth for the foreign-born population - China (%)
Place of birth for the foreign-born population - Hong Kong (%)
Place of birth for the foreign-born population - Taiwan (%)
Place of birth for the foreign-born population - Japan (%)
Place of birth for the foreign-born population - Korea (%)
Place of birth for the foreign-born population - Other Eastern Asia (%)
Place of birth for the foreign-born population - Afghanistan (%)
Place of birth for the foreign-born population - Bangladesh (%)
Place of birth for the foreign-born population - India (%)
Place of birth for the foreign-born population - Iran (%)
Place of birth for the foreign-born population - Kazakhstan (%)
Place of birth for the foreign-born population - Nepal (%)
Place of birth for the foreign-born population - Pakistan (%)
Place of birth for the foreign-born population - Sri Lanka (%)
Place of birth for the foreign-born population - Uzbekistan (%)
Place of birth for the foreign-born population - Other South Central Asia (%)
Place of birth for the foreign-born population - Burma (%)
Place of birth for the foreign-born population - Cambodia (%)
Place of birth for the foreign-born population - Indonesia (%)
Place of birth for the foreign-born population - Laos (%)
Place of birth for the foreign-born population - Malaysia (%)
Place of birth for the foreign-born population - Philippines (%)
Place of birth for the foreign-born population - Singapore (%)
Place of birth for the foreign-born population - Thailand (%)
Place of birth for the foreign-born population - Vietnam (%)
Place of birth for the foreign-born population - Other South Eastern Asia (%)
Place of birth for the foreign-born population - Armenia (%)
Place of birth for the foreign-born population - Iraq (%)
Place of birth for the foreign-born population - Israel (%)
Place of birth for the foreign-born population - Jordan (%)
Place of birth for the foreign-born population - Kuwait (%)
Place of birth for the foreign-born population - Lebanon (%)
Place of birth for the foreign-born population - Saudi Arabia (%)
Place of birth for the foreign-born population - Syria (%)
Place of birth for the foreign-born population - Turkey (%)
Place of birth for the foreign-born population - Yemen (%)
Place of birth for the foreign-born population - Other Western Asia (%)
Place of birth for the foreign-born population - Eritrea (%)
Place of birth for the foreign-born population - Ethiopia (%)
Place of birth for the foreign-born population - Kenya (%)
Place of birth for the foreign-born population - Somalia (%)
Place of birth for the foreign-born population - Uganda (%)
Place of birth for the foreign-born population - Zimbabwe (%)
Place of birth for the foreign-born population - Other Eastern Africa (%)
Place of birth for the foreign-born population - Cameroon (%)
Place of birth for the foreign-born population - Congo (%)
Place of birth for the foreign-born population - Democratic Republic of Congo (Zaire) (%)
Place of birth for the foreign-born population - Other Middle Africa (%)
Place of birth for the foreign-born population - Egypt (%)
Place of birth for the foreign-born population - Morocco (%)
Place of birth for the foreign-born population - Sudan (%)
Place of birth for the foreign-born population - Other Northern Africa (%)
Place of birth for the foreign-born population - South Africa (%)
Place of birth for the foreign-born population - Other Southern Africa (%)
Place of birth for the foreign-born population - Cabo Verde (%)
Place of birth for the foreign-born population - Ghana (%)
Place of birth for the foreign-born population - Liberia (%)
Place of birth for the foreign-born population - Nigeria (%)
Place of birth for the foreign-born population - Senegal (%)
Place of birth for the foreign-born population - Sierra Leone (%)
Place of birth for the foreign-born population - Other Western Africa (%)
Place of birth for the foreign-born population - Australia (%)
Place of birth for the foreign-born population - New Zealand (%)
Place of birth for the foreign-born population - Fiji (%)
Place of birth for the foreign-born population - Micronesia (%)
Place of birth for the foreign-born population - Bahamas (%)
Place of birth for the foreign-born population - Barbados (%)
Place of birth for the foreign-born population - Cuba (%)
Place of birth for the foreign-born population - Dominica (%)
Place of birth for the foreign-born population - Dominican Republic (%)
Place of birth for the foreign-born population - Grenada (%)
Place of birth for the foreign-born population - Haiti (%)
Place of birth for the foreign-born population - Jamaica (%)
Place of birth for the foreign-born population - St. Vincent and the Grenadines (%)
Place of birth for the foreign-born population - Trinidad and Tobago (%)
Place of birth for the foreign-born population - West Indies (%)
Place of birth for the foreign-born population - Other Caribbean (%)
Place of birth for the foreign-born population - Belize (%)
Place of birth for the foreign-born population - Costa Rica (%)
Place of birth for the foreign-born population - El Salvador (%)
Place of birth for the foreign-born population - Guatemala (%)
Place of birth for the foreign-born population - Honduras (%)
Place of birth for the foreign-born population - Mexico (%)
Place of birth for the foreign-born population - Nicaragua (%)
Place of birth for the foreign-born population - Panama (%)
Place of birth for the foreign-born population - Other Central America (%)
Place of birth for the foreign-born population - Argentina (%)
Place of birth for the foreign-born population - Bolivia (%)
Place of birth for the foreign-born population - Brazil (%)
Place of birth for the foreign-born population - Chile (%)
Place of birth for the foreign-born population - Colombia (%)
Place of birth for the foreign-born population - Ecuador (%)
Place of birth for the foreign-born population - Guyana (%)
Place of birth for the foreign-born population - Peru (%)
Place of birth for the foreign-born population - Uruguay (%)
Place of birth for the foreign-born population - Venezuela (%)
Place of birth for the foreign-born population - Other South America (%)
Place of birth for the foreign-born population - Canada (%)
Place of birth for the foreign-born population - Other Northern America (%)
Place of birth for the foreign-born population - Other (%)
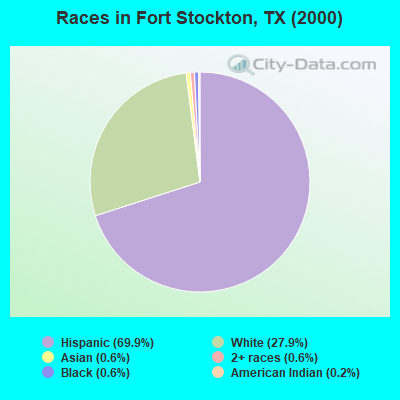
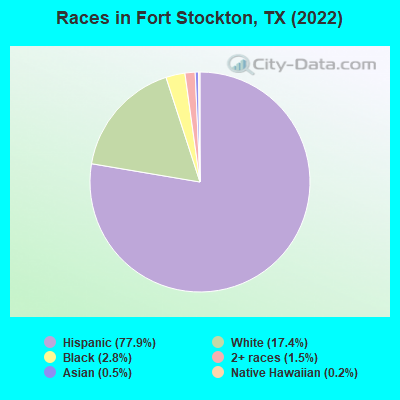
According to 2022 data, the most numerous races in Fort Stockton, TX are Hispanic (6,723 residents), White alone (1,500 residents), and Black alone (242 residents). 50.7% of Fort Stockton residents speak English at home. 10.9% of Fort Stockton, TX residents are foreign-born (9.9% born in Latin America), which is 56.2% less than the foreign-born rate of 17.0% across the entire state of Texas.
Race distribution in Fort Stockton
2000 2022
10,933,313 52.4% White alone 6,669,666 32.0% Hispanic 2,364,255 11.3% Black alone 554,445 2.7% Asian alone 230,567 1.1% Two or more races 68,859 0.3% American Indian alone 19,958 0.10% Other race alone 10,757 0.05% Native Hawaiian and Other
12,070,642 40.2% Hispanic 11,683,430 38.9% White alone 3,508,706 11.7% Black alone 1,608,173 5.4% Asian alone 956,560 3.2% Two or more races 125,763 0.4% Other race alone 47,023 0.2% American Indian alone 29,275 0.10% Native Hawaiian and Other
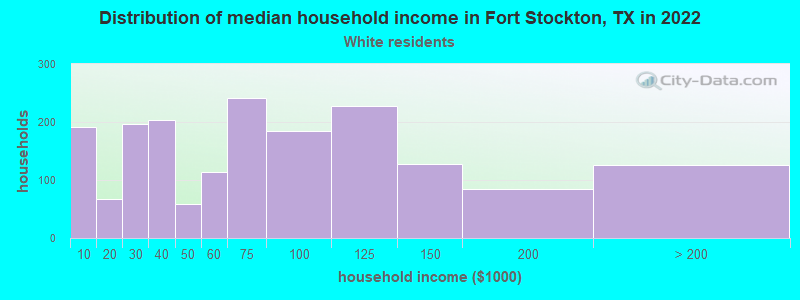
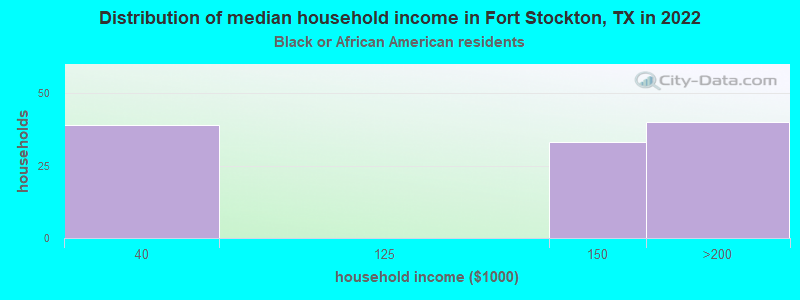
Income and house value in Fort Stockton Median household income in 2022 $87,805 White non-Hispanic householders$144,638 Black householders$28,513 Some other race householders$84,822 Two or more races householders$56,965 Hispanic or Latino race householdersMedian 2022 house value $307,760 White Non-Hispanic householdersover $1,000,000 Black or African American householders$130,206 American Indian or Alaska Native householders over $1,000,000 Asian householders$171,399 Some other race householders$86,646 Two or more races householders$168,558 Hispanic or Latino householders
Median age by race in Fort Stockton
34.9 Median age for White residents35.4 34.2 42.6 Median age for Black or African American residents43.0 24.0 -684,418,145.3 Median age for American Indian / Alaska Native residents-682,445,758.7 -684,418,145.3 -681,278,538.1 Median age for Asian residents-683,426,442.5 -679,245,282.3 -581,560,283.1 Median age for Native Hawaiian / Pacific Islander residents-612,729,233.5 -577,777,777.2 31.8 Median age for Other race residents16.7 44.5 38.0 Median age for Two or more races residents39.9 34.8 45.5 Median age for White alone residents42.8 48.3 30.6 Median age for Hispanic or Latino residents30.2 31.8
Owner/renter occupied households by race in Fort Stockton
House owners and renters - White residents 1,227 67.0% Owner occupied603 33.0% Renter occupiedHouse owners and renters - Black or African American residents 35 32.1% Owner occupied74 67.9% Renter occupiedHouse owners and renters - American Indian / Alaska Native residents 14 100.0% Renter occupiedHouse owners and renters - Asian residents 31 100.0% Owner occupiedHouse owners and renters - Other race residents 307 65.3% Owner occupied163 34.7% Renter occupiedHouse owners and renters - Two or more races residents 737 71.7% Owner occupied290 28.3% Renter occupiedHouse owners and renters - White alone residents 406 61.5% Owner occupied255 38.5% Renter occupiedHouse owners and renters - Hispanic or Latino residents 1,743 68.4% Owner occupied807 31.6% Renter occupied
Language usage in Fort Stockton
English speakers - Total 50.7% of residents of Fort Stockton speak English at home.
47.7% of residents speak Spanish at home 3,211 83.7% Speak English very well625 16.3% Speak English less than very well1.3% of residents speak other language at home 84 77.8% Speak English very well24 22.2% Speak English less than very well
English speakers - Born in the United States 90.0% of residents of Fort Stockton speak English at home.
8.7% of residents speak Spanish at home 53 63.9% Speak English very well30 36.1% Speak English less than very well0.9% of residents speak other language at home 9 100.0% Speak English very well
English speakers - Native, born elsewhere 0.0% of residents of Fort Stockton speak English at home.
89.4% of residents speak Spanish at home 68 89.5% Speak English very well8 10.5% Speak English less than very well11.8% of residents speak other language at home 10 100.0% Speak English less than very well
English speakers - Foreign-born 7.8% of residents of Fort Stockton speak English at home.
83.0% of residents speak Spanish at home 442 56.7% Speak English very well337 43.3% Speak English less than very well8.7% of residents speak other language at home 66 80.5% Speak English very well16 19.5% Speak English less than very well
White (Caucasian) - Speak another language Native:
22.7% (963)Foreign-born:
88.3% (121)
Black or African American - Speak another language Native:
6.1% (19)Foreign-born:
100.0% (34)
Other race - Speak only English Native:
33.9% (261)Foreign-born:
32.7% (100)
Other race - Speak another language Native:
66.0% (509)Foreign-born:
69.6% (213)
Two or more races - Speak another language Native:
65.6% (1,221)Foreign-born:
100.0% (505)
Hispanic or Latino - Speak only English Native:
42.3% (2,254)Foreign-born:
9.2% (79)
Hispanic or Latino - Speak another language Native:
57.7% (3,075)Foreign-born:
91.1% (780)
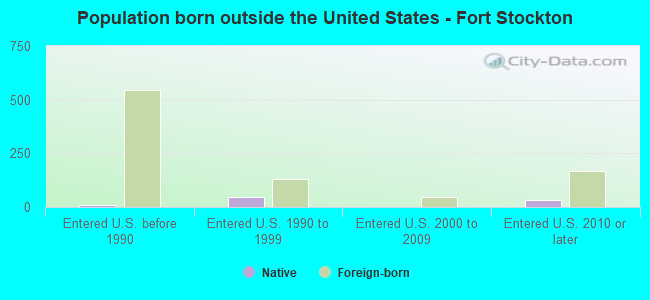
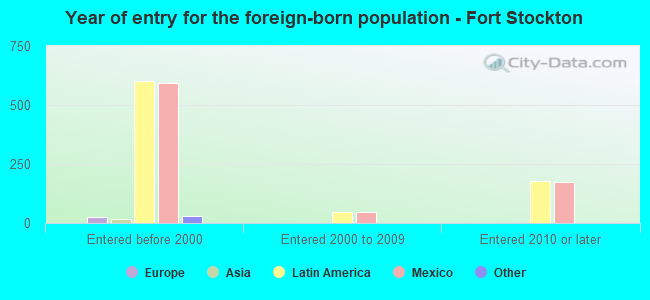
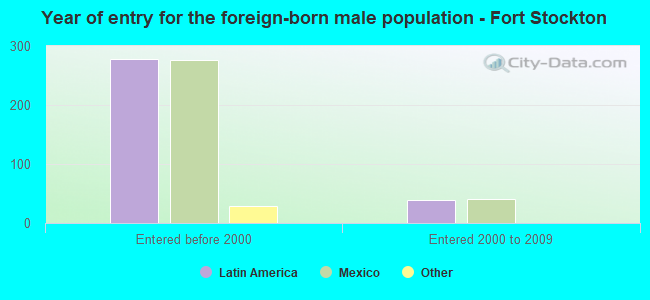
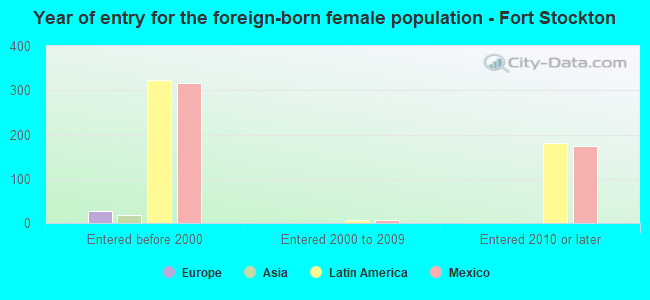
Foreign-born residents in Fort Stockton 939 residents are foreign born (9.9% Latin America ).
This city:
10.9%Texas:
17.1%
Marital status for residents in Fort Stockton Marital status - White (Caucasian) population 15 years and over
Males 23.5% Never married57.7% Now married3.2% Separated3.5% Widowed12.1% DivorcedFemales 29.0% Never married43.2% Now married4.3% Separated11.1% Widowed12.4% DivorcedWomen who gave birth in the past 12 months Now married:
100.0% (55)Unmarried:
0.0% (0)
Women who did not give birth in the past 12 months Now married:
43.8% (455)Unmarried:
56.2% (582)
Marital status - Black or African American population 15 years and over
Males 58.6% Never married0.0% Now married0.0% Separated0.0% Widowed41.4% DivorcedFemales 29.8% Never married0.0% Now married0.0% Separated0.0% Widowed70.2% DivorcedWomen who did not give birth in the past 12 months Now married:
0.0% (0)Unmarried:
100.0% (14)
Marital status - Other race population 15 years and over
Males 51.0% Never married27.8% Now married0.0% Separated3.3% Widowed18.0% DivorcedFemales 22.0% Never married11.9% Now married0.0% Separated14.0% Widowed52.1% DivorcedWomen who did not give birth in the past 12 months Now married:
12.3% (27)Unmarried:
87.7% (195)
Marital status - Two or more races population 15 years and over
Males 34.9% Never married28.0% Now married2.2% Separated0.5% Widowed34.4% DivorcedFemales 48.7% Never married24.6% Now married0.0% Separated7.4% Widowed19.3% DivorcedWomen who did not give birth in the past 12 months Now married:
25.3% (181)Unmarried:
74.7% (535)
Marital status - White alone, not Hispanic / Latino population 15 years and over
Males 26.2% Never married42.0% Now married6.7% Separated6.8% Widowed18.3% DivorcedFemales 19.4% Never married45.9% Now married2.0% Separated13.2% Widowed19.6% DivorcedWomen who did not give birth in the past 12 months Now married:
45.0% (125)Unmarried:
55.0% (153)
Marital status - Hispanic or Latino population 15 years and over
Males 31.2% Never married51.0% Now married0.8% Separated0.9% Widowed16.0% DivorcedFemales 34.5% Never married33.0% Now married3.1% Separated10.3% Widowed19.2% DivorcedWomen who gave birth in the past 12 months Now married:
100.0% (71)Unmarried:
0.0% (0)
Women who did not give birth in the past 12 months Now married:
35.1% (590)Unmarried:
64.9% (1,093)
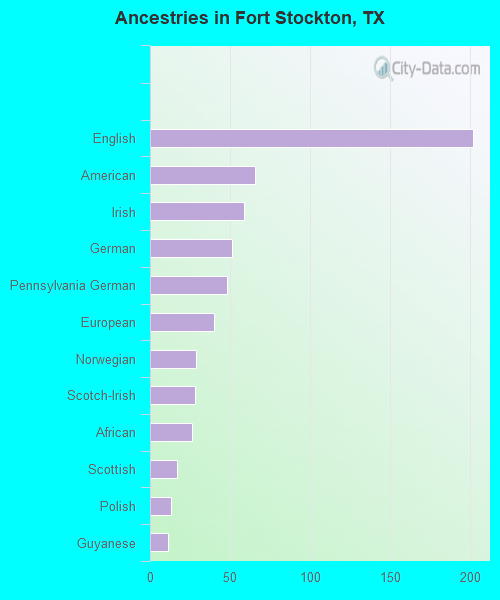
Ancestries in Fort Stockton
202 3.6% English66 1.2% American59 1.1% Irish51 0.9% German48 0.9% Pennsylvania German40 0.7% European29 0.5% Norwegian28 0.5% Scotch-Irish26 0.5% African17 0.3% Scottish13 0.2% Polish11 0.2% Guyanese
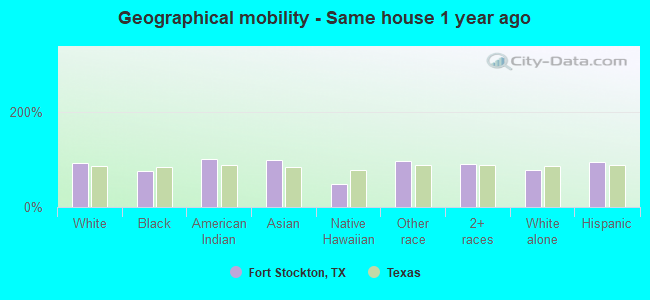
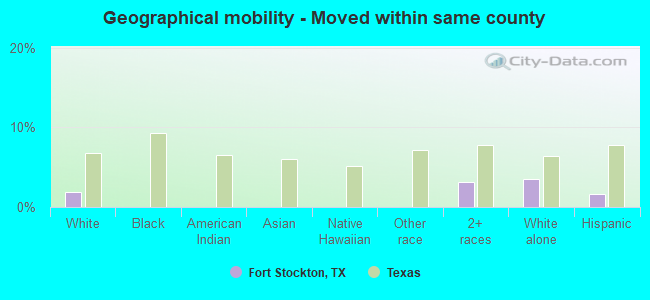
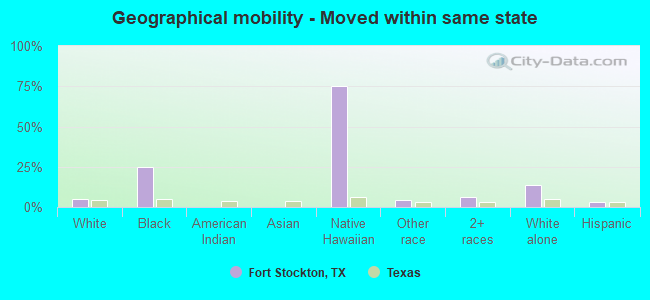
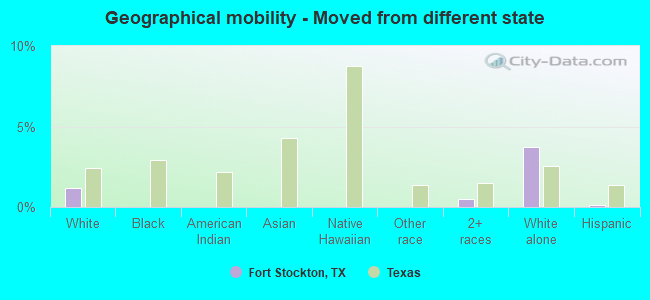
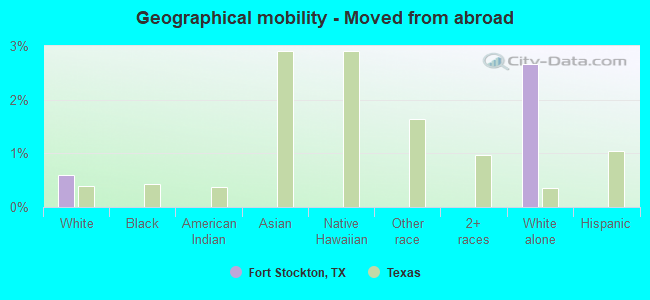
Geographical mobility in Fort Stockton Same house 1 year ago 4,161 92.0% White (Caucasian)268 76.5% Black or African American15 100.0% American Indian / Alaska Native46 99.3% Asian10 49.1% Native Hawaiian / Pacific Islander1,228 96.0% Other race2,167 89.7% Two or more races1,151 76.7% White alone, not Hispanic / Latino6,316 95.1% Hispanic or LatinoMoved within same county 87 1.9% White / Caucasian76 3.1% Two or more races53 3.5% White alone, not Hispanic / Latino105 1.6% Hispanic or LatinoMoved within same state 215 4.7% White / Caucasian87 24.8% Black or African American15 75.3% Native Hawaiian / Pacific Islander53 4.2% Other race150 6.2% Two or more races209 13.9% White alone, not Hispanic / Latino213 3.2% Hispanic or LatinoMoved from different state 54 1.2% White / Caucasian11 0.5% Two or more races56 3.7% White alone, not Hispanic / Latino9 0.1% Hispanic or LatinoMoved from abroad 27 0.6% White40 2.7% White alone, not Hispanic / Latino
Children Nativity (place of birth) in Fort Stockton
Children under 6 years - Living with two parents Both parents native 239 100.0% NativeBoth parents foreign-born 68 100.0% NativeOne native, one foreign-born parent 55 100.0% NativeChildren under 6 years - Living with one parent Native parent 214 100.0% NativeForeign-born parent 135 100.0% NativeChildren 6 to 17 years - Living with two parents Both parents native 698 100.0% NativeBoth parents foreign-born 34 100.0% NativeOne native, one foreign-born parent 78 100.0% NativeChildren 6 to 17 years - Living with one parent Native parent 396 100.0% NativeForeign-born parent 214 50.5% Native210 49.5% Foreign-born
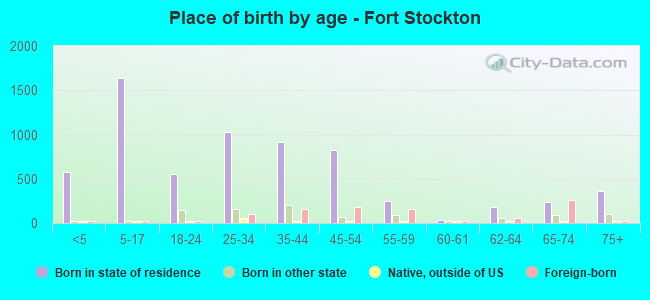
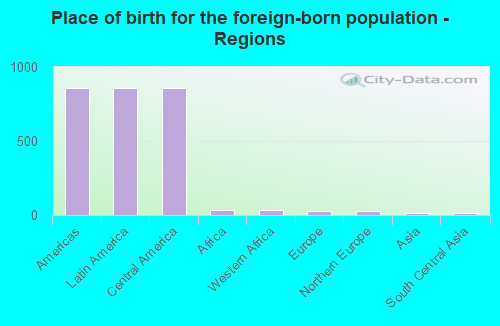
Place of birth for residents in Fort Stockton 860 Americas860 Latin America860 Central America35 Africa35 Western Africa27 Europe27 Northern Europe16 Asia16 South Central Asia
Grandparents responsible for own grandchildren in Fort Stockton
Grandparents (30 to 59 years) White / Caucasian 23 50.7% Responsible for grandchildren23 49.3% Not responsible for grandchildrenOther race 46 100.0% Responsible for grandchildrenTwo or more races 55 100.0% Not responsible for grandchildrenHispanic or Latino 73 52.0% Responsible for grandchildren67 48.0% Not responsible for grandchildrenGrandparents (60 years and over) White / Caucasian 5 47.5% Responsible for grandchildren5 52.5% Not responsible for grandchildrenOther race 17 100.0% Not responsible for grandchildrenHispanic or Latino 22 100.0% Not responsible for grandchildren