Races in Fostoria, Ohio (OH) Detailed Stats
Ancestries, Foreign-born residents, place of birth
Settings
X


Recent posts about races in Fostoria, Ohio on our local forum with over 2,400,000 registered users:
 | Fostoria (15 replies) |
| Potential Move to Chillicothe--A Good Fit? (4 replies) |
| Internet Service in Findlay (8 replies) |
| Moving to Toledo, Ohio??? (21 replies) |
| Grocery stores in Toledo - recommendations? (6 replies) |
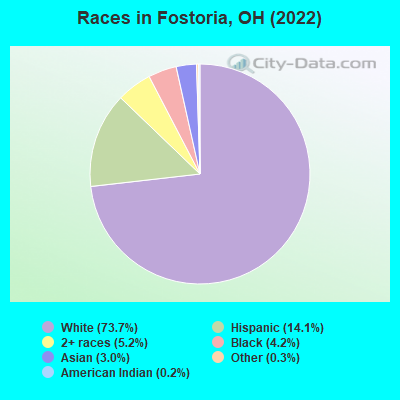
According to 2022 data, the most numerous races in Fostoria, OH are White alone (9,489 residents), Black alone (540 residents), and Two or more races (669 residents). 92.2% of Fostoria residents speak English at home. 3.9% of Fostoria, OH residents are foreign-born (1.9% born in Asia, 1.1% born in Latin America, 0.6% born in Europe), which is about the same as the foreign-born rate of 4.0% across the entire state of Ohio.
Race distribution in Fostoria
2000
2022

- 11,68183.8%White alone
- 1,1047.9%Hispanic
- 7885.7%Black alone
- 2511.8%Two or more races
- 670.5%Asian alone
- 230.2%American Indian alone
- 170.1%Other race alone

-
- 9,48973.7%White alone
- 1,82214.1%Hispanic
- 6695.2%Two or more races
- 5404.2%Black alone
- 3873.0%Asian alone
- 430.3%Other race alone
- 230.2%American Indian alone
- 60.05%Native Hawaiian and Other
Pacific Islander alone
2000
2022
-
- 9,538,11184.0%White alone
- 1,290,66211.4%Black alone
- 217,1231.9%Hispanic
- 137,7701.2%Two or more races
- 131,6701.2%Asian alone
- 21,9850.2%American Indian alone
- 13,4830.1%Other race alone
- 2,3360.02%Native Hawaiian and Other
Pacific Islander alone

-
- 8,948,79376.1%White alone
- 1,401,40311.9%Black alone
- 529,2914.5%Two or more races
- 517,2324.4%Hispanic
- 293,3872.5%Asian alone
- 52,8050.4%Other race alone
- 9,7850.08%American Indian alone
- 3,3620.03%Native Hawaiian and Other
Pacific Islander alone

Income and house value in Fostoria
- Median household income in 2022
- $52,390White non-Hispanic householders
- $94,363Asian householders
- $55,909Some other race householders
- $41,060Two or more races householders
- $57,434Hispanic or Latino race householders
- Median 2022 house value
- $98,710White Non-Hispanic householders
- $100,609Black or African American householders
- $51,411American Indian or Alaska Native householders
- $35,592Asian householders
- $97,603Some other race householders
- $62,326Two or more races householders
- $91,908Hispanic or Latino householders
Household income for White non-Hispanic householders

Household income for Black householders

Household income for American Indian and Alaska Native householders

Household income for Asian householders

Household income for Some other race householders

Household income for Two or more races householders

Household income for Hispanic or Latino race householders

Median age by race in Fostoria
- 40.0Median age for White residents
- 38.7Males
- 41.6Females
- 31.2Median age for Black or African American residents
- 31.5Males
- 25.1Females
- 22.3Median age for American Indian / Alaska Native residents
- 44.3Males
- -658,163,264.6Females
- 44.8Median age for Asian residents
- 18.2Males
- 45.2Females
- -800,387,596.1Median age for Native Hawaiian / Pacific Islander residents
- -750,242,953.6Males
- -805,394,989.6Females
- 25.6Median age for Other race residents
- 26.9Males
- 16.9Females
- 25.4Median age for Two or more races residents
- 25.8Males
- 21.7Females
- 41.8Median age for White alone residents
- 40.1Males
- 44.5Females
- 24.3Median age for Hispanic or Latino residents
- 25.6Males
- 24.0Females
Owner/renter occupied households by race in Fostoria
- House owners and renters - White residents
- 3,12069.2%Owner occupied
- 1,38530.8%Renter occupied
- House owners and renters - Black or African American residents
- 6244.9%Owner occupied
- 7655.1%Renter occupied
- House owners and renters - American Indian / Alaska Native residents
- 2450.6%Owner occupied
- 2449.4%Renter occupied
- House owners and renters - Asian residents
- 6169.9%Owner occupied
- 2630.1%Renter occupied
- House owners and renters - Native Hawaiian / Pacific Islander residents
- 7100.0%Owner occupied
- House owners and renters - Other race residents
- 11255.6%Owner occupied
- 9044.4%Renter occupied
- House owners and renters - Two or more races residents
- 2611.3%Owner occupied
- 20688.7%Renter occupied
- House owners and renters - White alone residents
- 2,91868.6%Owner occupied
- 1,33331.4%Renter occupied
- House owners and renters - Hispanic or Latino residents
- 36862.9%Owner occupied
- 21737.1%Renter occupied
Language usage in Fostoria
- English speakers - Total
- 92.2% of residents of Fostoria speak English at home.
- 4.6% of residents speak Spanish at home
- 42477.7%Speak English very well
- 12222.3%Speak English less than very well
- 3.1% of residents speak other language at home
- 22862.3%Speak English very well
- 13837.7%Speak English less than very well
- English speakers - Born in the United States
- 97.5% of residents of Fostoria speak English at home.
- 0.6% of residents speak Spanish at home
- 10100.0%Speak English very well
- 1.7% of residents speak other language at home
- 1970.4%Speak English very well
- 829.6%Speak English less than very well
All residents speak only English at home
- English speakers - Foreign-born
- 15.6% of residents of Fostoria speak English at home.
- 24.1% of residents speak Spanish at home
- 4738.5%Speak English very well
- 7561.5%Speak English less than very well
- 60.3% of residents speak other language at home
- 18059.0%Speak English very well
- 12541.0%Speak English less than very well
White (Caucasian) - Speak only English
| Native: | 97.7% (9,096) |
| Foreign-born: | 41.4% (53) |
White (Caucasian) - Speak another language
| Native: | 2.4% (220) |
| Foreign-born: | 59.5% (76) |
Asian - Speak another language
| Native: | 14.1% (19) |
| Foreign-born: | 100.0% (250) |
Other race - Speak only English
| Native: | 67.5% (344) |
| Foreign-born: | 34.6% (21) |
Other race - Speak another language
| Native: | 31.7% (161) |
| Foreign-born: | 57.5% (35) |
Two or more races - Speak another language
| Native: | 10.4% (99) |
| Foreign-born: | 100.0% (48) |
White alone - Speak only English
| Native: | 98.8% (8,508) |
| Foreign-born: | 59.7% (55) |
White alone - Speak another language
| Native: | 1.1% (98) |
| Foreign-born: | 40.9% (37) |
Hispanic or Latino - Speak only English
| Native: | 74.1% (1,070) |
| Foreign-born: | 13.3% (22) |
Hispanic or Latino - Speak another language
| Native: | 25.3% (366) |
| Foreign-born: | 86.4% (144) |
Foreign-born residents in Fostoria
506 residents are foreign born (1.9% Asia, 1.1% Latin America, 0.6% Europe).
| This city: | 3.9% |
| Ohio: | 4.9% |


Marital status for residents in Fostoria
Marital status - White (Caucasian) population 15 years and over
- Males
- 37.3%Never married
- 42.3%Now married
- 1.8%Separated
- 4.6%Widowed
- 14.0%Divorced
- Females
- 26.0%Never married
- 42.1%Now married
- 5.8%Separated
- 11.0%Widowed
- 15.1%Divorced
Women who gave birth in the past 12 months
| Now married: | 77.7% (138) |
| Unmarried: | 22.3% (40) |
Women who did not give birth in the past 12 months
| Now married: | 43.4% (884) |
| Unmarried: | 56.6% (1,155) |
Marital status - Black or African American population 15 years and over
- Males
- 52.6%Never married
- 40.9%Now married
- 0.0%Separated
- 0.0%Widowed
- 6.5%Divorced
- Females
- 71.1%Never married
- 8.1%Now married
- 14.4%Separated
- 1.1%Widowed
- 5.2%Divorced
Women who did not give birth in the past 12 months
| Now married: | 0.0% (0) |
| Unmarried: | 100.0% (170) |
Marital status - American Indian / Alaska Native population 15 years and over
- Males
- 0.0%Never married
- 88.0%Now married
- 12.0%Separated
- 0.0%Widowed
- 0.0%Divorced
- Females
- 0.0%Never married
- 0.0%Now married
- 0.0%Separated
- 0.0%Widowed
- 100.0%Divorced
Marital status - Asian population 15 years and over
- Males
- 43.3%Never married
- 56.7%Now married
- 0.0%Separated
- 0.0%Widowed
- 0.0%Divorced
- Females
- 12.5%Never married
- 67.8%Now married
- 0.0%Separated
- 0.0%Widowed
- 19.7%Divorced
Women who did not give birth in the past 12 months
| Now married: | 37.2% (29) |
| Unmarried: | 62.8% (49) |
Marital status - Other race population 15 years and over
- Males
- 44.1%Never married
- 26.1%Now married
- 9.0%Separated
- 0.0%Widowed
- 20.7%Divorced
- Females
- 51.6%Never married
- 35.5%Now married
- 0.0%Separated
- 12.9%Widowed
- 0.0%Divorced
Women who did not give birth in the past 12 months
| Now married: | 7.7% (5) |
| Unmarried: | 92.3% (63) |
Marital status - Two or more races population 15 years and over
- Males
- 78.8%Never married
- 14.5%Now married
- 0.0%Separated
- 0.0%Widowed
- 6.7%Divorced
- Females
- 57.1%Never married
- 23.7%Now married
- 6.3%Separated
- 12.9%Widowed
- 0.0%Divorced
Women who did not give birth in the past 12 months
| Now married: | 21.5% (64) |
| Unmarried: | 78.5% (234) |
Marital status - White alone, not Hispanic / Latino population 15 years and over
- Males
- 37.1%Never married
- 43.2%Now married
- 1.9%Separated
- 4.4%Widowed
- 13.3%Divorced
- Females
- 25.5%Never married
- 40.9%Now married
- 6.1%Separated
- 11.7%Widowed
- 15.8%Divorced
Women who gave birth in the past 12 months
| Now married: | 84.6% (139) |
| Unmarried: | 15.4% (25) |
Women who did not give birth in the past 12 months
| Now married: | 41.3% (776) |
| Unmarried: | 58.7% (1,104) |
Marital status - Hispanic or Latino population 15 years and over
- Males
- 47.6%Never married
- 28.6%Now married
- 0.0%Separated
- 2.7%Widowed
- 21.1%Divorced
- Females
- 33.6%Never married
- 52.0%Now married
- 4.0%Separated
- 7.5%Widowed
- 3.0%Divorced
Women who gave birth in the past 12 months
| Now married: | 0.0% (0) |
| Unmarried: | 100.0% (16) |
Women who did not give birth in the past 12 months
| Now married: | 54.0% (178) |
| Unmarried: | 46.0% (152) |
Ancestries in Fostoria

- 1,42723.6%German
- 83613.8%American
- 3846.4%Irish
- 3455.7%English
- 1472.4%Italian
- 1242.1%European
- 791.3%Nigerian
- 470.8%Dutch
- 440.7%Scottish
- 290.5%African
- 280.5%Scotch-Irish
- 230.4%French
- 210.3%Belgian
- 160.3%Pennsylvania German
- 150.2%Polish
- 130.2%Russian
- 110.2%French Canadian
- 100.2%Croatian
- 80.1%Czechoslovakian
- 30.05%British

Geographical mobility in Fostoria

- Same house 1 year ago
- 9,29991.0%White (Caucasian)
- 38270.4%Black or African American
- 55100.0%American Indian / Alaska Native
- 394100.0%Asian
- 8100.0%Native Hawaiian / Pacific Islander
- 57898.0%Other race
- 71068.4%Two or more races
- 8,50690.9%White alone, not Hispanic / Latino
- 1,57689.2%Hispanic or Latino

-
- Moved within same county
- 4584.5%White / Caucasian
- 13424.7%Black or African American
- 30.6%Other race
- 656.3%Two or more races
- 4594.9%White alone, not Hispanic / Latino
- 533.0%Hispanic or Latino

-
- Moved within same state
- 3703.6%White / Caucasian
- 91.6%Black or African American
- 21720.9%Two or more races
- 2903.1%White alone, not Hispanic / Latino
- 1699.6%Hispanic or Latino

-
- Moved from different state
- 1141.1%White / Caucasian
- 1171.2%White alone, not Hispanic / Latino

Children Nativity (place of birth) in Fostoria
Place of birth for residents in Fostoria
![Place of birth for the foreign-born population - Regions]()
- 246Asia
- 159Americas
- 141Latin America
- 141Central America
- 114Eastern Asia
- 112South Eastern Asia
- 80Europe
- 39Western Europe
- 31China
- 27Southern Europe
- 19South Central Asia
- 19Africa
- 19Western Africa
- 18Northern America
- 13Eastern Europe

![Place of birth for the foreign-born population - Countries]()
- 141Mexico
- 100Laos
- 82Korea
- 31China
- 29Germany
- 27Italy
- 19India
- 19Senegal
- 18Canada
- 12Philippines
- 10France

Grandparents responsible for own grandchildren in Fostoria
Zip codes: 44830.