Races in Freeport, Florida (FL) Detailed Stats
Data:
Races - White alone (%)
Races - White alone (% change since 2000)
Races - Black alone (%)
Races - Black alone (% change since 2000)
Races - American Indian alone (%)
Races - American Indian alone (% change since 2000)
Races - Asian alone (%)
Races - Asian alone (% change since 2000)
Races - Hispanic (%)
Races - Hispanic (% change since 2000)
Races - Native Hawaiian and Other Pacific Islander alone (%)
Races - Native Hawaiian and Other Pacific Islander alone (% change since 2000)
Races - Two or more races(%)
Races - Two or more races(% change since 2000)
Races - Other race alone (%)
Races - Other race alone (% change since 2000)
Racial diversity
Place of birth - Born in state of residence (%)
Place of birth - Born in state of residence (%) - White
Place of birth - Born in state of residence (%) - Black or African American
Place of birth - Born in state of residence (%) - Asian
Place of birth - Born in state of residence (%) - Hispanic or Latino
Place of birth - Born in state of residence (%) - American Indian and Alaska Native
Place of birth - Born in state of residence (%) - Multirace
Place of birth - Born in state of residence (%) - Other Race
Place of birth - Born in other state (%)
Place of birth - Born in other state (%) - White
Place of birth - Born in other state (%) - Black or African American
Place of birth - Born in other state (%) - Asian
Place of birth - Born in other state (%) - Hispanic or Latino
Place of birth - Born in other state (%) - American Indian and Alaska Native
Place of birth - Born in other state (%) - Multirace
Place of birth - Born in other state (%) - Other Race
Place of birth - Native, outside of US (%)
Place of birth - Native, outside of US (%) - White
Place of birth - Native, outside of US (%) - Black or African American
Place of birth - Native, outside of US (%) - Asian
Place of birth - Native, outside of US (%) - Hispanic or Latino
Place of birth - Native, outside of US (%) - American Indian and Alaska Native
Place of birth - Native, outside of US (%) - Multirace
Place of birth - Native, outside of US (%) - Other Race
Place of birth - Foreign born (%)
Place of birth - Foreign born (%) - White
Place of birth - Foreign born (%) - Black or African American
Place of birth - Foreign born (%) - Asian
Place of birth - Foreign born (%) - Hispanic or Latino
Place of birth - Foreign born (%) - American Indian and Alaska Native
Place of birth - Foreign born (%) - Multirace
Place of birth - Foreign born (%) - Other Race
Residents speaking English at home (%)
Residents speaking English at home - Born in the United States (%)
Residents speaking English at home - Native, born elsewhere (%)
Residents speaking English at home - Foreign born (%)
Residents speaking Spanish at home (%)
Residents speaking Spanish at home - Born in the United States (%)
Residents speaking Spanish at home - Native, born elsewhere (%)
Residents speaking Spanish at home - Foreign born (%)
Residents speaking other language at home (%)
Residents speaking other language at home - Born in the United States (%)
Residents speaking other language at home - Native, born elsewhere (%)
Residents speaking other language at home - Foreign born (%)
Marital status - Never married (%)
Marital status - Now married (%)
Marital status - Separated (%)
Marital status - Widowed (%)
Marital status - Divorced (%)
Ancestries Reported - Arab (%)
Ancestries Reported - Czech (%)
Ancestries Reported - Danish (%)
Ancestries Reported - Dutch (%)
Ancestries Reported - English (%)
Ancestries Reported - French (%)
Ancestries Reported - French Canadian (%)
Ancestries Reported - German (%)
Ancestries Reported - Greek (%)
Ancestries Reported - Hungarian (%)
Ancestries Reported - Irish (%)
Ancestries Reported - Italian (%)
Ancestries Reported - Lithuanian (%)
Ancestries Reported - Norwegian (%)
Ancestries Reported - Polish (%)
Ancestries Reported - Portuguese (%)
Ancestries Reported - Russian (%)
Ancestries Reported - Scotch-Irish (%)
Ancestries Reported - Scottish (%)
Ancestries Reported - Slovak (%)
Ancestries Reported - Subsaharan African (%)
Ancestries Reported - Swedish (%)
Ancestries Reported - Swiss (%)
Ancestries Reported - Ukrainian (%)
Ancestries Reported - United States (%)
Ancestries Reported - Welsh (%)
Ancestries Reported - West Indian (%)
Ancestries Reported - Other (%)
Geographical mobility - Same house 1 year ago (%)
Geographical mobility - Same house 1 year ago (%) - White
Geographical mobility - Same house 1 year ago (%) - Black or African American
Geographical mobility - Same house 1 year ago (%) - Asian
Geographical mobility - Same house 1 year ago (%) - Hispanic or Latino
Geographical mobility - Same house 1 year ago (%) - American Indian and Alaska Native
Geographical mobility - Same house 1 year ago (%) - Multirace
Geographical mobility - Same house 1 year ago (%) - Other Race
Geographical mobility - Moved within same county (%)
Geographical mobility - Moved within same county (%) - White
Geographical mobility - Moved within same county (%) - Black or African American
Geographical mobility - Moved within same county (%) - Asian
Geographical mobility - Moved within same county (%) - Hispanic or Latino
Geographical mobility - Moved within same county (%) - American Indian and Alaska Native
Geographical mobility - Moved within same county (%) - Multirace
Geographical mobility - Moved within same county (%) - Other Race
Geographical mobility - Moved from different county within same state (%)
Geographical mobility - Moved from different county within same state (%) - White
Geographical mobility - Moved from different county within same state (%) - Black or African American
Geographical mobility - Moved from different county within same state (%) - Asian
Geographical mobility - Moved from different county within same state (%) - Hispanic or Latino
Geographical mobility - Moved from different county within same state (%) - American Indian and Alaska Native
Geographical mobility - Moved from different county within same state (%) - Multirace
Geographical mobility - Moved from different county within same state (%) - Other Race
Geographical mobility - Moved from different state (%)
Geographical mobility - Moved from different state (%) - White
Geographical mobility - Moved from different state (%) - Black or African American
Geographical mobility - Moved from different state (%) - Asian
Geographical mobility - Moved from different state (%) - Hispanic or Latino
Geographical mobility - Moved from different state (%) - American Indian and Alaska Native
Geographical mobility - Moved from different state (%) - Multirace
Geographical mobility - Moved from different state (%) - Other Race
Geographical mobility - Moved from abroad (%)
Geographical mobility - Moved from abroad (%) - White
Geographical mobility - Moved from abroad (%) - Black or African American
Geographical mobility - Moved from abroad (%) - Asian
Geographical mobility - Moved from abroad (%) - Hispanic or Latino
Geographical mobility - Moved from abroad (%) - American Indian and Alaska Native
Geographical mobility - Moved from abroad (%) - Multirace
Geographical mobility - Moved from abroad (%) - Other Race
Place of birth for the foreign-born population - Ireland (%)
Place of birth for the foreign-born population - Denmark (%)
Place of birth for the foreign-born population - Norway (%)
Place of birth for the foreign-born population - Sweden (%)
Place of birth for the foreign-born population - United Kingdom (%)
Place of birth for the foreign-born population - England (%)
Place of birth for the foreign-born population - Scotland (%)
Place of birth for the foreign-born population - Other Northern Europe (%)
Place of birth for the foreign-born population - Austria (%)
Place of birth for the foreign-born population - Belgium (%)
Place of birth for the foreign-born population - France (%)
Place of birth for the foreign-born population - Germany (%)
Place of birth for the foreign-born population - Netherlands (%)
Place of birth for the foreign-born population - Switzerland (%)
Place of birth for the foreign-born population - Other Western Europe (%)
Place of birth for the foreign-born population - Greece (%)
Place of birth for the foreign-born population - Italy (%)
Place of birth for the foreign-born population - Portugal (%)
Place of birth for the foreign-born population - Spain (%)
Place of birth for the foreign-born population - Other Southern Europe (%)
Place of birth for the foreign-born population - Albania (%)
Place of birth for the foreign-born population - Belarus (%)
Place of birth for the foreign-born population - Bosnia and Herzegovina (%)
Place of birth for the foreign-born population - Bulgaria (%)
Place of birth for the foreign-born population - Croatia (%)
Place of birth for the foreign-born population - Czechoslovakia (%)
Place of birth for the foreign-born population - Hungary (%)
Place of birth for the foreign-born population - Latvia (%)
Place of birth for the foreign-born population - Lithuania (%)
Place of birth for the foreign-born population - North Macedonia (Macedonia) (%)
Place of birth for the foreign-born population - Moldova (%)
Place of birth for the foreign-born population - Poland (%)
Place of birth for the foreign-born population - Romania (%)
Place of birth for the foreign-born population - Russia (%)
Place of birth for the foreign-born population - Serbia (%)
Place of birth for the foreign-born population - Ukraine (%)
Place of birth for the foreign-born population - Other Eastern Europe (%)
Place of birth for the foreign-born population - China (%)
Place of birth for the foreign-born population - Hong Kong (%)
Place of birth for the foreign-born population - Taiwan (%)
Place of birth for the foreign-born population - Japan (%)
Place of birth for the foreign-born population - Korea (%)
Place of birth for the foreign-born population - Other Eastern Asia (%)
Place of birth for the foreign-born population - Afghanistan (%)
Place of birth for the foreign-born population - Bangladesh (%)
Place of birth for the foreign-born population - India (%)
Place of birth for the foreign-born population - Iran (%)
Place of birth for the foreign-born population - Kazakhstan (%)
Place of birth for the foreign-born population - Nepal (%)
Place of birth for the foreign-born population - Pakistan (%)
Place of birth for the foreign-born population - Sri Lanka (%)
Place of birth for the foreign-born population - Uzbekistan (%)
Place of birth for the foreign-born population - Other South Central Asia (%)
Place of birth for the foreign-born population - Burma (%)
Place of birth for the foreign-born population - Cambodia (%)
Place of birth for the foreign-born population - Indonesia (%)
Place of birth for the foreign-born population - Laos (%)
Place of birth for the foreign-born population - Malaysia (%)
Place of birth for the foreign-born population - Philippines (%)
Place of birth for the foreign-born population - Singapore (%)
Place of birth for the foreign-born population - Thailand (%)
Place of birth for the foreign-born population - Vietnam (%)
Place of birth for the foreign-born population - Other South Eastern Asia (%)
Place of birth for the foreign-born population - Armenia (%)
Place of birth for the foreign-born population - Iraq (%)
Place of birth for the foreign-born population - Israel (%)
Place of birth for the foreign-born population - Jordan (%)
Place of birth for the foreign-born population - Kuwait (%)
Place of birth for the foreign-born population - Lebanon (%)
Place of birth for the foreign-born population - Saudi Arabia (%)
Place of birth for the foreign-born population - Syria (%)
Place of birth for the foreign-born population - Turkey (%)
Place of birth for the foreign-born population - Yemen (%)
Place of birth for the foreign-born population - Other Western Asia (%)
Place of birth for the foreign-born population - Eritrea (%)
Place of birth for the foreign-born population - Ethiopia (%)
Place of birth for the foreign-born population - Kenya (%)
Place of birth for the foreign-born population - Somalia (%)
Place of birth for the foreign-born population - Uganda (%)
Place of birth for the foreign-born population - Zimbabwe (%)
Place of birth for the foreign-born population - Other Eastern Africa (%)
Place of birth for the foreign-born population - Cameroon (%)
Place of birth for the foreign-born population - Congo (%)
Place of birth for the foreign-born population - Democratic Republic of Congo (Zaire) (%)
Place of birth for the foreign-born population - Other Middle Africa (%)
Place of birth for the foreign-born population - Egypt (%)
Place of birth for the foreign-born population - Morocco (%)
Place of birth for the foreign-born population - Sudan (%)
Place of birth for the foreign-born population - Other Northern Africa (%)
Place of birth for the foreign-born population - South Africa (%)
Place of birth for the foreign-born population - Other Southern Africa (%)
Place of birth for the foreign-born population - Cabo Verde (%)
Place of birth for the foreign-born population - Ghana (%)
Place of birth for the foreign-born population - Liberia (%)
Place of birth for the foreign-born population - Nigeria (%)
Place of birth for the foreign-born population - Senegal (%)
Place of birth for the foreign-born population - Sierra Leone (%)
Place of birth for the foreign-born population - Other Western Africa (%)
Place of birth for the foreign-born population - Australia (%)
Place of birth for the foreign-born population - New Zealand (%)
Place of birth for the foreign-born population - Fiji (%)
Place of birth for the foreign-born population - Micronesia (%)
Place of birth for the foreign-born population - Bahamas (%)
Place of birth for the foreign-born population - Barbados (%)
Place of birth for the foreign-born population - Cuba (%)
Place of birth for the foreign-born population - Dominica (%)
Place of birth for the foreign-born population - Dominican Republic (%)
Place of birth for the foreign-born population - Grenada (%)
Place of birth for the foreign-born population - Haiti (%)
Place of birth for the foreign-born population - Jamaica (%)
Place of birth for the foreign-born population - St. Vincent and the Grenadines (%)
Place of birth for the foreign-born population - Trinidad and Tobago (%)
Place of birth for the foreign-born population - West Indies (%)
Place of birth for the foreign-born population - Other Caribbean (%)
Place of birth for the foreign-born population - Belize (%)
Place of birth for the foreign-born population - Costa Rica (%)
Place of birth for the foreign-born population - El Salvador (%)
Place of birth for the foreign-born population - Guatemala (%)
Place of birth for the foreign-born population - Honduras (%)
Place of birth for the foreign-born population - Mexico (%)
Place of birth for the foreign-born population - Nicaragua (%)
Place of birth for the foreign-born population - Panama (%)
Place of birth for the foreign-born population - Other Central America (%)
Place of birth for the foreign-born population - Argentina (%)
Place of birth for the foreign-born population - Bolivia (%)
Place of birth for the foreign-born population - Brazil (%)
Place of birth for the foreign-born population - Chile (%)
Place of birth for the foreign-born population - Colombia (%)
Place of birth for the foreign-born population - Ecuador (%)
Place of birth for the foreign-born population - Guyana (%)
Place of birth for the foreign-born population - Peru (%)
Place of birth for the foreign-born population - Uruguay (%)
Place of birth for the foreign-born population - Venezuela (%)
Place of birth for the foreign-born population - Other South America (%)
Place of birth for the foreign-born population - Canada (%)
Place of birth for the foreign-born population - Other Northern America (%)
Place of birth for the foreign-born population - Other (%)
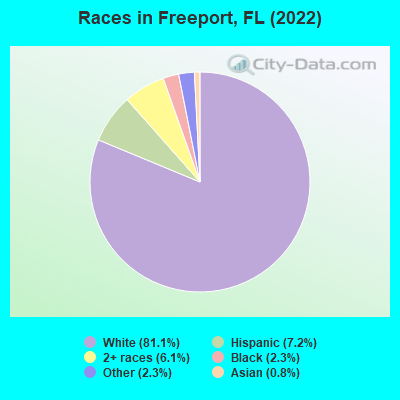
According to 2022 data, the most numerous races in Freeport, FL are White alone (4,884 residents), Hispanic (435 residents), and Black alone (139 residents). 89.2% of Freeport residents speak English at home. 5.1% of Freeport, FL residents are foreign-born (2.7% born in Latin America, 1.6% born in Europe, 0.7% born in Asia), which is 309.0% less than the foreign-born rate of 21.0% across the entire state of Florida.
Race distribution in Freeport
2000 2022
10,458,509 65.4% White alone 2,682,715 16.8% Hispanic 2,264,268 14.2% Black alone 261,693 1.6% Asian alone 236,954 1.5% Two or more races 42,358 0.3% American Indian alone 28,994 0.2% Other race alone 6,887 0.04% Native Hawaiian and Other
11,309,403 50.8% White alone 6,025,039 27.1% Hispanic 3,241,015 14.6% Black alone 861,630 3.9% Two or more races 623,692 2.8% Asian alone 152,054 0.7% Other race alone 22,504 0.1% American Indian alone 9,486 0.04% Native Hawaiian and Other
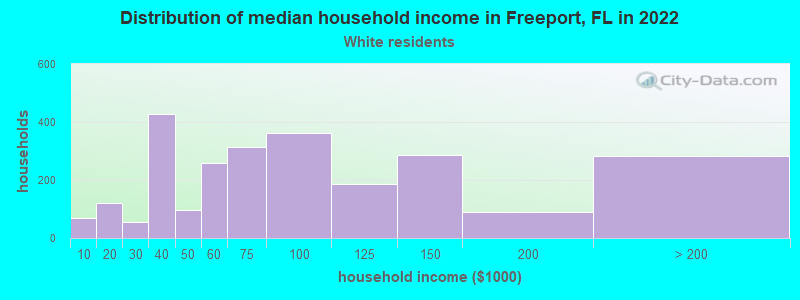
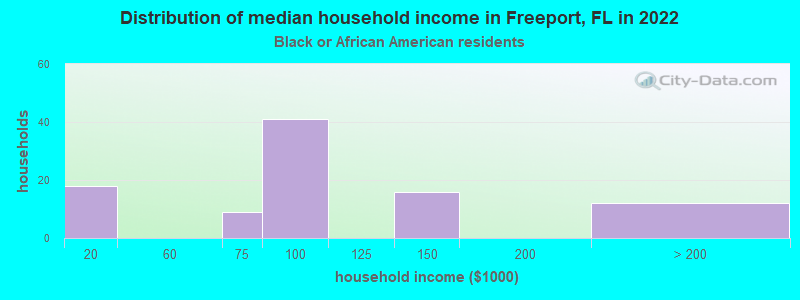
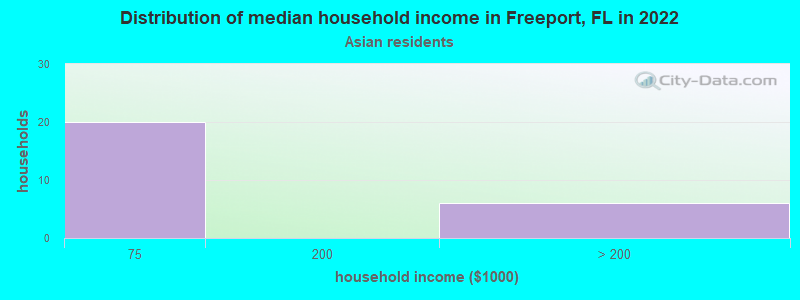
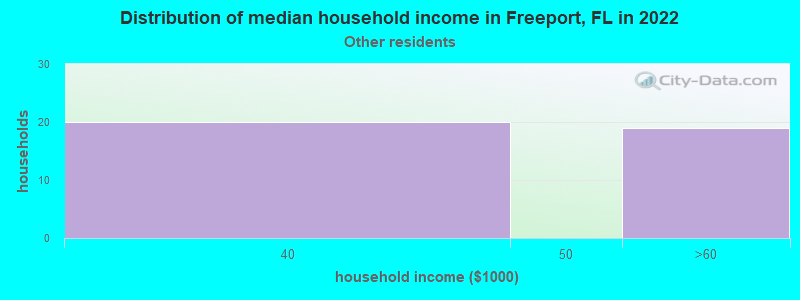
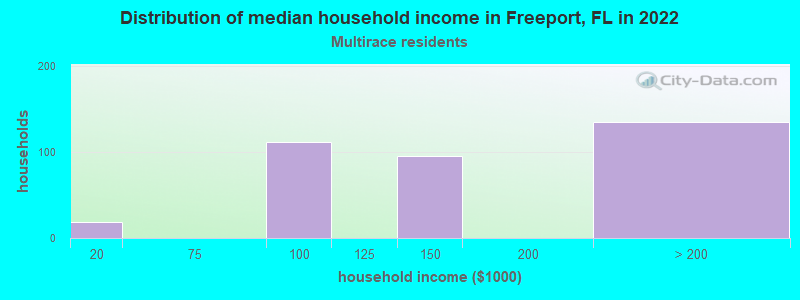
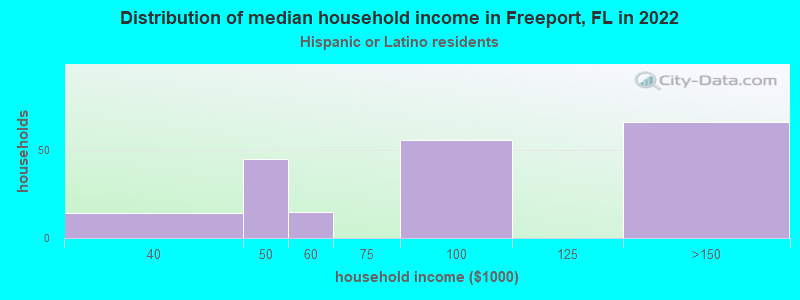
Income and house value in Freeport Median household income in 2022 $74,731 White non-Hispanic householders$61,857 Black householders$159,410 Two or more races householders$125,763 Hispanic or Latino race householdersMedian 2022 house value $495,685 White Non-Hispanic householders$322,613 Black or African American householders$294,526 American Indian or Alaska Native householders$246,704 Two or more races householders
Median age by race in Freeport
44.9 Median age for White residents43.0 46.6 87.3 Median age for Black or African American residents68.2 64.7 -691,228,069.5 Median age for American Indian / Alaska Native residents-660,178,425.9 -647,217,719.5 32.0 Median age for Asian residents-593,232,540.8 39.0 -666,666,666.0 Median age for Native Hawaiian / Pacific Islander residents-666,666,666.0 -666,666,666.0 5.9 Median age for Other race residents5.6 6.1 36.9 Median age for Two or more races residents41.6 13.9 44.7 Median age for White alone residents43.2 46.2 42.8 Median age for Hispanic or Latino residents38.4 33.0
Owner/renter occupied households by race in Freeport
House owners and renters - White residents 1,951 81.1% Owner occupied456 18.9% Renter occupiedHouse owners and renters - Black or African American residents 85 87.2% Owner occupied13 12.8% Renter occupiedHouse owners and renters - American Indian / Alaska Native residents 8 100.0% Owner occupiedHouse owners and renters - Asian residents 10 21.2% Owner occupied36 78.8% Renter occupiedHouse owners and renters - Other race residents 38 100.0% Renter occupiedHouse owners and renters - Two or more races residents 84 24.8% Owner occupied254 75.2% Renter occupiedHouse owners and renters - White alone residents 1,927 80.2% Owner occupied476 19.8% Renter occupiedHouse owners and renters - Hispanic or Latino residents 32 10.2% Owner occupied284 89.8% Renter occupied
Language usage in Freeport
English speakers - Total 89.2% of residents of Freeport speak English at home.
7.5% of residents speak Spanish at home 355 84.3% Speak English very well66 15.7% Speak English less than very well2.9% of residents speak other language at home 107 66.0% Speak English very well55 34.0% Speak English less than very well
English speakers - Born in the United States 99.8% of residents of Freeport speak English at home.
0.3% of residents speak Spanish at home 11 100.0% Speak English very well
English speakers - Native, born elsewhere 35.2% of residents of Freeport speak English at home.
63.1% of residents speak Spanish at home 48 62.3% Speak English very well29 37.7% Speak English less than very well
English speakers - Foreign-born 10.7% of residents of Freeport speak English at home.
40.1% of residents speak Spanish at home 97 74.0% Speak English very well34 26.0% Speak English less than very well48.3% of residents speak other language at home 108 68.4% Speak English very well50 31.6% Speak English less than very well
White (Caucasian) - Speak only English Native:
95.8% (4,684)Foreign-born:
18.1% (25)
White (Caucasian) - Speak another language Native:
4.3% (212)Foreign-born:
88.7% (124)
Asian - Speak only English Native:
29.0% (2)Foreign-born:
9.3% (4)
Asian - Speak another language Native:
69.7% (5)Foreign-born:
91.0% (40)
Other race - Speak another language Native:
34.9% (33)Foreign-born:
100.0% (144)
Two or more races - Speak another language Native:
23.8% (123)Foreign-born:
100.0% (30)
White alone - Speak only English Native:
94.9% (4,610)Foreign-born:
17.1% (25)
White alone - Speak another language Native:
6.7% (325)Foreign-born:
100.0% (149)
Hispanic or Latino - Speak another language Native:
29.9% (83)Foreign-born:
97.3% (143)
Foreign-born residents in Freeport 327 residents are foreign born (2.7% Latin America , 1.6% Europe , 0.7% Asia ).
This city:
5.1%Florida:
21.1%
Marital status for residents in Freeport Marital status - White (Caucasian) population 15 years and over
Males 15.7% Never married69.9% Now married4.4% Separated1.0% Widowed8.9% DivorcedFemales 13.7% Never married64.7% Now married0.3% Separated14.3% Widowed7.1% DivorcedWomen who gave birth in the past 12 months Now married:
100.0% (17)Unmarried:
0.0% (0)
Women who did not give birth in the past 12 months Now married:
65.3% (761)Unmarried:
34.7% (404)
Marital status - Black or African American population 15 years and over
Males 0.0% Never married100.0% Now married0.0% Separated0.0% Widowed0.0% DivorcedFemales 23.3% Never married11.6% Now married0.0% Separated18.6% Widowed46.5% DivorcedWomen who did not give birth in the past 12 months Now married:
100.0% (10)Unmarried:
0.0% (0)
Marital status - Asian population 15 years and over
Males 100.0% Never married0.0% Now married0.0% Separated0.0% Widowed0.0% DivorcedFemales 0.0% Never married25.9% Now married0.0% Separated33.3% Widowed40.7% DivorcedWomen who did not give birth in the past 12 months Now married:
38.9% (7)Unmarried:
61.1% (11)
Marital status - Other race population 15 years and over
Males 0.0% Never married79.4% Now married0.0% Separated0.0% Widowed20.6% DivorcedFemales 0.0% Never married90.5% Now married0.0% Separated0.0% Widowed9.5% DivorcedWomen who gave birth in the past 12 months Now married:
64.7% (16)Unmarried:
35.3% (9)
Women who did not give birth in the past 12 months Now married:
100.0% (66)Unmarried:
0.0% (0)
Marital status - Two or more races population 15 years and over
Males 54.1% Never married45.9% Now married0.0% Separated0.0% Widowed0.0% DivorcedFemales 0.0% Never married21.1% Now married39.5% Separated0.0% Widowed39.5% DivorcedWomen who did not give birth in the past 12 months Now married:
58.3% (63)Unmarried:
41.7% (45)
Marital status - White alone, not Hispanic / Latino population 15 years and over
Males 15.5% Never married70.0% Now married4.5% Separated1.0% Widowed9.0% DivorcedFemales 14.0% Never married65.8% Now married0.3% Separated14.7% Widowed5.2% DivorcedWomen who gave birth in the past 12 months Now married:
100.0% (17)Unmarried:
0.0% (0)
Women who did not give birth in the past 12 months Now married:
67.8% (775)Unmarried:
32.2% (369)
Marital status - Hispanic or Latino population 15 years and over
Males 34.4% Never married61.3% Now married0.0% Separated0.0% Widowed4.4% DivorcedFemales 0.0% Never married47.9% Now married21.1% Separated0.0% Widowed31.0% DivorcedWomen who gave birth in the past 12 months Now married:
100.0% (11)Unmarried:
0.0% (0)
Women who did not give birth in the past 12 months Now married:
65.6% (87)Unmarried:
34.4% (46)
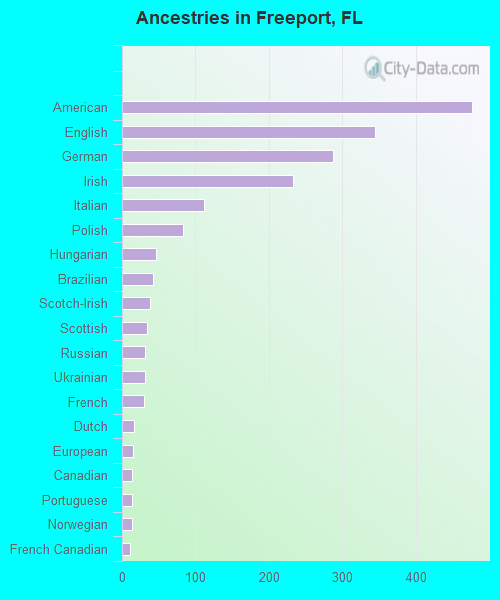
Ancestries in Freeport
476 20.4% American344 14.7% English287 12.3% German233 10.0% Irish111 4.7% Italian83 3.6% Polish46 2.0% Hungarian42 1.8% Brazilian38 1.6% Scotch-Irish34 1.5% Scottish32 1.4% Russian31 1.3% Ukrainian30 1.3% French16 0.7% Dutch15 0.6% European14 0.6% Canadian14 0.6% Portuguese13 0.6% Norwegian11 0.5% French Canadian
Children Nativity (place of birth) in Freeport
Children under 6 years - Living with two parents Both parents native 179 100.0% NativeBoth parents foreign-born 81 100.0% NativeOne native, one foreign-born parent 10 100.0% NativeChildren under 6 years - Living with one parent Native parent 176 100.0% NativeChildren 6 to 17 years - Living with two parents Both parents native 596 99.3% Native4 0.7% Foreign-bornBoth parents foreign-born 11 47.7% Native12 52.3% Foreign-bornOne native, one foreign-born parent 43 100.0% NativeChildren 6 to 17 years - Living with one parent Native parent 140 100.0% Native