Races in Front Royal, Virginia (VA) Detailed Stats
Data:
Races - White alone (%)
Races - White alone (% change since 2000)
Races - Black alone (%)
Races - Black alone (% change since 2000)
Races - American Indian alone (%)
Races - American Indian alone (% change since 2000)
Races - Asian alone (%)
Races - Asian alone (% change since 2000)
Races - Hispanic (%)
Races - Hispanic (% change since 2000)
Races - Native Hawaiian and Other Pacific Islander alone (%)
Races - Native Hawaiian and Other Pacific Islander alone (% change since 2000)
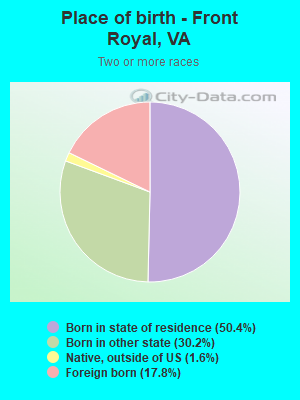
Races - Two or more races(%)
Races - Two or more races(% change since 2000)
Races - Other race alone (%)
Races - Other race alone (% change since 2000)
Racial diversity
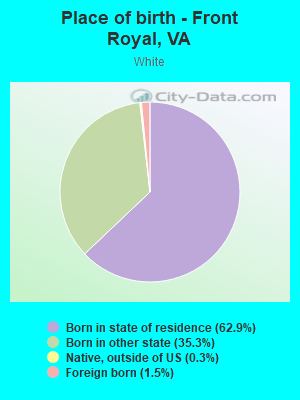
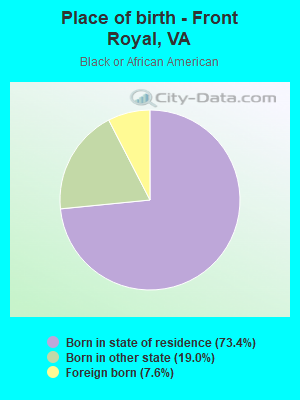
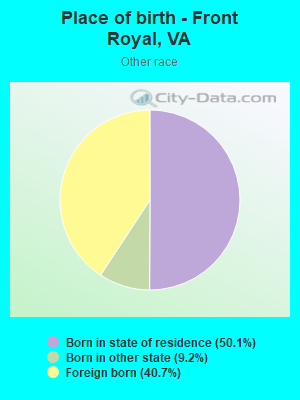
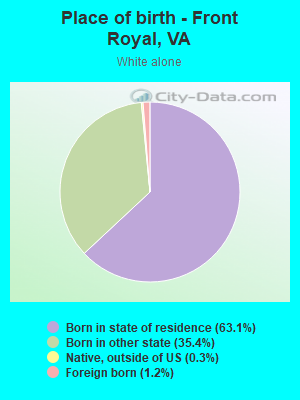
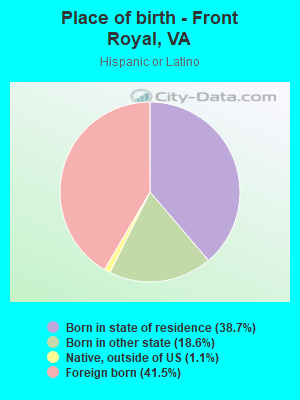
Place of birth - Born in state of residence (%)
Place of birth - Born in state of residence (%) - White
Place of birth - Born in state of residence (%) - Black or African American
Place of birth - Born in state of residence (%) - Asian
Place of birth - Born in state of residence (%) - Hispanic or Latino
Place of birth - Born in state of residence (%) - American Indian and Alaska Native
Place of birth - Born in state of residence (%) - Multirace
Place of birth - Born in state of residence (%) - Other Race
Place of birth - Born in other state (%)
Place of birth - Born in other state (%) - White
Place of birth - Born in other state (%) - Black or African American
Place of birth - Born in other state (%) - Asian
Place of birth - Born in other state (%) - Hispanic or Latino
Place of birth - Born in other state (%) - American Indian and Alaska Native
Place of birth - Born in other state (%) - Multirace
Place of birth - Born in other state (%) - Other Race
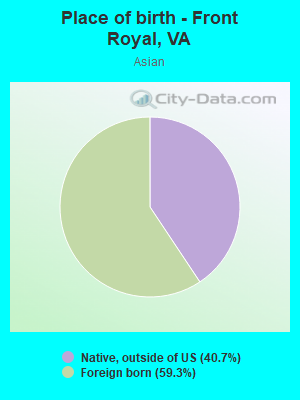
Place of birth - Native, outside of US (%)
Place of birth - Native, outside of US (%) - White
Place of birth - Native, outside of US (%) - Black or African American
Place of birth - Native, outside of US (%) - Asian
Place of birth - Native, outside of US (%) - Hispanic or Latino
Place of birth - Native, outside of US (%) - American Indian and Alaska Native
Place of birth - Native, outside of US (%) - Multirace
Place of birth - Native, outside of US (%) - Other Race
Place of birth - Foreign born (%)
Place of birth - Foreign born (%) - White
Place of birth - Foreign born (%) - Black or African American
Place of birth - Foreign born (%) - Asian
Place of birth - Foreign born (%) - Hispanic or Latino
Place of birth - Foreign born (%) - American Indian and Alaska Native
Place of birth - Foreign born (%) - Multirace
Place of birth - Foreign born (%) - Other Race
Residents speaking English at home (%)
Residents speaking English at home - Born in the United States (%)
Residents speaking English at home - Native, born elsewhere (%)
Residents speaking English at home - Foreign born (%)
Residents speaking Spanish at home (%)
Residents speaking Spanish at home - Born in the United States (%)
Residents speaking Spanish at home - Native, born elsewhere (%)
Residents speaking Spanish at home - Foreign born (%)
Residents speaking other language at home (%)
Residents speaking other language at home - Born in the United States (%)
Residents speaking other language at home - Native, born elsewhere (%)
Residents speaking other language at home - Foreign born (%)
Marital status - Never married (%)
Marital status - Now married (%)
Marital status - Separated (%)
Marital status - Widowed (%)
Marital status - Divorced (%)
Ancestries Reported - Arab (%)
Ancestries Reported - Czech (%)
Ancestries Reported - Danish (%)
Ancestries Reported - Dutch (%)
Ancestries Reported - English (%)
Ancestries Reported - French (%)
Ancestries Reported - French Canadian (%)
Ancestries Reported - German (%)
Ancestries Reported - Greek (%)
Ancestries Reported - Hungarian (%)
Ancestries Reported - Irish (%)
Ancestries Reported - Italian (%)
Ancestries Reported - Lithuanian (%)
Ancestries Reported - Norwegian (%)
Ancestries Reported - Polish (%)
Ancestries Reported - Portuguese (%)
Ancestries Reported - Russian (%)
Ancestries Reported - Scotch-Irish (%)
Ancestries Reported - Scottish (%)
Ancestries Reported - Slovak (%)
Ancestries Reported - Subsaharan African (%)
Ancestries Reported - Swedish (%)
Ancestries Reported - Swiss (%)
Ancestries Reported - Ukrainian (%)
Ancestries Reported - United States (%)
Ancestries Reported - Welsh (%)
Ancestries Reported - West Indian (%)
Ancestries Reported - Other (%)
Geographical mobility - Same house 1 year ago (%)
Geographical mobility - Same house 1 year ago (%) - White
Geographical mobility - Same house 1 year ago (%) - Black or African American
Geographical mobility - Same house 1 year ago (%) - Asian
Geographical mobility - Same house 1 year ago (%) - Hispanic or Latino
Geographical mobility - Same house 1 year ago (%) - American Indian and Alaska Native
Geographical mobility - Same house 1 year ago (%) - Multirace
Geographical mobility - Same house 1 year ago (%) - Other Race
Geographical mobility - Moved within same county (%)
Geographical mobility - Moved within same county (%) - White
Geographical mobility - Moved within same county (%) - Black or African American
Geographical mobility - Moved within same county (%) - Asian
Geographical mobility - Moved within same county (%) - Hispanic or Latino
Geographical mobility - Moved within same county (%) - American Indian and Alaska Native
Geographical mobility - Moved within same county (%) - Multirace
Geographical mobility - Moved within same county (%) - Other Race
Geographical mobility - Moved from different county within same state (%)
Geographical mobility - Moved from different county within same state (%) - White
Geographical mobility - Moved from different county within same state (%) - Black or African American
Geographical mobility - Moved from different county within same state (%) - Asian
Geographical mobility - Moved from different county within same state (%) - Hispanic or Latino
Geographical mobility - Moved from different county within same state (%) - American Indian and Alaska Native
Geographical mobility - Moved from different county within same state (%) - Multirace
Geographical mobility - Moved from different county within same state (%) - Other Race
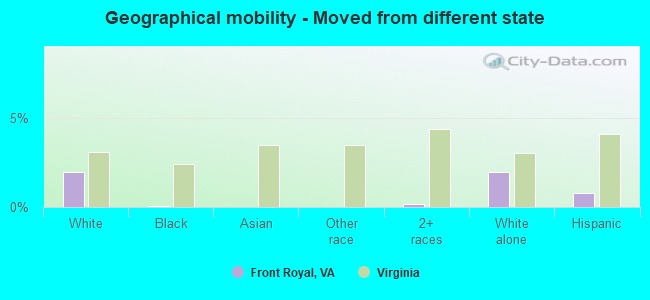
Geographical mobility - Moved from different state (%)
Geographical mobility - Moved from different state (%) - White
Geographical mobility - Moved from different state (%) - Black or African American
Geographical mobility - Moved from different state (%) - Asian
Geographical mobility - Moved from different state (%) - Hispanic or Latino
Geographical mobility - Moved from different state (%) - American Indian and Alaska Native
Geographical mobility - Moved from different state (%) - Multirace
Geographical mobility - Moved from different state (%) - Other Race
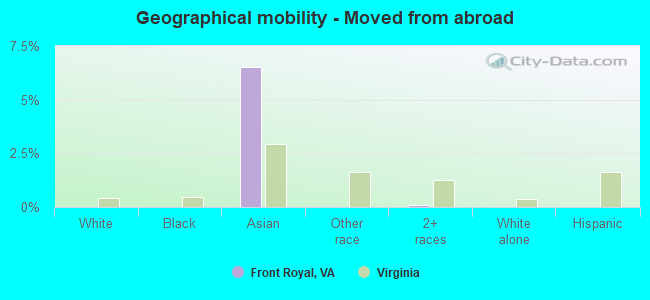
Geographical mobility - Moved from abroad (%)
Geographical mobility - Moved from abroad (%) - White
Geographical mobility - Moved from abroad (%) - Black or African American
Geographical mobility - Moved from abroad (%) - Asian
Geographical mobility - Moved from abroad (%) - Hispanic or Latino
Geographical mobility - Moved from abroad (%) - American Indian and Alaska Native
Geographical mobility - Moved from abroad (%) - Multirace
Geographical mobility - Moved from abroad (%) - Other Race
Place of birth for the foreign-born population - Ireland (%)
Place of birth for the foreign-born population - Denmark (%)
Place of birth for the foreign-born population - Norway (%)
Place of birth for the foreign-born population - Sweden (%)
Place of birth for the foreign-born population - United Kingdom (%)
Place of birth for the foreign-born population - England (%)
Place of birth for the foreign-born population - Scotland (%)
Place of birth for the foreign-born population - Other Northern Europe (%)
Place of birth for the foreign-born population - Austria (%)
Place of birth for the foreign-born population - Belgium (%)
Place of birth for the foreign-born population - France (%)
Place of birth for the foreign-born population - Germany (%)
Place of birth for the foreign-born population - Netherlands (%)
Place of birth for the foreign-born population - Switzerland (%)
Place of birth for the foreign-born population - Other Western Europe (%)
Place of birth for the foreign-born population - Greece (%)
Place of birth for the foreign-born population - Italy (%)
Place of birth for the foreign-born population - Portugal (%)
Place of birth for the foreign-born population - Spain (%)
Place of birth for the foreign-born population - Other Southern Europe (%)
Place of birth for the foreign-born population - Albania (%)
Place of birth for the foreign-born population - Belarus (%)
Place of birth for the foreign-born population - Bosnia and Herzegovina (%)
Place of birth for the foreign-born population - Bulgaria (%)
Place of birth for the foreign-born population - Croatia (%)
Place of birth for the foreign-born population - Czechoslovakia (%)
Place of birth for the foreign-born population - Hungary (%)
Place of birth for the foreign-born population - Latvia (%)
Place of birth for the foreign-born population - Lithuania (%)
Place of birth for the foreign-born population - North Macedonia (Macedonia) (%)
Place of birth for the foreign-born population - Moldova (%)
Place of birth for the foreign-born population - Poland (%)
Place of birth for the foreign-born population - Romania (%)
Place of birth for the foreign-born population - Russia (%)
Place of birth for the foreign-born population - Serbia (%)
Place of birth for the foreign-born population - Ukraine (%)
Place of birth for the foreign-born population - Other Eastern Europe (%)
Place of birth for the foreign-born population - China (%)
Place of birth for the foreign-born population - Hong Kong (%)
Place of birth for the foreign-born population - Taiwan (%)
Place of birth for the foreign-born population - Japan (%)
Place of birth for the foreign-born population - Korea (%)
Place of birth for the foreign-born population - Other Eastern Asia (%)
Place of birth for the foreign-born population - Afghanistan (%)
Place of birth for the foreign-born population - Bangladesh (%)
Place of birth for the foreign-born population - India (%)
Place of birth for the foreign-born population - Iran (%)
Place of birth for the foreign-born population - Kazakhstan (%)
Place of birth for the foreign-born population - Nepal (%)
Place of birth for the foreign-born population - Pakistan (%)
Place of birth for the foreign-born population - Sri Lanka (%)
Place of birth for the foreign-born population - Uzbekistan (%)
Place of birth for the foreign-born population - Other South Central Asia (%)
Place of birth for the foreign-born population - Burma (%)
Place of birth for the foreign-born population - Cambodia (%)
Place of birth for the foreign-born population - Indonesia (%)
Place of birth for the foreign-born population - Laos (%)
Place of birth for the foreign-born population - Malaysia (%)
Place of birth for the foreign-born population - Philippines (%)
Place of birth for the foreign-born population - Singapore (%)
Place of birth for the foreign-born population - Thailand (%)
Place of birth for the foreign-born population - Vietnam (%)
Place of birth for the foreign-born population - Other South Eastern Asia (%)
Place of birth for the foreign-born population - Armenia (%)
Place of birth for the foreign-born population - Iraq (%)
Place of birth for the foreign-born population - Israel (%)
Place of birth for the foreign-born population - Jordan (%)
Place of birth for the foreign-born population - Kuwait (%)
Place of birth for the foreign-born population - Lebanon (%)
Place of birth for the foreign-born population - Saudi Arabia (%)
Place of birth for the foreign-born population - Syria (%)
Place of birth for the foreign-born population - Turkey (%)
Place of birth for the foreign-born population - Yemen (%)
Place of birth for the foreign-born population - Other Western Asia (%)
Place of birth for the foreign-born population - Eritrea (%)
Place of birth for the foreign-born population - Ethiopia (%)
Place of birth for the foreign-born population - Kenya (%)
Place of birth for the foreign-born population - Somalia (%)
Place of birth for the foreign-born population - Uganda (%)
Place of birth for the foreign-born population - Zimbabwe (%)
Place of birth for the foreign-born population - Other Eastern Africa (%)
Place of birth for the foreign-born population - Cameroon (%)
Place of birth for the foreign-born population - Congo (%)
Place of birth for the foreign-born population - Democratic Republic of Congo (Zaire) (%)
Place of birth for the foreign-born population - Other Middle Africa (%)
Place of birth for the foreign-born population - Egypt (%)
Place of birth for the foreign-born population - Morocco (%)
Place of birth for the foreign-born population - Sudan (%)
Place of birth for the foreign-born population - Other Northern Africa (%)
Place of birth for the foreign-born population - South Africa (%)
Place of birth for the foreign-born population - Other Southern Africa (%)
Place of birth for the foreign-born population - Cabo Verde (%)
Place of birth for the foreign-born population - Ghana (%)
Place of birth for the foreign-born population - Liberia (%)
Place of birth for the foreign-born population - Nigeria (%)
Place of birth for the foreign-born population - Senegal (%)
Place of birth for the foreign-born population - Sierra Leone (%)
Place of birth for the foreign-born population - Other Western Africa (%)
Place of birth for the foreign-born population - Australia (%)
Place of birth for the foreign-born population - New Zealand (%)
Place of birth for the foreign-born population - Fiji (%)
Place of birth for the foreign-born population - Micronesia (%)
Place of birth for the foreign-born population - Bahamas (%)
Place of birth for the foreign-born population - Barbados (%)
Place of birth for the foreign-born population - Cuba (%)
Place of birth for the foreign-born population - Dominica (%)
Place of birth for the foreign-born population - Dominican Republic (%)
Place of birth for the foreign-born population - Grenada (%)
Place of birth for the foreign-born population - Haiti (%)
Place of birth for the foreign-born population - Jamaica (%)
Place of birth for the foreign-born population - St. Vincent and the Grenadines (%)
Place of birth for the foreign-born population - Trinidad and Tobago (%)
Place of birth for the foreign-born population - West Indies (%)
Place of birth for the foreign-born population - Other Caribbean (%)
Place of birth for the foreign-born population - Belize (%)
Place of birth for the foreign-born population - Costa Rica (%)
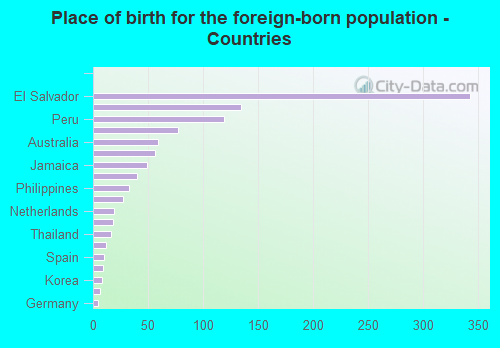
Place of birth for the foreign-born population - El Salvador (%)
Place of birth for the foreign-born population - Guatemala (%)
Place of birth for the foreign-born population - Honduras (%)
Place of birth for the foreign-born population - Mexico (%)
Place of birth for the foreign-born population - Nicaragua (%)
Place of birth for the foreign-born population - Panama (%)
Place of birth for the foreign-born population - Other Central America (%)
Place of birth for the foreign-born population - Argentina (%)
Place of birth for the foreign-born population - Bolivia (%)
Place of birth for the foreign-born population - Brazil (%)
Place of birth for the foreign-born population - Chile (%)
Place of birth for the foreign-born population - Colombia (%)
Place of birth for the foreign-born population - Ecuador (%)
Place of birth for the foreign-born population - Guyana (%)
Place of birth for the foreign-born population - Peru (%)
Place of birth for the foreign-born population - Uruguay (%)
Place of birth for the foreign-born population - Venezuela (%)
Place of birth for the foreign-born population - Other South America (%)
Place of birth for the foreign-born population - Canada (%)
Place of birth for the foreign-born population - Other Northern America (%)
Place of birth for the foreign-born population - Other (%)
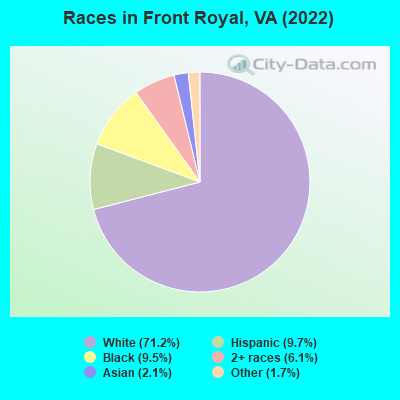
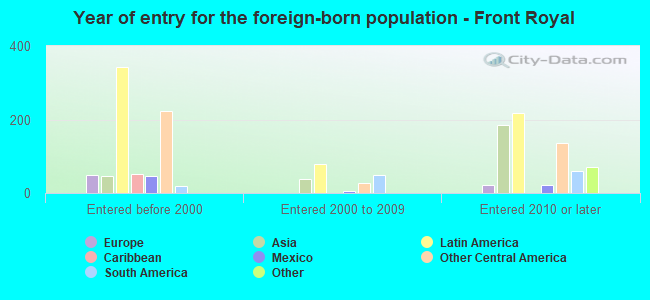
According to 2022 data, the most numerous races in Front Royal, VA are White alone (10,793 residents), Black alone (1,438 residents), and Hispanic (1,465 residents). 89.4% of Front Royal residents speak English at home. 6.9% of Front Royal, VA residents are foreign-born (4.3% born in Latin America, 1.6% born in Asia), which is 73.7% less than the foreign-born rate of 12.0% across the entire state of Virginia.
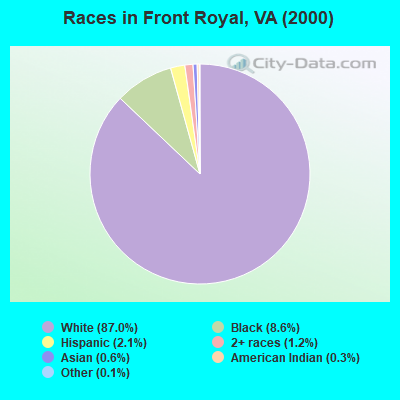
Race distribution in Front Royal
2000 2022
4,965,637 70.2% White alone 1,376,378 19.4% Black alone 329,540 4.7% Hispanic 259,277 3.7% Asian alone 114,022 1.6% Two or more races 18,596 0.3% American Indian alone 11,685 0.2% Other race alone 3,380 0.05% Native Hawaiian and Other
5,095,130 58.7% White alone 1,594,785 18.4% Black alone 905,750 10.4% Hispanic 602,881 6.9% Asian alone 406,047 4.7% Two or more races 60,419 0.7% Other race alone 11,738 0.1% American Indian alone 6,869 0.08% Native Hawaiian and Other
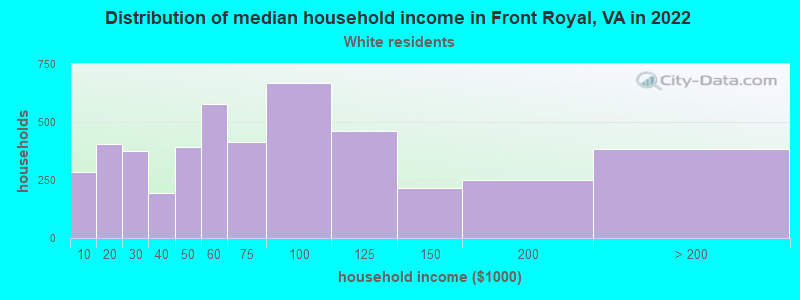
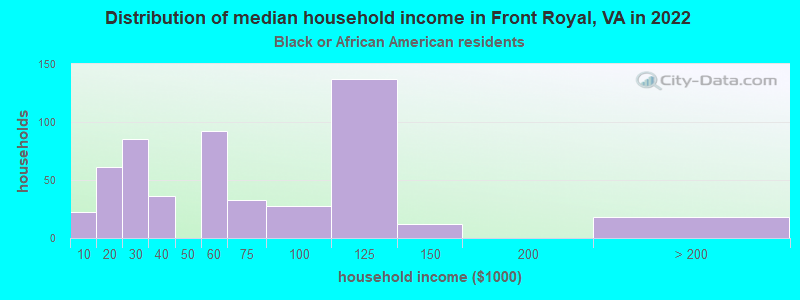
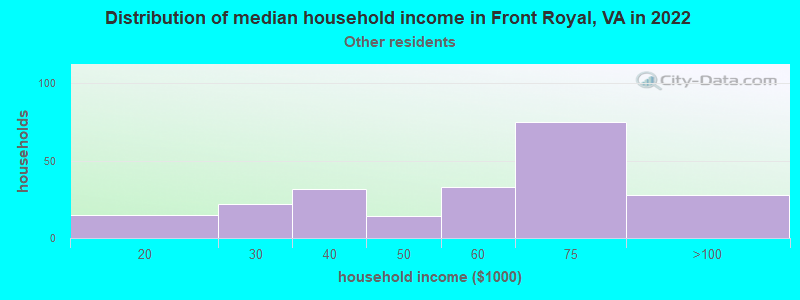
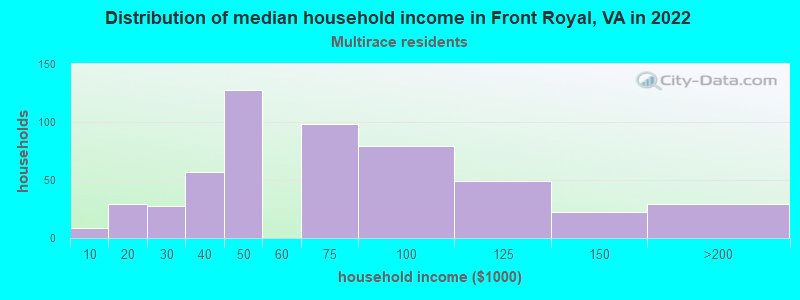
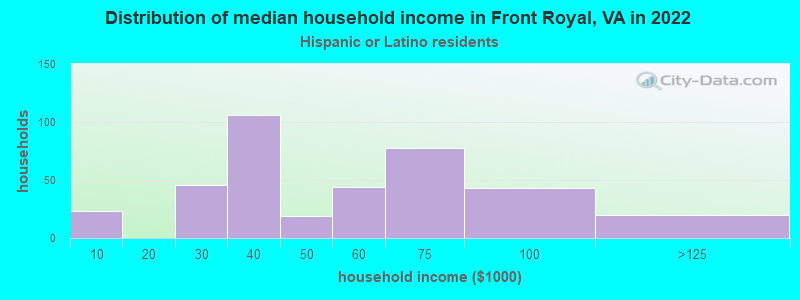
Income and house value in Front Royal Median household income in 2022 $63,498 White non-Hispanic householders$54,779 Black householders$57,462 Some other race householders$61,392 Two or more races householders$50,121 Hispanic or Latino race householdersMedian 2022 house value $299,837 White Non-Hispanic householders$246,873 Black or African American householders $279,534 Asian householders$375,164 Two or more races householders$434,014 Hispanic or Latino householders
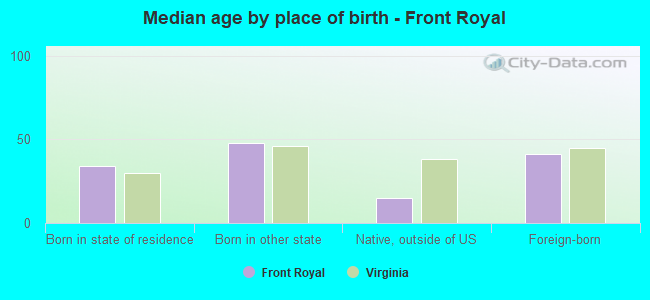
Median age by race in Front Royal
43.0 Median age for White residents40.0 45.8 35.7 Median age for Black or African American residents38.7 32.9 -682,215,742.8 Median age for American Indian / Alaska Native residents-682,352,940.5 -687,861,271.0 39.9 Median age for Asian residents14.8 44.7 -611,955,419.9 Median age for Native Hawaiian / Pacific Islander residents-541,531,822.5 -714,150,046.8 19.9 Median age for Other race residents19.7 21.8 30.4 Median age for Two or more races residents30.7 27.2 43.0 Median age for White alone residents40.5 46.5 25.4 Median age for Hispanic or Latino residents20.0 25.9
Owner/renter occupied households by race in Front Royal
House owners and renters - White residents 2,819 62.2% Owner occupied1,717 37.8% Renter occupiedHouse owners and renters - Black or African American residents 141 27.5% Owner occupied372 72.5% Renter occupiedHouse owners and renters - Asian residents 40 100.0% Renter occupiedHouse owners and renters - Other race residents 120 46.4% Owner occupied139 53.6% Renter occupiedHouse owners and renters - Two or more races residents 421 76.8% Owner occupied128 23.2% Renter occupiedHouse owners and renters - White alone residents 2,811 61.9% Owner occupied1,731 38.1% Renter occupiedHouse owners and renters - Hispanic or Latino residents 155 39.6% Owner occupied237 60.4% Renter occupied
Language usage in Front Royal
English speakers - Total 89.4% of residents of Front Royal speak English at home.
7.6% of residents speak Spanish at home 852 78.5% Speak English very well233 21.5% Speak English less than very well2.9% of residents speak other language at home 84 20.2% Speak English very well331 79.8% Speak English less than very well
English speakers - Born in the United States 97.4% of residents of Front Royal speak English at home.
2.2% of residents speak Spanish at home 102 100.0% Speak English very well
English speakers - Native, born elsewhere 20.0% of residents of Front Royal speak English at home.
9.7% of residents speak Spanish at home 17 100.0% Speak English very well114.9% of residents speak other language at home 2 1.0% Speak English very well199 99.0% Speak English less than very well
English speakers - Foreign-born 20.9% of residents of Front Royal speak English at home.
53.1% of residents speak Spanish at home 342 61.3% Speak English very well216 38.7% Speak English less than very well26.4% of residents speak other language at home 74 26.7% Speak English very well203 73.3% Speak English less than very well
White (Caucasian) - Speak only English Native:
98.8% (9,992)Foreign-born:
49.4% (82)
White (Caucasian) - Speak another language Native:
1.6% (166)Foreign-born:
55.3% (91)
Black or African American - Speak only English Native:
99.8% (1,320)Foreign-born:
40.8% (47)
Asian - Speak another language Native:
100.0% (123)Foreign-born:
98.9% (191)
Other race - Speak only English Native:
51.6% (264)Foreign-born:
22.5% (83)
Other race - Speak another language Native:
49.2% (252)Foreign-born:
80.1% (296)
Two or more races - Speak only English Native:
86.6% (1,066)Foreign-born:
7.5% (22)
Two or more races - Speak another language Native:
12.2% (150)Foreign-born:
92.8% (277)
White alone - Speak only English Native:
98.7% (9,920)Foreign-born:
66.0% (87)
White alone - Speak another language Native:
1.3% (134)Foreign-born:
30.9% (41)
Hispanic or Latino - Speak only English Native:
48.8% (383)Foreign-born:
9.7% (59)
Hispanic or Latino - Speak another language Native:
51.1% (401)Foreign-born:
90.5% (550)
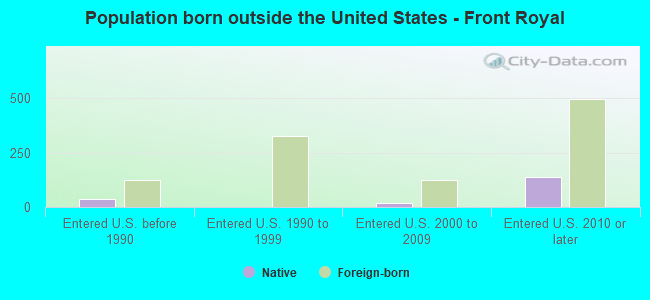
Foreign-born residents in Front Royal 1,048 residents are foreign born (4.3% Latin America , 1.6% Asia ).
This city:
6.9%Virginia:
12.6%
Marital status for residents in Front Royal Marital status - White (Caucasian) population 15 years and over
Males 33.4% Never married46.0% Now married0.9% Separated3.0% Widowed16.8% DivorcedFemales 25.0% Never married43.5% Now married2.4% Separated13.7% Widowed15.4% DivorcedWomen who gave birth in the past 12 months Now married:
91.9% (191)Unmarried:
8.1% (17)
Women who did not give birth in the past 12 months Now married:
41.3% (827)Unmarried:
58.7% (1,174)
Marital status - Black or African American population 15 years and over
Males 14.2% Never married53.2% Now married3.5% Separated3.3% Widowed25.9% DivorcedFemales 44.1% Never married40.8% Now married0.0% Separated7.6% Widowed7.6% DivorcedWomen who gave birth in the past 12 months Now married:
0.0% (0)Unmarried:
100.0% (20)
Women who did not give birth in the past 12 months Now married:
26.4% (73)Unmarried:
73.6% (203)
Marital status - Asian population 15 years and over
Males 0.0% Never married100.0% Now married0.0% Separated0.0% Widowed0.0% DivorcedFemales 7.3% Never married92.7% Now married0.0% Separated0.0% Widowed0.0% DivorcedWomen who gave birth in the past 12 months Now married:
100.0% (17)Unmarried:
0.0% (0)
Women who did not give birth in the past 12 months Now married:
91.5% (89)Unmarried:
8.5% (8)
Marital status - Other race population 15 years and over
Males 53.6% Never married42.0% Now married0.0% Separated0.0% Widowed4.3% DivorcedFemales 50.2% Never married26.5% Now married0.0% Separated10.9% Widowed12.3% DivorcedWomen who did not give birth in the past 12 months Now married:
28.6% (74)Unmarried:
71.4% (184)
Marital status - Two or more races population 15 years and over
Males 39.7% Never married50.0% Now married3.3% Separated0.0% Widowed6.9% DivorcedFemales 62.9% Never married28.0% Now married1.6% Separated4.9% Widowed2.7% DivorcedWomen who did not give birth in the past 12 months Now married:
27.7% (137)Unmarried:
72.3% (357)
Marital status - White alone, not Hispanic / Latino population 15 years and over
Males 33.1% Never married45.9% Now married0.9% Separated3.0% Widowed17.1% DivorcedFemales 24.2% Never married44.1% Now married2.5% Separated14.2% Widowed15.0% DivorcedWomen who gave birth in the past 12 months Now married:
91.9% (198)Unmarried:
8.1% (18)
Women who did not give birth in the past 12 months Now married:
41.9% (824)Unmarried:
58.1% (1,143)
Marital status - Hispanic or Latino population 15 years and over
Males 46.1% Never married47.1% Now married3.2% Separated0.0% Widowed3.6% DivorcedFemales 67.8% Never married21.0% Now married0.0% Separated0.0% Widowed11.2% DivorcedWomen who did not give birth in the past 12 months Now married:
22.7% (112)Unmarried:
77.3% (383)
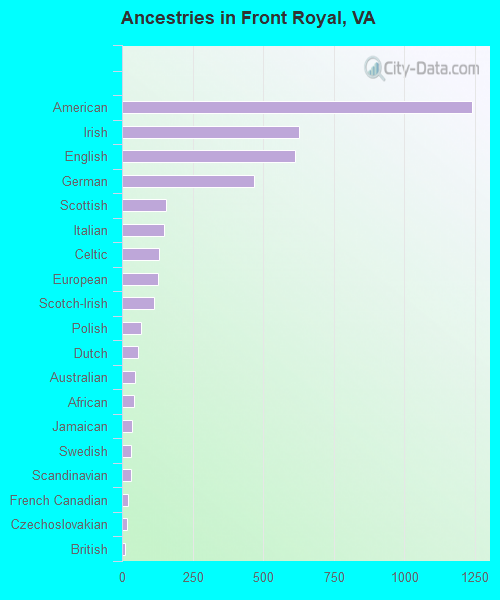
Ancestries in Front Royal
1,239 19.4% American626 9.8% Irish613 9.6% English468 7.3% German156 2.4% Scottish150 2.3% Italian130 2.0% Celtic129 2.0% European113 1.8% Scotch-Irish67 1.0% Polish58 0.9% Dutch45 0.7% Australian42 0.7% African36 0.6% Jamaican32 0.5% Swedish31 0.5% Scandinavian21 0.3% French Canadian16 0.3% Czechoslovakian12 0.2% British11 0.2% French10 0.2% Northern European6 0.09% Portuguese4 0.06% Ukrainian
Children Nativity (place of birth) in Front Royal
Children under 6 years - Living with two parents Both parents native 680 100.0% NativeBoth parents foreign-born 43 100.0% NativeOne native, one foreign-born parent 30 100.0% NativeChildren under 6 years - Living with one parent Native parent 319 100.0% NativeChildren 6 to 17 years - Living with two parents Both parents native 703 99.6% Native3 0.4% Foreign-bornBoth parents foreign-born 177 100.0% NativeOne native, one foreign-born parent 28 69.0% Native13 31.0% Foreign-bornChildren 6 to 17 years - Living with one parent Native parent 959 100.0% NativeForeign-born parent 163 51.9% Native151 48.1% Foreign-born
Grandparents responsible for own grandchildren in Front Royal
Grandparents (30 to 59 years) White / Caucasian 58 100.0% Not responsible for grandchildrenBlack or African American 76 85.4% Responsible for grandchildren13 14.6% Not responsible for grandchildrenOther race 61 100.0% Responsible for grandchildrenTwo or more races 46 100.0% Not responsible for grandchildrenWhite alone, not Hispanic / Latino 65 100.0% Not responsible for grandchildrenHispanic or Latino 52 100.0% Responsible for grandchildrenGrandparents (60 years and over) White / Caucasian 46 20.2% Responsible for grandchildren183 79.8% Not responsible for grandchildrenBlack or African American 64 100.0% Responsible for grandchildrenWhite alone, not Hispanic / Latino 47 19.6% Responsible for grandchildren193 80.4% Not responsible for grandchildren