Races in Gainesville, Georgia (GA) Detailed Stats
Data:
Races - White alone (%)
Races - White alone (% change since 2000)
Races - Black alone (%)
Races - Black alone (% change since 2000)
Races - American Indian alone (%)
Races - American Indian alone (% change since 2000)
Races - Asian alone (%)
Races - Asian alone (% change since 2000)
Races - Hispanic (%)
Races - Hispanic (% change since 2000)
Races - Native Hawaiian and Other Pacific Islander alone (%)
Races - Native Hawaiian and Other Pacific Islander alone (% change since 2000)
Races - Two or more races(%)
Races - Two or more races(% change since 2000)
Races - Other race alone (%)
Races - Other race alone (% change since 2000)
Racial diversity
Place of birth - Born in state of residence (%)
Place of birth - Born in state of residence (%) - White
Place of birth - Born in state of residence (%) - Black or African American
Place of birth - Born in state of residence (%) - Asian
Place of birth - Born in state of residence (%) - Hispanic or Latino
Place of birth - Born in state of residence (%) - American Indian and Alaska Native
Place of birth - Born in state of residence (%) - Multirace
Place of birth - Born in state of residence (%) - Other Race
Place of birth - Born in other state (%)
Place of birth - Born in other state (%) - White
Place of birth - Born in other state (%) - Black or African American
Place of birth - Born in other state (%) - Asian
Place of birth - Born in other state (%) - Hispanic or Latino
Place of birth - Born in other state (%) - American Indian and Alaska Native
Place of birth - Born in other state (%) - Multirace
Place of birth - Born in other state (%) - Other Race
Place of birth - Native, outside of US (%)
Place of birth - Native, outside of US (%) - White
Place of birth - Native, outside of US (%) - Black or African American
Place of birth - Native, outside of US (%) - Asian
Place of birth - Native, outside of US (%) - Hispanic or Latino
Place of birth - Native, outside of US (%) - American Indian and Alaska Native
Place of birth - Native, outside of US (%) - Multirace
Place of birth - Native, outside of US (%) - Other Race
Place of birth - Foreign born (%)
Place of birth - Foreign born (%) - White
Place of birth - Foreign born (%) - Black or African American
Place of birth - Foreign born (%) - Asian
Place of birth - Foreign born (%) - Hispanic or Latino
Place of birth - Foreign born (%) - American Indian and Alaska Native
Place of birth - Foreign born (%) - Multirace
Place of birth - Foreign born (%) - Other Race
Residents speaking English at home (%)
Residents speaking English at home - Born in the United States (%)
Residents speaking English at home - Native, born elsewhere (%)
Residents speaking English at home - Foreign born (%)
Residents speaking Spanish at home (%)
Residents speaking Spanish at home - Born in the United States (%)
Residents speaking Spanish at home - Native, born elsewhere (%)
Residents speaking Spanish at home - Foreign born (%)
Residents speaking other language at home (%)
Residents speaking other language at home - Born in the United States (%)
Residents speaking other language at home - Native, born elsewhere (%)
Residents speaking other language at home - Foreign born (%)
Marital status - Never married (%)
Marital status - Now married (%)
Marital status - Separated (%)
Marital status - Widowed (%)
Marital status - Divorced (%)
Ancestries Reported - Arab (%)
Ancestries Reported - Czech (%)
Ancestries Reported - Danish (%)
Ancestries Reported - Dutch (%)
Ancestries Reported - English (%)
Ancestries Reported - French (%)
Ancestries Reported - French Canadian (%)
Ancestries Reported - German (%)
Ancestries Reported - Greek (%)
Ancestries Reported - Hungarian (%)
Ancestries Reported - Irish (%)
Ancestries Reported - Italian (%)
Ancestries Reported - Lithuanian (%)
Ancestries Reported - Norwegian (%)
Ancestries Reported - Polish (%)
Ancestries Reported - Portuguese (%)
Ancestries Reported - Russian (%)
Ancestries Reported - Scotch-Irish (%)
Ancestries Reported - Scottish (%)
Ancestries Reported - Slovak (%)
Ancestries Reported - Subsaharan African (%)
Ancestries Reported - Swedish (%)
Ancestries Reported - Swiss (%)
Ancestries Reported - Ukrainian (%)
Ancestries Reported - United States (%)
Ancestries Reported - Welsh (%)
Ancestries Reported - West Indian (%)
Ancestries Reported - Other (%)
Geographical mobility - Same house 1 year ago (%)
Geographical mobility - Same house 1 year ago (%) - White
Geographical mobility - Same house 1 year ago (%) - Black or African American
Geographical mobility - Same house 1 year ago (%) - Asian
Geographical mobility - Same house 1 year ago (%) - Hispanic or Latino
Geographical mobility - Same house 1 year ago (%) - American Indian and Alaska Native
Geographical mobility - Same house 1 year ago (%) - Multirace
Geographical mobility - Same house 1 year ago (%) - Other Race
Geographical mobility - Moved within same county (%)
Geographical mobility - Moved within same county (%) - White
Geographical mobility - Moved within same county (%) - Black or African American
Geographical mobility - Moved within same county (%) - Asian
Geographical mobility - Moved within same county (%) - Hispanic or Latino
Geographical mobility - Moved within same county (%) - American Indian and Alaska Native
Geographical mobility - Moved within same county (%) - Multirace
Geographical mobility - Moved within same county (%) - Other Race
Geographical mobility - Moved from different county within same state (%)
Geographical mobility - Moved from different county within same state (%) - White
Geographical mobility - Moved from different county within same state (%) - Black or African American
Geographical mobility - Moved from different county within same state (%) - Asian
Geographical mobility - Moved from different county within same state (%) - Hispanic or Latino
Geographical mobility - Moved from different county within same state (%) - American Indian and Alaska Native
Geographical mobility - Moved from different county within same state (%) - Multirace
Geographical mobility - Moved from different county within same state (%) - Other Race
Geographical mobility - Moved from different state (%)
Geographical mobility - Moved from different state (%) - White
Geographical mobility - Moved from different state (%) - Black or African American
Geographical mobility - Moved from different state (%) - Asian
Geographical mobility - Moved from different state (%) - Hispanic or Latino
Geographical mobility - Moved from different state (%) - American Indian and Alaska Native
Geographical mobility - Moved from different state (%) - Multirace
Geographical mobility - Moved from different state (%) - Other Race
Geographical mobility - Moved from abroad (%)
Geographical mobility - Moved from abroad (%) - White
Geographical mobility - Moved from abroad (%) - Black or African American
Geographical mobility - Moved from abroad (%) - Asian
Geographical mobility - Moved from abroad (%) - Hispanic or Latino
Geographical mobility - Moved from abroad (%) - American Indian and Alaska Native
Geographical mobility - Moved from abroad (%) - Multirace
Geographical mobility - Moved from abroad (%) - Other Race
Place of birth for the foreign-born population - Ireland (%)
Place of birth for the foreign-born population - Denmark (%)
Place of birth for the foreign-born population - Norway (%)
Place of birth for the foreign-born population - Sweden (%)
Place of birth for the foreign-born population - United Kingdom (%)
Place of birth for the foreign-born population - England (%)
Place of birth for the foreign-born population - Scotland (%)
Place of birth for the foreign-born population - Other Northern Europe (%)
Place of birth for the foreign-born population - Austria (%)
Place of birth for the foreign-born population - Belgium (%)
Place of birth for the foreign-born population - France (%)
Place of birth for the foreign-born population - Germany (%)
Place of birth for the foreign-born population - Netherlands (%)
Place of birth for the foreign-born population - Switzerland (%)
Place of birth for the foreign-born population - Other Western Europe (%)
Place of birth for the foreign-born population - Greece (%)
Place of birth for the foreign-born population - Italy (%)
Place of birth for the foreign-born population - Portugal (%)
Place of birth for the foreign-born population - Spain (%)
Place of birth for the foreign-born population - Other Southern Europe (%)
Place of birth for the foreign-born population - Albania (%)
Place of birth for the foreign-born population - Belarus (%)
Place of birth for the foreign-born population - Bosnia and Herzegovina (%)
Place of birth for the foreign-born population - Bulgaria (%)
Place of birth for the foreign-born population - Croatia (%)
Place of birth for the foreign-born population - Czechoslovakia (%)
Place of birth for the foreign-born population - Hungary (%)
Place of birth for the foreign-born population - Latvia (%)
Place of birth for the foreign-born population - Lithuania (%)
Place of birth for the foreign-born population - North Macedonia (Macedonia) (%)
Place of birth for the foreign-born population - Moldova (%)
Place of birth for the foreign-born population - Poland (%)
Place of birth for the foreign-born population - Romania (%)
Place of birth for the foreign-born population - Russia (%)
Place of birth for the foreign-born population - Serbia (%)
Place of birth for the foreign-born population - Ukraine (%)
Place of birth for the foreign-born population - Other Eastern Europe (%)
Place of birth for the foreign-born population - China (%)
Place of birth for the foreign-born population - Hong Kong (%)
Place of birth for the foreign-born population - Taiwan (%)
Place of birth for the foreign-born population - Japan (%)
Place of birth for the foreign-born population - Korea (%)
Place of birth for the foreign-born population - Other Eastern Asia (%)
Place of birth for the foreign-born population - Afghanistan (%)
Place of birth for the foreign-born population - Bangladesh (%)
Place of birth for the foreign-born population - India (%)
Place of birth for the foreign-born population - Iran (%)
Place of birth for the foreign-born population - Kazakhstan (%)
Place of birth for the foreign-born population - Nepal (%)
Place of birth for the foreign-born population - Pakistan (%)
Place of birth for the foreign-born population - Sri Lanka (%)
Place of birth for the foreign-born population - Uzbekistan (%)
Place of birth for the foreign-born population - Other South Central Asia (%)
Place of birth for the foreign-born population - Burma (%)
Place of birth for the foreign-born population - Cambodia (%)
Place of birth for the foreign-born population - Indonesia (%)
Place of birth for the foreign-born population - Laos (%)
Place of birth for the foreign-born population - Malaysia (%)
Place of birth for the foreign-born population - Philippines (%)
Place of birth for the foreign-born population - Singapore (%)
Place of birth for the foreign-born population - Thailand (%)
Place of birth for the foreign-born population - Vietnam (%)
Place of birth for the foreign-born population - Other South Eastern Asia (%)
Place of birth for the foreign-born population - Armenia (%)
Place of birth for the foreign-born population - Iraq (%)
Place of birth for the foreign-born population - Israel (%)
Place of birth for the foreign-born population - Jordan (%)
Place of birth for the foreign-born population - Kuwait (%)
Place of birth for the foreign-born population - Lebanon (%)
Place of birth for the foreign-born population - Saudi Arabia (%)
Place of birth for the foreign-born population - Syria (%)
Place of birth for the foreign-born population - Turkey (%)
Place of birth for the foreign-born population - Yemen (%)
Place of birth for the foreign-born population - Other Western Asia (%)
Place of birth for the foreign-born population - Eritrea (%)
Place of birth for the foreign-born population - Ethiopia (%)
Place of birth for the foreign-born population - Kenya (%)
Place of birth for the foreign-born population - Somalia (%)
Place of birth for the foreign-born population - Uganda (%)
Place of birth for the foreign-born population - Zimbabwe (%)
Place of birth for the foreign-born population - Other Eastern Africa (%)
Place of birth for the foreign-born population - Cameroon (%)
Place of birth for the foreign-born population - Congo (%)
Place of birth for the foreign-born population - Democratic Republic of Congo (Zaire) (%)
Place of birth for the foreign-born population - Other Middle Africa (%)
Place of birth for the foreign-born population - Egypt (%)
Place of birth for the foreign-born population - Morocco (%)
Place of birth for the foreign-born population - Sudan (%)
Place of birth for the foreign-born population - Other Northern Africa (%)
Place of birth for the foreign-born population - South Africa (%)
Place of birth for the foreign-born population - Other Southern Africa (%)
Place of birth for the foreign-born population - Cabo Verde (%)
Place of birth for the foreign-born population - Ghana (%)
Place of birth for the foreign-born population - Liberia (%)
Place of birth for the foreign-born population - Nigeria (%)
Place of birth for the foreign-born population - Senegal (%)
Place of birth for the foreign-born population - Sierra Leone (%)
Place of birth for the foreign-born population - Other Western Africa (%)
Place of birth for the foreign-born population - Australia (%)
Place of birth for the foreign-born population - New Zealand (%)
Place of birth for the foreign-born population - Fiji (%)
Place of birth for the foreign-born population - Micronesia (%)
Place of birth for the foreign-born population - Bahamas (%)
Place of birth for the foreign-born population - Barbados (%)
Place of birth for the foreign-born population - Cuba (%)
Place of birth for the foreign-born population - Dominica (%)
Place of birth for the foreign-born population - Dominican Republic (%)
Place of birth for the foreign-born population - Grenada (%)
Place of birth for the foreign-born population - Haiti (%)
Place of birth for the foreign-born population - Jamaica (%)
Place of birth for the foreign-born population - St. Vincent and the Grenadines (%)
Place of birth for the foreign-born population - Trinidad and Tobago (%)
Place of birth for the foreign-born population - West Indies (%)
Place of birth for the foreign-born population - Other Caribbean (%)
Place of birth for the foreign-born population - Belize (%)
Place of birth for the foreign-born population - Costa Rica (%)
Place of birth for the foreign-born population - El Salvador (%)
Place of birth for the foreign-born population - Guatemala (%)
Place of birth for the foreign-born population - Honduras (%)
Place of birth for the foreign-born population - Mexico (%)
Place of birth for the foreign-born population - Nicaragua (%)
Place of birth for the foreign-born population - Panama (%)
Place of birth for the foreign-born population - Other Central America (%)
Place of birth for the foreign-born population - Argentina (%)
Place of birth for the foreign-born population - Bolivia (%)
Place of birth for the foreign-born population - Brazil (%)
Place of birth for the foreign-born population - Chile (%)
Place of birth for the foreign-born population - Colombia (%)
Place of birth for the foreign-born population - Ecuador (%)
Place of birth for the foreign-born population - Guyana (%)
Place of birth for the foreign-born population - Peru (%)
Place of birth for the foreign-born population - Uruguay (%)
Place of birth for the foreign-born population - Venezuela (%)
Place of birth for the foreign-born population - Other South America (%)
Place of birth for the foreign-born population - Canada (%)
Place of birth for the foreign-born population - Other Northern America (%)
Place of birth for the foreign-born population - Other (%)
Latest news about races in Gainesville, GA collected exclusively by city-data.com from local newspapers, TV, and radio stations
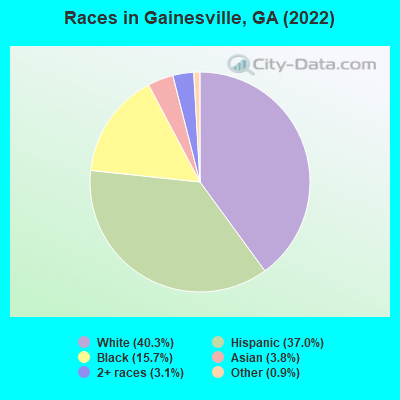
According to 2022 data, the most numerous races in Gainesville, GA are White alone (17,889 residents), Black alone (6,964 residents), and Hispanic (16,432 residents). 61.1% of Gainesville residents speak English at home. 22.3% of Gainesville, GA residents are foreign-born (17.5% born in Latin America, 2.3% born in Asia), which is 55.2% greater than the foreign-born rate of 10.0% across the entire state of Georgia.
Race distribution in Gainesville
2000 2022
5,128,661 62.6% White alone 2,331,465 28.5% Black alone 435,227 5.3% Hispanic 171,513 2.1% Asian alone 87,364 1.1% Two or more races 17,670 0.2% American Indian alone 11,275 0.1% Other race alone 3,278 0.04% Native Hawaiian and Other
5,415,657 49.6% White alone 3,349,240 30.7% Black alone 1,132,604 10.4% Hispanic 479,156 4.4% Asian alone 462,923 4.2% Two or more races 54,416 0.5% Other race alone 11,923 0.1% American Indian alone 6,957 0.06% Native Hawaiian and Other
Income and house value in Gainesville Median household income in 2022 $64,734 White non-Hispanic householders$54,699 Black householders$54,934 Asian householders$63,639 Some other race householders$75,173 Two or more races householders$72,640 Hispanic or Latino race householdersMedian 2022 house value $433,918 White Non-Hispanic householders$189,729 Black or African American householders $407,859 Asian householders$299,819 Some other race householders$274,639 Two or more races householders$293,377 Hispanic or Latino householders
Median age by race in Gainesville
37.2 Median age for White residents34.4 40.3 34.8 Median age for Black or African American residents38.2 32.4 47.1 Median age for American Indian / Alaska Native residents35.6 36.2 25.5 Median age for Asian residents26.9 24.0 -666,666,666.0 Median age for Native Hawaiian / Pacific Islander residents-666,666,666.0 -666,666,666.0 26.7 Median age for Other race residents28.6 24.9 28.2 Median age for Two or more races residents25.8 29.9 44.1 Median age for White alone residents41.7 48.2 25.8 Median age for Hispanic or Latino residents24.0 27.3
Owner/renter occupied households by race in Gainesville
House owners and renters - White residents 4,807 52.5% Owner occupied4,342 47.5% Renter occupiedHouse owners and renters - Black or African American residents 671 25.2% Owner occupied1,997 74.8% Renter occupiedHouse owners and renters - American Indian / Alaska Native residents 24 100.0% Renter occupiedHouse owners and renters - Asian residents 154 40.5% Owner occupied227 59.5% Renter occupiedHouse owners and renters - Native Hawaiian / Pacific Islander residents 19 100.0% Owner occupiedHouse owners and renters - Other race residents 546 27.3% Owner occupied1,457 72.7% Renter occupiedHouse owners and renters - Two or more races residents 862 39.7% Owner occupied1,309 60.3% Renter occupiedHouse owners and renters - White alone residents 4,368 53.5% Owner occupied3,792 46.5% Renter occupiedHouse owners and renters - Hispanic or Latino residents 1,571 37.7% Owner occupied2,594 62.3% Renter occupied
Language usage in Gainesville
English speakers - Total 61.1% of residents of Gainesville speak English at home.
31.7% of residents speak Spanish at home 7,530 57.4% Speak English very well5,587 42.6% Speak English less than very well6.8% of residents speak other language at home 1,944 69.1% Speak English very well871 30.9% Speak English less than very well
English speakers - Born in the United States 83.6% of residents of Gainesville speak English at home.
16.5% of residents speak Spanish at home 1,878 93.1% Speak English very well140 6.9% Speak English less than very well2.0% of residents speak other language at home 241 100.0% Speak English very well
English speakers - Native, born elsewhere 56.1% of residents of Gainesville speak English at home.
87.2% of residents speak Spanish at home 210 78.9% Speak English very well56 21.1% Speak English less than very well1.3% of residents speak other language at home 4 100.0% Speak English very well
English speakers - Foreign-born 10.8% of residents of Gainesville speak English at home.
70.1% of residents speak Spanish at home 2,025 29.1% Speak English very well4,928 70.9% Speak English less than very well18.2% of residents speak other language at home 1,032 57.2% Speak English very well771 42.8% Speak English less than very well
White (Caucasian) - Speak only English Native:
84.7% (16,772)Foreign-born:
14.5% (188)
White (Caucasian) - Speak another language Native:
10.9% (2,154)Foreign-born:
100.0% (1,296)
Black or African American - Speak only English Native:
91.7% (4,729)Foreign-born:
23.4% (265)
Black or African American - Speak another language Native:
8.8% (454)Foreign-born:
77.6% (881)
Asian - Speak only English Native:
2.2% (14)Foreign-born:
4.8% (47)
Asian - Speak another language Native:
100.0% (623)Foreign-born:
94.1% (939)
Other race - Speak only English Native:
31.0% (865)Foreign-born:
7.7% (292)
Other race - Speak another language Native:
69.3% (1,932)Foreign-born:
86.3% (3,263)
Two or more races - Speak only English Native:
51.8% (1,764)Foreign-born:
6.8% (216)
Two or more races - Speak another language Native:
47.9% (1,634)Foreign-born:
94.1% (3,009)
White alone - Speak only English Native:
96.3% (16,261)Foreign-born:
42.4% (179)
White alone - Speak another language Native:
3.5% (599)Foreign-born:
56.9% (240)
Hispanic or Latino - Speak only English Native:
22.9% (1,655)Foreign-born:
9.0% (684)
Hispanic or Latino - Speak another language Native:
77.7% (5,616)Foreign-born:
92.3% (7,026)
Foreign-born residents in Gainesville 9,904 residents are foreign born (17.5% Latin America , 2.3% Asia ).
This city:
22.3%Georgia:
10.4%
Marital status for residents in Gainesville Marital status - White (Caucasian) population 15 years and over
Males 36.8% Never married50.5% Now married0.9% Separated3.2% Widowed8.6% DivorcedFemales 32.4% Never married40.8% Now married3.8% Separated9.2% Widowed13.9% DivorcedWomen who gave birth in the past 12 months Now married:
88.0% (314)Unmarried:
12.0% (43)
Women who did not give birth in the past 12 months Now married:
36.9% (2,122)Unmarried:
63.1% (3,636)
Marital status - Black or African American population 15 years and over
Males 57.4% Never married30.9% Now married0.9% Separated3.3% Widowed7.5% DivorcedFemales 60.4% Never married17.8% Now married0.0% Separated8.0% Widowed13.8% DivorcedWomen who gave birth in the past 12 months Now married:
74.7% (70)Unmarried:
25.3% (24)
Women who did not give birth in the past 12 months Now married:
15.3% (285)Unmarried:
84.7% (1,580)
Marital status - American Indian / Alaska Native population 15 years and over
Males 26.7% Never married73.3% Now married0.0% Separated0.0% Widowed0.0% DivorcedFemales 23.9% Never married32.6% Now married43.5% Separated0.0% Widowed0.0% DivorcedWomen who did not give birth in the past 12 months Now married:
57.7% (24)Unmarried:
42.3% (17)
Marital status - Asian population 15 years and over
Males 23.4% Never married64.8% Now married0.0% Separated0.0% Widowed11.8% DivorcedFemales 48.2% Never married44.0% Now married1.3% Separated0.0% Widowed6.6% DivorcedWomen who gave birth in the past 12 months Now married:
100.0% (20)Unmarried:
0.0% (0)
Women who did not give birth in the past 12 months Now married:
42.1% (164)Unmarried:
57.9% (225)
Marital status - Other race population 15 years and over
Males 50.1% Never married31.5% Now married3.4% Separated1.3% Widowed13.8% DivorcedFemales 36.4% Never married34.7% Now married6.5% Separated1.3% Widowed21.1% DivorcedWomen who gave birth in the past 12 months Now married:
79.7% (85)Unmarried:
20.3% (22)
Women who did not give birth in the past 12 months Now married:
35.1% (432)Unmarried:
64.9% (797)
Marital status - Two or more races population 15 years and over
Males 40.9% Never married53.2% Now married0.0% Separated0.0% Widowed5.9% DivorcedFemales 29.4% Never married45.1% Now married3.5% Separated1.2% Widowed20.8% DivorcedWomen who gave birth in the past 12 months Now married:
100.0% (8)Unmarried:
0.0% (0)
Women who did not give birth in the past 12 months Now married:
37.8% (588)Unmarried:
62.2% (969)
Marital status - White alone, not Hispanic / Latino population 15 years and over
Males 32.0% Never married51.6% Now married1.1% Separated4.2% Widowed11.1% DivorcedFemales 25.8% Never married42.7% Now married3.1% Separated11.9% Widowed16.5% DivorcedWomen who gave birth in the past 12 months Now married:
100.0% (235)Unmarried:
0.0% (0)
Women who did not give birth in the past 12 months Now married:
39.8% (1,598)Unmarried:
60.2% (2,414)
Marital status - Hispanic or Latino population 15 years and over
Males 46.3% Never married46.6% Now married1.2% Separated0.0% Widowed6.0% DivorcedFemales 43.3% Never married37.8% Now married5.8% Separated1.1% Widowed12.0% DivorcedWomen who gave birth in the past 12 months Now married:
73.6% (180)Unmarried:
26.4% (65)
Women who did not give birth in the past 12 months Now married:
33.6% (1,461)Unmarried:
66.4% (2,891)
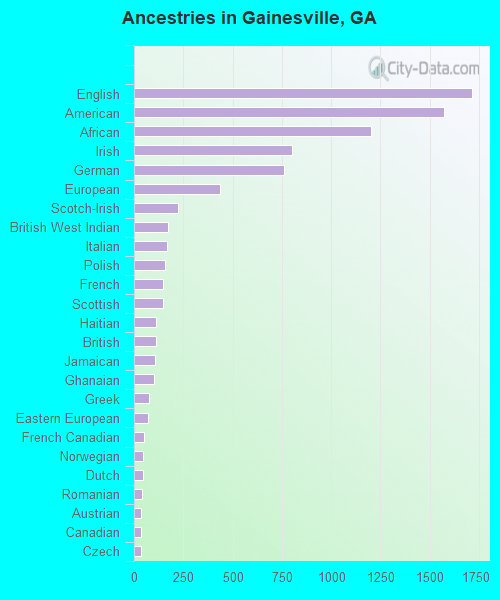
Ancestries in Gainesville
1,715 6.9% English1,570 6.3% American1,204 4.8% African802 3.2% Irish762 3.1% German434 1.7% European221 0.9% Scotch-Irish171 0.7% British West Indian167 0.7% Italian158 0.6% Polish147 0.6% French147 0.6% Scottish114 0.5% Haitian113 0.5% British109 0.4% Jamaican103 0.4% Ghanaian77 0.3% Greek69 0.3% Eastern European50 0.2% French Canadian46 0.2% Norwegian45 0.2% Dutch43 0.2% Romanian38 0.2% Austrian34 0.1% Canadian34 0.1% Czech34 0.1% Northern European33 0.1% Welsh27 0.1% Nigerian23 0.09% Hungarian18 0.07% Portuguese16 0.06% Lebanese16 0.06% Turkish13 0.05% Swedish9 0.04% Ukrainian6 0.02% Russian
Geographical mobility in Gainesville Same house 1 year ago 18,342 80.7% White (Caucasian)4,174 62.1% Black or African American115 84.7% American Indian / Alaska Native1,385 82.1% Asian18 100.0% Native Hawaiian / Pacific Islander6,331 90.4% Other race5,664 79.7% Two or more races13,614 76.8% White alone, not Hispanic / Latino14,195 87.8% Hispanic or LatinoMoved within same county 1,121 4.9% White / Caucasian966 14.4% Black or African American4 2.8% American Indian / Alaska Native32 1.9% Asian272 3.9% Other race617 8.7% Two or more races1,072 6.0% White alone, not Hispanic / Latino466 2.9% Hispanic or LatinoMoved within same state 2,910 12.8% White / Caucasian1,626 24.2% Black or African American20 14.6% American Indian / Alaska Native57 3.3% Asian396 5.7% Other race146 2.0% Two or more races2,709 15.3% White alone, not Hispanic / Latino842 5.2% Hispanic or LatinoMoved from different state 447 2.0% White / Caucasian411 6.1% Black or African American50 3.0% Asian38 0.5% Two or more races468 2.6% White alone, not Hispanic / Latino184 1.1% Hispanic or LatinoMoved from abroad 59 0.3% White56 0.8% Black or African American155 9.2% Asian266 3.7% Two or more races38 0.2% White alone, not Hispanic / Latino171 1.1% Hispanic or Latino
Children Nativity (place of birth) in Gainesville
Children under 6 years - Living with two parents Both parents native 906 100.0% NativeBoth parents foreign-born 505 92.8% Native39 7.2% Foreign-bornOne native, one foreign-born parent 222 100.0% NativeChildren under 6 years - Living with one parent Native parent 497 99.0% Native5 1.0% Foreign-bornForeign-born parent 1,177 99.2% Native10 0.8% Foreign-bornChildren 6 to 17 years - Living with two parents Both parents native 1,856 96.8% Native61 3.2% Foreign-bornBoth parents foreign-born 1,090 89.9% Native122 10.1% Foreign-bornOne native, one foreign-born parent 268 100.0% NativeChildren 6 to 17 years - Living with one parent Native parent 1,337 100.0% NativeForeign-born parent 2,485 53.6% Native2,153 46.4% Foreign-born
Grandparents responsible for own grandchildren in Gainesville
Grandparents (30 to 59 years) White / Caucasian 92 33.6% Responsible for grandchildren183 66.4% Not responsible for grandchildrenBlack or African American 43 100.0% Not responsible for grandchildrenAsian 61 81.4% Responsible for grandchildren14 18.6% Not responsible for grandchildrenOther race 31 100.0% Not responsible for grandchildrenTwo or more races 489 100.0% Not responsible for grandchildrenWhite alone, not Hispanic / Latino 12 100.0% Not responsible for grandchildrenHispanic or Latino 66 10.3% Responsible for grandchildren576 89.7% Not responsible for grandchildrenGrandparents (60 years and over) White / Caucasian 50 37.2% Responsible for grandchildren84 62.8% Not responsible for grandchildrenBlack or African American 59 41.1% Responsible for grandchildren85 58.9% Not responsible for grandchildrenAsian 62 100.0% Not responsible for grandchildrenTwo or more races 52 100.0% Not responsible for grandchildrenWhite alone, not Hispanic / Latino 50 36.6% Responsible for grandchildren86 63.4% Not responsible for grandchildrenHispanic or Latino 47 100.0% Not responsible for grandchildren