Races in Gainesville, Virginia (VA) Detailed Stats
Data:
Races - White alone (%)
Races - White alone (% change since 2000)
Races - Black alone (%)
Races - Black alone (% change since 2000)
Races - American Indian alone (%)
Races - American Indian alone (% change since 2000)
Races - Asian alone (%)
Races - Asian alone (% change since 2000)
Races - Hispanic (%)
Races - Hispanic (% change since 2000)
Races - Native Hawaiian and Other Pacific Islander alone (%)
Races - Native Hawaiian and Other Pacific Islander alone (% change since 2000)
Races - Two or more races(%)
Races - Two or more races(% change since 2000)
Races - Other race alone (%)
Races - Other race alone (% change since 2000)
Racial diversity
Place of birth - Born in state of residence (%)
Place of birth - Born in state of residence (%) - White
Place of birth - Born in state of residence (%) - Black or African American
Place of birth - Born in state of residence (%) - Asian
Place of birth - Born in state of residence (%) - Hispanic or Latino
Place of birth - Born in state of residence (%) - American Indian and Alaska Native
Place of birth - Born in state of residence (%) - Multirace
Place of birth - Born in state of residence (%) - Other Race
Place of birth - Born in other state (%)
Place of birth - Born in other state (%) - White
Place of birth - Born in other state (%) - Black or African American
Place of birth - Born in other state (%) - Asian
Place of birth - Born in other state (%) - Hispanic or Latino
Place of birth - Born in other state (%) - American Indian and Alaska Native
Place of birth - Born in other state (%) - Multirace
Place of birth - Born in other state (%) - Other Race
Place of birth - Native, outside of US (%)
Place of birth - Native, outside of US (%) - White
Place of birth - Native, outside of US (%) - Black or African American
Place of birth - Native, outside of US (%) - Asian
Place of birth - Native, outside of US (%) - Hispanic or Latino
Place of birth - Native, outside of US (%) - American Indian and Alaska Native
Place of birth - Native, outside of US (%) - Multirace
Place of birth - Native, outside of US (%) - Other Race
Place of birth - Foreign born (%)
Place of birth - Foreign born (%) - White
Place of birth - Foreign born (%) - Black or African American
Place of birth - Foreign born (%) - Asian
Place of birth - Foreign born (%) - Hispanic or Latino
Place of birth - Foreign born (%) - American Indian and Alaska Native
Place of birth - Foreign born (%) - Multirace
Place of birth - Foreign born (%) - Other Race
Residents speaking English at home (%)
Residents speaking English at home - Born in the United States (%)
Residents speaking English at home - Native, born elsewhere (%)
Residents speaking English at home - Foreign born (%)
Residents speaking Spanish at home (%)
Residents speaking Spanish at home - Born in the United States (%)
Residents speaking Spanish at home - Native, born elsewhere (%)
Residents speaking Spanish at home - Foreign born (%)
Residents speaking other language at home (%)
Residents speaking other language at home - Born in the United States (%)
Residents speaking other language at home - Native, born elsewhere (%)
Residents speaking other language at home - Foreign born (%)
Marital status - Never married (%)
Marital status - Now married (%)
Marital status - Separated (%)
Marital status - Widowed (%)
Marital status - Divorced (%)
Ancestries Reported - Arab (%)
Ancestries Reported - Czech (%)
Ancestries Reported - Danish (%)
Ancestries Reported - Dutch (%)
Ancestries Reported - English (%)
Ancestries Reported - French (%)
Ancestries Reported - French Canadian (%)
Ancestries Reported - German (%)
Ancestries Reported - Greek (%)
Ancestries Reported - Hungarian (%)
Ancestries Reported - Irish (%)
Ancestries Reported - Italian (%)
Ancestries Reported - Lithuanian (%)
Ancestries Reported - Norwegian (%)
Ancestries Reported - Polish (%)
Ancestries Reported - Portuguese (%)
Ancestries Reported - Russian (%)
Ancestries Reported - Scotch-Irish (%)
Ancestries Reported - Scottish (%)
Ancestries Reported - Slovak (%)
Ancestries Reported - Subsaharan African (%)
Ancestries Reported - Swedish (%)
Ancestries Reported - Swiss (%)
Ancestries Reported - Ukrainian (%)
Ancestries Reported - United States (%)
Ancestries Reported - Welsh (%)
Ancestries Reported - West Indian (%)
Ancestries Reported - Other (%)
Geographical mobility - Same house 1 year ago (%)
Geographical mobility - Same house 1 year ago (%) - White
Geographical mobility - Same house 1 year ago (%) - Black or African American
Geographical mobility - Same house 1 year ago (%) - Asian
Geographical mobility - Same house 1 year ago (%) - Hispanic or Latino
Geographical mobility - Same house 1 year ago (%) - American Indian and Alaska Native
Geographical mobility - Same house 1 year ago (%) - Multirace
Geographical mobility - Same house 1 year ago (%) - Other Race
Geographical mobility - Moved within same county (%)
Geographical mobility - Moved within same county (%) - White
Geographical mobility - Moved within same county (%) - Black or African American
Geographical mobility - Moved within same county (%) - Asian
Geographical mobility - Moved within same county (%) - Hispanic or Latino
Geographical mobility - Moved within same county (%) - American Indian and Alaska Native
Geographical mobility - Moved within same county (%) - Multirace
Geographical mobility - Moved within same county (%) - Other Race
Geographical mobility - Moved from different county within same state (%)
Geographical mobility - Moved from different county within same state (%) - White
Geographical mobility - Moved from different county within same state (%) - Black or African American
Geographical mobility - Moved from different county within same state (%) - Asian
Geographical mobility - Moved from different county within same state (%) - Hispanic or Latino
Geographical mobility - Moved from different county within same state (%) - American Indian and Alaska Native
Geographical mobility - Moved from different county within same state (%) - Multirace
Geographical mobility - Moved from different county within same state (%) - Other Race
Geographical mobility - Moved from different state (%)
Geographical mobility - Moved from different state (%) - White
Geographical mobility - Moved from different state (%) - Black or African American
Geographical mobility - Moved from different state (%) - Asian
Geographical mobility - Moved from different state (%) - Hispanic or Latino
Geographical mobility - Moved from different state (%) - American Indian and Alaska Native
Geographical mobility - Moved from different state (%) - Multirace
Geographical mobility - Moved from different state (%) - Other Race
Geographical mobility - Moved from abroad (%)
Geographical mobility - Moved from abroad (%) - White
Geographical mobility - Moved from abroad (%) - Black or African American
Geographical mobility - Moved from abroad (%) - Asian
Geographical mobility - Moved from abroad (%) - Hispanic or Latino
Geographical mobility - Moved from abroad (%) - American Indian and Alaska Native
Geographical mobility - Moved from abroad (%) - Multirace
Geographical mobility - Moved from abroad (%) - Other Race
Place of birth for the foreign-born population - Ireland (%)
Place of birth for the foreign-born population - Denmark (%)
Place of birth for the foreign-born population - Norway (%)
Place of birth for the foreign-born population - Sweden (%)
Place of birth for the foreign-born population - United Kingdom (%)
Place of birth for the foreign-born population - England (%)
Place of birth for the foreign-born population - Scotland (%)
Place of birth for the foreign-born population - Other Northern Europe (%)
Place of birth for the foreign-born population - Austria (%)
Place of birth for the foreign-born population - Belgium (%)
Place of birth for the foreign-born population - France (%)
Place of birth for the foreign-born population - Germany (%)
Place of birth for the foreign-born population - Netherlands (%)
Place of birth for the foreign-born population - Switzerland (%)
Place of birth for the foreign-born population - Other Western Europe (%)
Place of birth for the foreign-born population - Greece (%)
Place of birth for the foreign-born population - Italy (%)
Place of birth for the foreign-born population - Portugal (%)
Place of birth for the foreign-born population - Spain (%)
Place of birth for the foreign-born population - Other Southern Europe (%)
Place of birth for the foreign-born population - Albania (%)
Place of birth for the foreign-born population - Belarus (%)
Place of birth for the foreign-born population - Bosnia and Herzegovina (%)
Place of birth for the foreign-born population - Bulgaria (%)
Place of birth for the foreign-born population - Croatia (%)
Place of birth for the foreign-born population - Czechoslovakia (%)
Place of birth for the foreign-born population - Hungary (%)
Place of birth for the foreign-born population - Latvia (%)
Place of birth for the foreign-born population - Lithuania (%)
Place of birth for the foreign-born population - North Macedonia (Macedonia) (%)
Place of birth for the foreign-born population - Moldova (%)
Place of birth for the foreign-born population - Poland (%)
Place of birth for the foreign-born population - Romania (%)
Place of birth for the foreign-born population - Russia (%)
Place of birth for the foreign-born population - Serbia (%)
Place of birth for the foreign-born population - Ukraine (%)
Place of birth for the foreign-born population - Other Eastern Europe (%)
Place of birth for the foreign-born population - China (%)
Place of birth for the foreign-born population - Hong Kong (%)
Place of birth for the foreign-born population - Taiwan (%)
Place of birth for the foreign-born population - Japan (%)
Place of birth for the foreign-born population - Korea (%)
Place of birth for the foreign-born population - Other Eastern Asia (%)
Place of birth for the foreign-born population - Afghanistan (%)
Place of birth for the foreign-born population - Bangladesh (%)
Place of birth for the foreign-born population - India (%)
Place of birth for the foreign-born population - Iran (%)
Place of birth for the foreign-born population - Kazakhstan (%)
Place of birth for the foreign-born population - Nepal (%)
Place of birth for the foreign-born population - Pakistan (%)
Place of birth for the foreign-born population - Sri Lanka (%)
Place of birth for the foreign-born population - Uzbekistan (%)
Place of birth for the foreign-born population - Other South Central Asia (%)
Place of birth for the foreign-born population - Burma (%)
Place of birth for the foreign-born population - Cambodia (%)
Place of birth for the foreign-born population - Indonesia (%)
Place of birth for the foreign-born population - Laos (%)
Place of birth for the foreign-born population - Malaysia (%)
Place of birth for the foreign-born population - Philippines (%)
Place of birth for the foreign-born population - Singapore (%)
Place of birth for the foreign-born population - Thailand (%)
Place of birth for the foreign-born population - Vietnam (%)
Place of birth for the foreign-born population - Other South Eastern Asia (%)
Place of birth for the foreign-born population - Armenia (%)
Place of birth for the foreign-born population - Iraq (%)
Place of birth for the foreign-born population - Israel (%)
Place of birth for the foreign-born population - Jordan (%)
Place of birth for the foreign-born population - Kuwait (%)
Place of birth for the foreign-born population - Lebanon (%)
Place of birth for the foreign-born population - Saudi Arabia (%)
Place of birth for the foreign-born population - Syria (%)
Place of birth for the foreign-born population - Turkey (%)
Place of birth for the foreign-born population - Yemen (%)
Place of birth for the foreign-born population - Other Western Asia (%)
Place of birth for the foreign-born population - Eritrea (%)
Place of birth for the foreign-born population - Ethiopia (%)
Place of birth for the foreign-born population - Kenya (%)
Place of birth for the foreign-born population - Somalia (%)
Place of birth for the foreign-born population - Uganda (%)
Place of birth for the foreign-born population - Zimbabwe (%)
Place of birth for the foreign-born population - Other Eastern Africa (%)
Place of birth for the foreign-born population - Cameroon (%)
Place of birth for the foreign-born population - Congo (%)
Place of birth for the foreign-born population - Democratic Republic of Congo (Zaire) (%)
Place of birth for the foreign-born population - Other Middle Africa (%)
Place of birth for the foreign-born population - Egypt (%)
Place of birth for the foreign-born population - Morocco (%)
Place of birth for the foreign-born population - Sudan (%)
Place of birth for the foreign-born population - Other Northern Africa (%)
Place of birth for the foreign-born population - South Africa (%)
Place of birth for the foreign-born population - Other Southern Africa (%)
Place of birth for the foreign-born population - Cabo Verde (%)
Place of birth for the foreign-born population - Ghana (%)
Place of birth for the foreign-born population - Liberia (%)
Place of birth for the foreign-born population - Nigeria (%)
Place of birth for the foreign-born population - Senegal (%)
Place of birth for the foreign-born population - Sierra Leone (%)
Place of birth for the foreign-born population - Other Western Africa (%)
Place of birth for the foreign-born population - Australia (%)
Place of birth for the foreign-born population - New Zealand (%)
Place of birth for the foreign-born population - Fiji (%)
Place of birth for the foreign-born population - Micronesia (%)
Place of birth for the foreign-born population - Bahamas (%)
Place of birth for the foreign-born population - Barbados (%)
Place of birth for the foreign-born population - Cuba (%)
Place of birth for the foreign-born population - Dominica (%)
Place of birth for the foreign-born population - Dominican Republic (%)
Place of birth for the foreign-born population - Grenada (%)
Place of birth for the foreign-born population - Haiti (%)
Place of birth for the foreign-born population - Jamaica (%)
Place of birth for the foreign-born population - St. Vincent and the Grenadines (%)
Place of birth for the foreign-born population - Trinidad and Tobago (%)
Place of birth for the foreign-born population - West Indies (%)
Place of birth for the foreign-born population - Other Caribbean (%)
Place of birth for the foreign-born population - Belize (%)
Place of birth for the foreign-born population - Costa Rica (%)
Place of birth for the foreign-born population - El Salvador (%)
Place of birth for the foreign-born population - Guatemala (%)
Place of birth for the foreign-born population - Honduras (%)
Place of birth for the foreign-born population - Mexico (%)
Place of birth for the foreign-born population - Nicaragua (%)
Place of birth for the foreign-born population - Panama (%)
Place of birth for the foreign-born population - Other Central America (%)
Place of birth for the foreign-born population - Argentina (%)
Place of birth for the foreign-born population - Bolivia (%)
Place of birth for the foreign-born population - Brazil (%)
Place of birth for the foreign-born population - Chile (%)
Place of birth for the foreign-born population - Colombia (%)
Place of birth for the foreign-born population - Ecuador (%)
Place of birth for the foreign-born population - Guyana (%)
Place of birth for the foreign-born population - Peru (%)
Place of birth for the foreign-born population - Uruguay (%)
Place of birth for the foreign-born population - Venezuela (%)
Place of birth for the foreign-born population - Other South America (%)
Place of birth for the foreign-born population - Canada (%)
Place of birth for the foreign-born population - Other Northern America (%)
Place of birth for the foreign-born population - Other (%)
Latest news about races in Gainesville, VA collected exclusively by city-data.com from local newspapers, TV, and radio stations
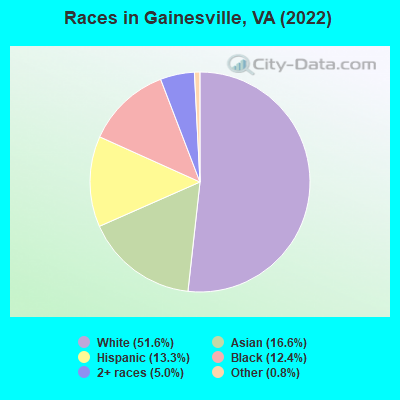
According to 2022 data, the most numerous races in Gainesville, VA are White alone (8,866 residents), Black alone (2,122 residents), and Hispanic (2,289 residents). 75.9% of Gainesville residents speak English at home. 18.1% of Gainesville, VA residents are foreign-born (10.9% born in Asia, 4.1% born in Latin America), which is 33.6% greater than the foreign-born rate of 12.0% across the entire state of Virginia.
Race distribution in Gainesville
2000 2022
4,965,637 70.2% White alone 1,376,378 19.4% Black alone 329,540 4.7% Hispanic 259,277 3.7% Asian alone 114,022 1.6% Two or more races 18,596 0.3% American Indian alone 11,685 0.2% Other race alone 3,380 0.05% Native Hawaiian and Other
5,095,130 58.7% White alone 1,594,785 18.4% Black alone 905,750 10.4% Hispanic 602,881 6.9% Asian alone 406,047 4.7% Two or more races 60,419 0.7% Other race alone 11,738 0.1% American Indian alone 6,869 0.08% Native Hawaiian and Other
Income and house value in Gainesville Median household income in 2022 $167,079 White non-Hispanic householders$142,543 Black householdersover $200,000 Asian householders$163,806 Some other race householdersover $200,000 Two or more races householders$110,888 Hispanic or Latino race householdersMedian 2022 house value $798,959 White Non-Hispanic householders$535,578 Black or African American householders $486,355 Asian householders$675,534 Some other race householders$994,751 Two or more races householders$701,982 Hispanic or Latino householders
Median age by race in Gainesville
39.9 Median age for White residents38.1 41.3 38.2 Median age for Black or African American residents33.7 38.7 44.2 Median age for American Indian / Alaska Native residents7.0 47.1 37.4 Median age for Asian residents36.2 38.5 -611,955,419.9 Median age for Native Hawaiian / Pacific Islander residents-541,531,822.5 -714,150,046.8 21.3 Median age for Other race residents16.7 24.9 20.1 Median age for Two or more races residents19.6 22.7 39.6 Median age for White alone residents38.3 40.2 26.5 Median age for Hispanic or Latino residents21.8 30.1
Owner/renter occupied households by race in Gainesville
House owners and renters - White residents 2,788 86.0% Owner occupied454 14.0% Renter occupiedHouse owners and renters - Black or African American residents 621 84.5% Owner occupied114 15.5% Renter occupiedHouse owners and renters - American Indian / Alaska Native residents 3 100.0% Owner occupiedHouse owners and renters - Asian residents 712 85.3% Owner occupied123 14.7% Renter occupiedHouse owners and renters - Other race residents 83 68.4% Owner occupied38 31.6% Renter occupiedHouse owners and renters - Two or more races residents 271 83.0% Owner occupied55 17.0% Renter occupiedHouse owners and renters - White alone residents 2,878 87.3% Owner occupied420 12.7% Renter occupiedHouse owners and renters - Hispanic or Latino residents 276 61.5% Owner occupied173 38.5% Renter occupied
Language usage in Gainesville
English speakers - Total 75.9% of residents of Gainesville speak English at home.
7.0% of residents speak Spanish at home 695 63.2% Speak English very well404 36.8% Speak English less than very well17.2% of residents speak other language at home 1,791 66.3% Speak English very well912 33.7% Speak English less than very well
English speakers - Born in the United States 95.5% of residents of Gainesville speak English at home.
2.3% of residents speak Spanish at home 102 69.4% Speak English very well45 30.6% Speak English less than very well2.1% of residents speak other language at home 120 88.9% Speak English very well15 11.1% Speak English less than very well
English speakers - Native, born elsewhere 59.4% of residents of Gainesville speak English at home.
30.4% of residents speak Spanish at home 144 96.0% Speak English very well6 4.0% Speak English less than very well8.3% of residents speak other language at home 23 56.1% Speak English very well18 43.9% Speak English less than very well
English speakers - Foreign-born 14.0% of residents of Gainesville speak English at home.
20.6% of residents speak Spanish at home 285 46.0% Speak English very well334 54.0% Speak English less than very well65.4% of residents speak other language at home 1,193 60.7% Speak English very well771 39.3% Speak English less than very well
White (Caucasian) - Speak only English Native:
100.0% (7,692)Foreign-born:
16.4% (74)
White (Caucasian) - Speak another language Native:
2.3% (176)Foreign-born:
84.0% (377)
Black or African American - Speak only English Native:
96.5% (1,784)Foreign-born:
26.1% (61)
Black or African American - Speak another language Native:
3.3% (61)Foreign-born:
64.6% (150)
American Indian / Alaska Native - Speak only English Native:
100.0% (11)Foreign-born:
2.4% (1)
Asian - Speak only English Native:
43.8% (412)Foreign-born:
12.9% (200)
Asian - Speak another language Native:
53.8% (507)Foreign-born:
87.1% (1,349)
Other race - Speak only English Native:
53.2% (149)Foreign-born:
23.1% (30)
Other race - Speak another language Native:
46.4% (130)Foreign-born:
81.8% (106)
Two or more races - Speak only English Native:
75.7% (1,353)Foreign-born:
6.7% (28)
Two or more races - Speak another language Native:
21.9% (391)Foreign-born:
92.7% (381)
White alone - Speak only English Native:
98.0% (7,606)Foreign-born:
16.0% (84)
White alone - Speak another language Native:
2.2% (168)Foreign-born:
85.8% (449)
Hispanic or Latino - Speak only English Native:
73.2% (1,124)Foreign-born:
7.4% (50)
Hispanic or Latino - Speak another language Native:
28.7% (441)Foreign-born:
92.2% (625)
Foreign-born residents in Gainesville 3,104 residents are foreign born (10.9% Asia , 4.1% Latin America ).
This city:
18.1%Virginia:
12.6%
Marital status for residents in Gainesville Marital status - White (Caucasian) population 15 years and over
Males 28.0% Never married64.2% Now married0.8% Separated2.1% Widowed4.9% DivorcedFemales 19.5% Never married64.7% Now married1.0% Separated6.3% Widowed8.5% DivorcedWomen who gave birth in the past 12 months Now married:
74.5% (91)Unmarried:
25.5% (31)
Women who did not give birth in the past 12 months Now married:
63.4% (1,078)Unmarried:
36.6% (623)
Marital status - Black or African American population 15 years and over
Males 32.0% Never married68.0% Now married0.0% Separated0.0% Widowed0.0% DivorcedFemales 32.7% Never married47.4% Now married3.6% Separated1.7% Widowed14.6% DivorcedWomen who gave birth in the past 12 months Now married:
26.0% (13)Unmarried:
74.0% (36)
Women who did not give birth in the past 12 months Now married:
47.6% (283)Unmarried:
52.4% (311)
Marital status - American Indian / Alaska Native population 15 years and over
Males 0.0% Never married100.0% Now married0.0% Separated0.0% Widowed0.0% DivorcedFemales 42.3% Never married57.7% Now married0.0% Separated0.0% Widowed0.0% DivorcedWomen who did not give birth in the past 12 months Now married:
100.0% (16)Unmarried:
0.0% (0)
Marital status - Asian population 15 years and over
Males 16.8% Never married78.3% Now married0.0% Separated1.8% Widowed3.2% DivorcedFemales 9.7% Never married78.2% Now married1.1% Separated5.0% Widowed5.9% DivorcedWomen who gave birth in the past 12 months Now married:
100.0% (82)Unmarried:
0.0% (0)
Women who did not give birth in the past 12 months Now married:
85.2% (589)Unmarried:
14.8% (102)
Marital status - Other race population 15 years and over
Males 61.5% Never married38.5% Now married0.0% Separated0.0% Widowed0.0% DivorcedFemales 46.3% Never married27.4% Now married11.4% Separated0.0% Widowed14.9% DivorcedWomen who gave birth in the past 12 months Now married:
0.0% (0)Unmarried:
100.0% (33)
Women who did not give birth in the past 12 months Now married:
26.1% (39)Unmarried:
73.9% (109)
Marital status - Two or more races population 15 years and over
Males 64.5% Never married30.3% Now married3.9% Separated0.0% Widowed1.3% DivorcedFemales 29.6% Never married57.4% Now married0.0% Separated2.3% Widowed10.7% DivorcedWomen who did not give birth in the past 12 months Now married:
56.9% (323)Unmarried:
43.1% (245)
Marital status - White alone, not Hispanic / Latino population 15 years and over
Males 25.1% Never married66.6% Now married0.8% Separated2.2% Widowed5.3% DivorcedFemales 18.2% Never married66.5% Now married1.1% Separated5.4% Widowed8.8% DivorcedWomen who gave birth in the past 12 months Now married:
85.5% (95)Unmarried:
14.5% (16)
Women who did not give birth in the past 12 months Now married:
64.5% (1,166)Unmarried:
35.5% (641)
Marital status - Hispanic or Latino population 15 years and over
Males 66.2% Never married32.8% Now married0.0% Separated0.0% Widowed1.0% DivorcedFemales 35.7% Never married47.7% Now married2.4% Separated6.0% Widowed8.2% DivorcedWomen who gave birth in the past 12 months Now married:
19.3% (11)Unmarried:
80.7% (48)
Women who did not give birth in the past 12 months Now married:
49.7% (300)Unmarried:
50.3% (304)
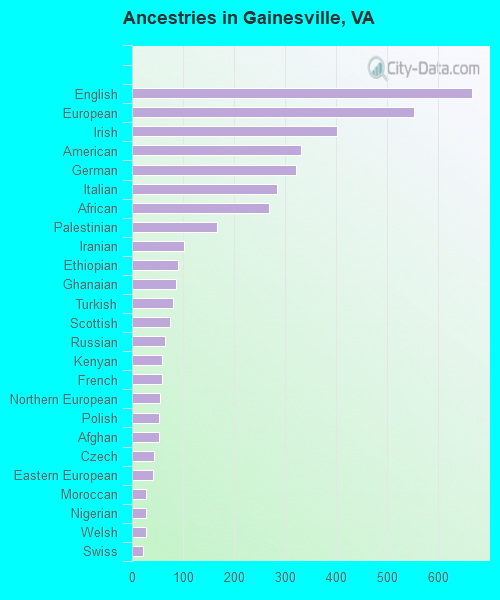
Ancestries in Gainesville
666 7.5% English552 6.2% European401 4.5% Irish331 3.7% American321 3.6% German285 3.2% Italian268 3.0% African166 1.9% Palestinian101 1.1% Iranian90 1.0% Ethiopian87 1.0% Ghanaian80 0.9% Turkish75 0.8% Scottish65 0.7% Russian58 0.6% Kenyan58 0.6% French55 0.6% Northern European53 0.6% Polish52 0.6% Afghan43 0.5% Czech42 0.5% Eastern European28 0.3% Moroccan28 0.3% Nigerian28 0.3% Welsh21 0.2% Swiss20 0.2% Norwegian17 0.2% Yugoslavian14 0.2% Slovene14 0.2% Czechoslovakian14 0.2% Armenian11 0.1% Romanian8 0.09% Portuguese8 0.09% Syrian7 0.08% Lebanese7 0.08% U.S. Virgin Islander6 0.07% Cajun6 0.07% Jamaican5 0.06% Scotch-Irish5 0.06% Dutch4 0.04% Hungarian
Geographical mobility in Gainesville Same house 1 year ago 7,322 88.0% White (Caucasian)1,644 76.4% Black or African American42 96.1% American Indian / Alaska Native2,547 90.5% Asian591 99.3% Other race2,280 94.1% Two or more races7,761 88.9% White alone, not Hispanic / Latino2,170 95.3% Hispanic or LatinoMoved within same county 213 2.6% White / Caucasian119 5.5% Black or African American17 0.6% Asian45 1.9% Two or more races225 2.6% White alone, not Hispanic / LatinoMoved within same state 525 6.3% White / Caucasian159 7.4% Black or African American144 5.1% Asian499 5.7% White alone, not Hispanic / Latino38 1.7% Hispanic or LatinoMoved from different state 246 2.9% White / Caucasian182 8.5% Black or African American7 0.2% Asian30 1.2% Two or more races217 2.5% White alone, not Hispanic / Latino26 1.2% Hispanic or LatinoMoved from abroad 20 0.2% White194 6.9% Asian33 1.3% Two or more races32 0.4% White alone, not Hispanic / Latino
Children Nativity (place of birth) in Gainesville
Children under 6 years - Living with two parents Both parents native 899 100.0% NativeBoth parents foreign-born 368 100.0% NativeOne native, one foreign-born parent 197 100.0% NativeChildren under 6 years - Living with one parent Native parent 168 100.0% NativeForeign-born parent 18 100.0% NativeChildren 6 to 17 years - Living with two parents Both parents native 1,921 100.0% NativeBoth parents foreign-born 471 84.8% Native84 15.2% Foreign-bornOne native, one foreign-born parent 196 100.0% NativeChildren 6 to 17 years - Living with one parent Native parent 482 100.0% NativeForeign-born parent 80 51.4% Native76 48.6% Foreign-born
Grandparents responsible for own grandchildren in Gainesville
Grandparents (30 to 59 years) White / Caucasian 22 68.3% Responsible for grandchildren10 31.7% Not responsible for grandchildrenAsian 15 100.0% Not responsible for grandchildrenOther race 33 100.0% Not responsible for grandchildrenTwo or more races 9 100.0% Responsible for grandchildrenWhite alone, not Hispanic / Latino 22 61.4% Responsible for grandchildren14 38.6% Not responsible for grandchildrenHispanic or Latino 22 58.7% Responsible for grandchildren16 41.3% Not responsible for grandchildren
Grandparents (60 years and over) White / Caucasian 43 100.0% Not responsible for grandchildrenAsian 5 3.4% Responsible for grandchildren155 96.6% Not responsible for grandchildrenTwo or more races 18 100.0% Not responsible for grandchildrenWhite alone, not Hispanic / Latino 56 100.0% Not responsible for grandchildrenHispanic or Latino 21 100.0% Not responsible for grandchildren