Races in Gallatin Gateway, Montana (MT) Detailed Stats
Ancestries, Foreign-born residents, place of birth
Data:
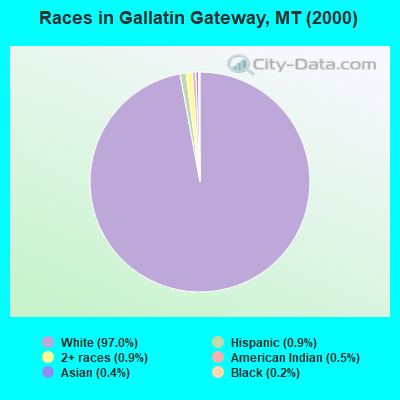
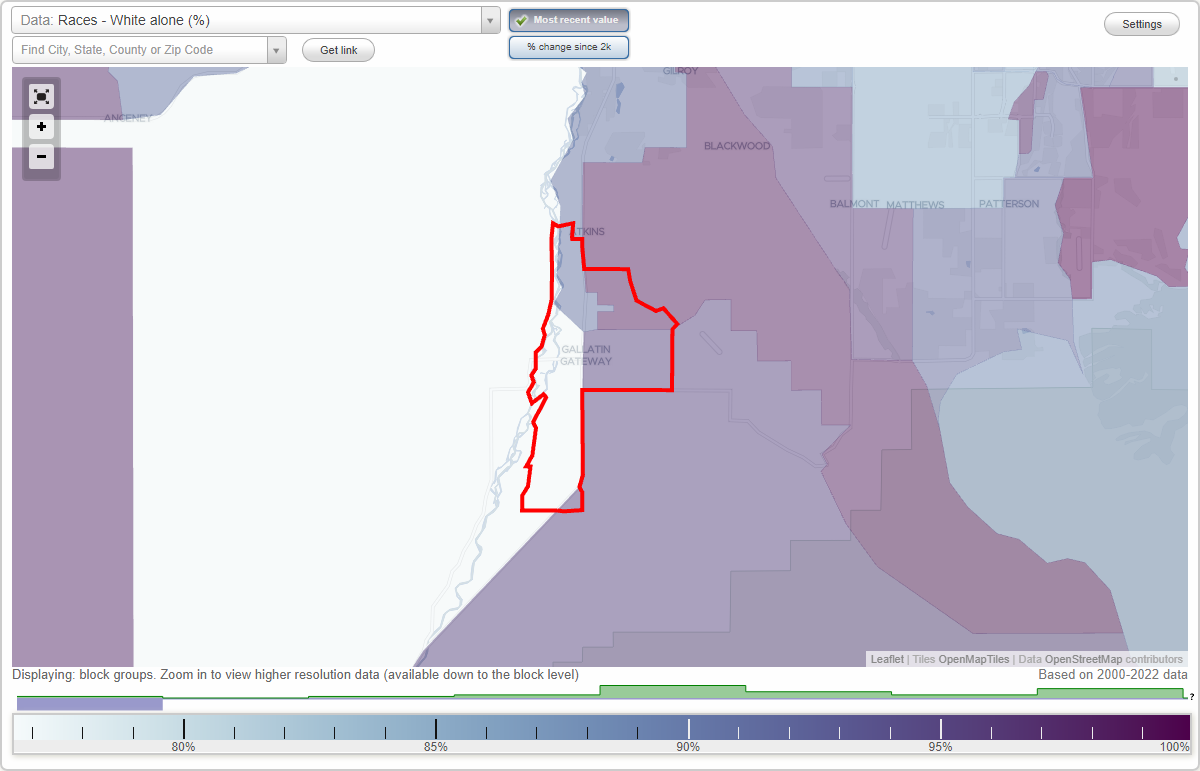
Race distribution in Gallatin Gateway

- 3,61397.0%White alone
- 320.9%Two or more races
- 350.9%Hispanic
- 190.5%American Indian alone
- 150.4%Asian alone
- 60.2%Black alone
- 20.05%Native Hawaiian and Other
Pacific Islander alone
- 10.03%Other race alone
2000
2022
-
- 807,82389.5%White alone
- 54,4266.0%American Indian alone
- 18,0812.0%Hispanic
- 13,7681.5%Two or more races
- 4,5690.5%Asian alone
- 2,5340.3%Black alone
- 5690.06%Other race alone
- 4250.05%Native Hawaiian and Other
Pacific Islander alone
-
- 937,36583.5%White alone
- 58,7485.2%American Indian alone
- 55,1724.9%Two or more races
- 49,8304.4%Hispanic
- 9,0120.8%Other race alone
- 7,7000.7%Asian alone
- 3,4280.3%Black alone
- 1,6120.1%Native Hawaiian and Other
Pacific Islander alone
Income and house value in Gallatin Gateway
- Median household income in 2022
- $92,576White non-Hispanic householders
- $96,510American Indian and Alaska Native householders
- $85,992Asian householders
- $59,747Two or more races householders
- $57,452Hispanic or Latino race householders
- Median 2022 house value
- $743,968White Non-Hispanic householders
- over $1,000,000Asian householders
- $426,278Two or more races householders
- $841,339Hispanic or Latino householders