Races in Garrison, Maryland (MD) Detailed Stats
Data:
Races - White alone (%)
Races - White alone (% change since 2000)
Races - Black alone (%)
Races - Black alone (% change since 2000)
Races - American Indian alone (%)
Races - American Indian alone (% change since 2000)
Races - Asian alone (%)
Races - Asian alone (% change since 2000)
Races - Hispanic (%)
Races - Hispanic (% change since 2000)
Races - Native Hawaiian and Other Pacific Islander alone (%)
Races - Native Hawaiian and Other Pacific Islander alone (% change since 2000)
Races - Two or more races(%)
Races - Two or more races(% change since 2000)
Races - Other race alone (%)
Races - Other race alone (% change since 2000)
Racial diversity
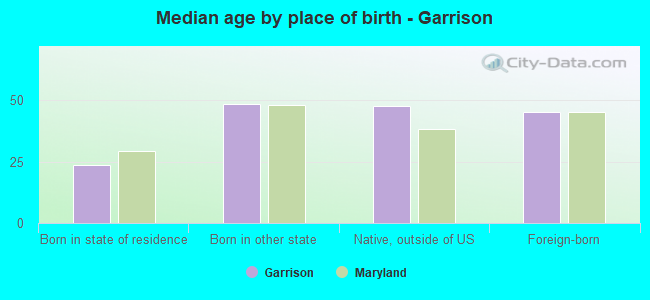
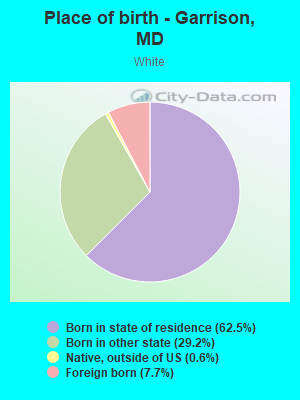
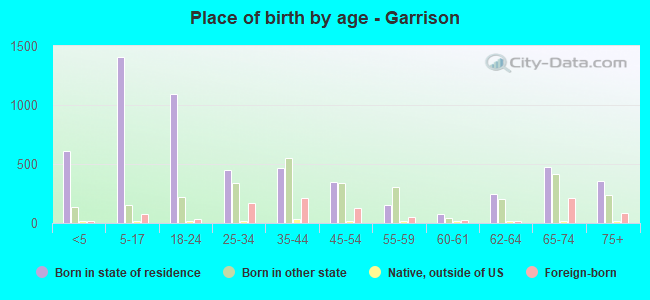
Place of birth - Born in state of residence (%)
Place of birth - Born in state of residence (%) - White
Place of birth - Born in state of residence (%) - Black or African American
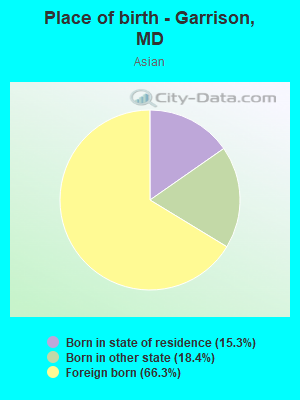
Place of birth - Born in state of residence (%) - Asian
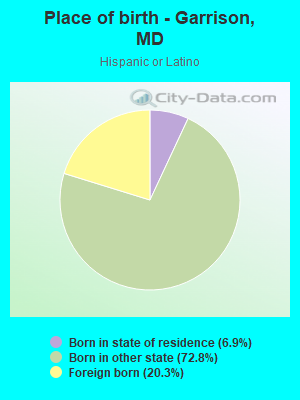
Place of birth - Born in state of residence (%) - Hispanic or Latino
Place of birth - Born in state of residence (%) - American Indian and Alaska Native
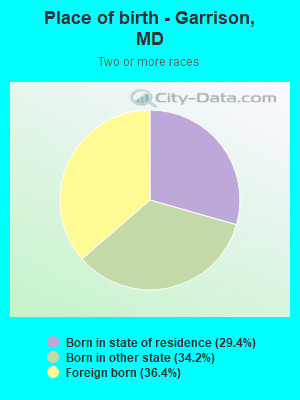
Place of birth - Born in state of residence (%) - Multirace
Place of birth - Born in state of residence (%) - Other Race
Place of birth - Born in other state (%)
Place of birth - Born in other state (%) - White
Place of birth - Born in other state (%) - Black or African American
Place of birth - Born in other state (%) - Asian
Place of birth - Born in other state (%) - Hispanic or Latino
Place of birth - Born in other state (%) - American Indian and Alaska Native
Place of birth - Born in other state (%) - Multirace
Place of birth - Born in other state (%) - Other Race
Place of birth - Native, outside of US (%)
Place of birth - Native, outside of US (%) - White
Place of birth - Native, outside of US (%) - Black or African American
Place of birth - Native, outside of US (%) - Asian
Place of birth - Native, outside of US (%) - Hispanic or Latino
Place of birth - Native, outside of US (%) - American Indian and Alaska Native
Place of birth - Native, outside of US (%) - Multirace
Place of birth - Native, outside of US (%) - Other Race
Place of birth - Foreign born (%)
Place of birth - Foreign born (%) - White
Place of birth - Foreign born (%) - Black or African American
Place of birth - Foreign born (%) - Asian
Place of birth - Foreign born (%) - Hispanic or Latino
Place of birth - Foreign born (%) - American Indian and Alaska Native
Place of birth - Foreign born (%) - Multirace
Place of birth - Foreign born (%) - Other Race
Residents speaking English at home (%)
Residents speaking English at home - Born in the United States (%)
Residents speaking English at home - Native, born elsewhere (%)
Residents speaking English at home - Foreign born (%)
Residents speaking Spanish at home (%)
Residents speaking Spanish at home - Born in the United States (%)
Residents speaking Spanish at home - Native, born elsewhere (%)
Residents speaking Spanish at home - Foreign born (%)
Residents speaking other language at home (%)
Residents speaking other language at home - Born in the United States (%)
Residents speaking other language at home - Native, born elsewhere (%)
Residents speaking other language at home - Foreign born (%)
Marital status - Never married (%)
Marital status - Now married (%)
Marital status - Separated (%)
Marital status - Widowed (%)
Marital status - Divorced (%)
Ancestries Reported - Arab (%)
Ancestries Reported - Czech (%)
Ancestries Reported - Danish (%)
Ancestries Reported - Dutch (%)
Ancestries Reported - English (%)
Ancestries Reported - French (%)
Ancestries Reported - French Canadian (%)
Ancestries Reported - German (%)
Ancestries Reported - Greek (%)
Ancestries Reported - Hungarian (%)
Ancestries Reported - Irish (%)
Ancestries Reported - Italian (%)
Ancestries Reported - Lithuanian (%)
Ancestries Reported - Norwegian (%)
Ancestries Reported - Polish (%)
Ancestries Reported - Portuguese (%)
Ancestries Reported - Russian (%)
Ancestries Reported - Scotch-Irish (%)
Ancestries Reported - Scottish (%)
Ancestries Reported - Slovak (%)
Ancestries Reported - Subsaharan African (%)
Ancestries Reported - Swedish (%)
Ancestries Reported - Swiss (%)
Ancestries Reported - Ukrainian (%)
Ancestries Reported - United States (%)
Ancestries Reported - Welsh (%)
Ancestries Reported - West Indian (%)
Ancestries Reported - Other (%)
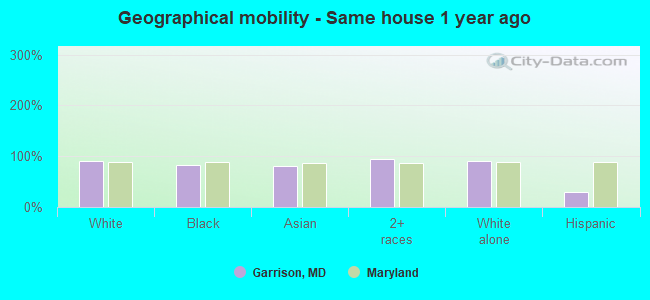
Geographical mobility - Same house 1 year ago (%)
Geographical mobility - Same house 1 year ago (%) - White
Geographical mobility - Same house 1 year ago (%) - Black or African American
Geographical mobility - Same house 1 year ago (%) - Asian
Geographical mobility - Same house 1 year ago (%) - Hispanic or Latino
Geographical mobility - Same house 1 year ago (%) - American Indian and Alaska Native
Geographical mobility - Same house 1 year ago (%) - Multirace
Geographical mobility - Same house 1 year ago (%) - Other Race
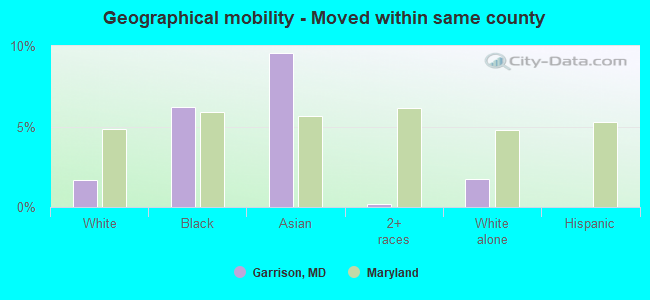
Geographical mobility - Moved within same county (%)
Geographical mobility - Moved within same county (%) - White
Geographical mobility - Moved within same county (%) - Black or African American
Geographical mobility - Moved within same county (%) - Asian
Geographical mobility - Moved within same county (%) - Hispanic or Latino
Geographical mobility - Moved within same county (%) - American Indian and Alaska Native
Geographical mobility - Moved within same county (%) - Multirace
Geographical mobility - Moved within same county (%) - Other Race
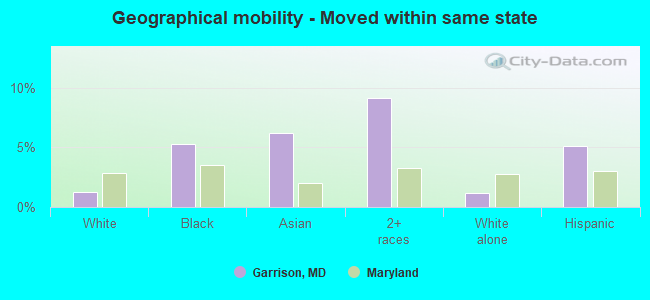
Geographical mobility - Moved from different county within same state (%)
Geographical mobility - Moved from different county within same state (%) - White
Geographical mobility - Moved from different county within same state (%) - Black or African American
Geographical mobility - Moved from different county within same state (%) - Asian
Geographical mobility - Moved from different county within same state (%) - Hispanic or Latino
Geographical mobility - Moved from different county within same state (%) - American Indian and Alaska Native
Geographical mobility - Moved from different county within same state (%) - Multirace
Geographical mobility - Moved from different county within same state (%) - Other Race
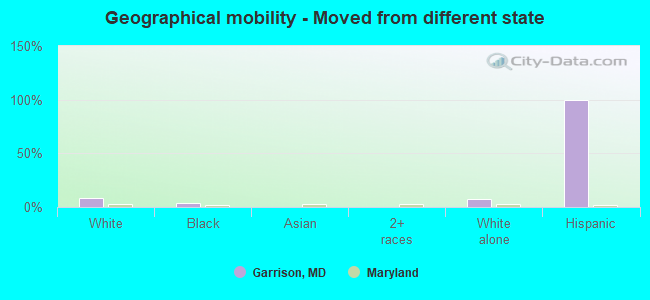
Geographical mobility - Moved from different state (%)
Geographical mobility - Moved from different state (%) - White
Geographical mobility - Moved from different state (%) - Black or African American
Geographical mobility - Moved from different state (%) - Asian
Geographical mobility - Moved from different state (%) - Hispanic or Latino
Geographical mobility - Moved from different state (%) - American Indian and Alaska Native
Geographical mobility - Moved from different state (%) - Multirace
Geographical mobility - Moved from different state (%) - Other Race
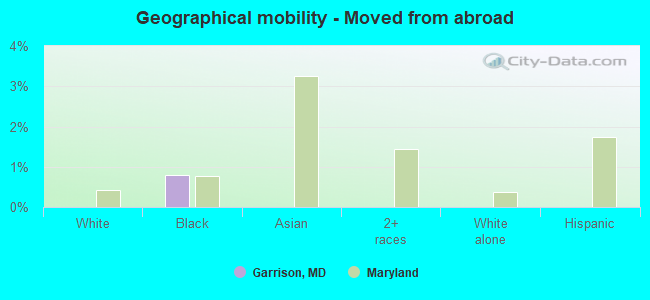
Geographical mobility - Moved from abroad (%)
Geographical mobility - Moved from abroad (%) - White
Geographical mobility - Moved from abroad (%) - Black or African American
Geographical mobility - Moved from abroad (%) - Asian
Geographical mobility - Moved from abroad (%) - Hispanic or Latino
Geographical mobility - Moved from abroad (%) - American Indian and Alaska Native
Geographical mobility - Moved from abroad (%) - Multirace
Geographical mobility - Moved from abroad (%) - Other Race
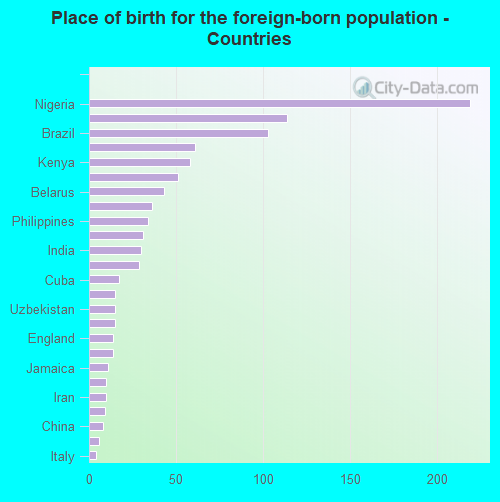
Place of birth for the foreign-born population - Ireland (%)
Place of birth for the foreign-born population - Denmark (%)
Place of birth for the foreign-born population - Norway (%)
Place of birth for the foreign-born population - Sweden (%)
Place of birth for the foreign-born population - United Kingdom (%)
Place of birth for the foreign-born population - England (%)
Place of birth for the foreign-born population - Scotland (%)
Place of birth for the foreign-born population - Other Northern Europe (%)
Place of birth for the foreign-born population - Austria (%)
Place of birth for the foreign-born population - Belgium (%)
Place of birth for the foreign-born population - France (%)
Place of birth for the foreign-born population - Germany (%)
Place of birth for the foreign-born population - Netherlands (%)
Place of birth for the foreign-born population - Switzerland (%)
Place of birth for the foreign-born population - Other Western Europe (%)
Place of birth for the foreign-born population - Greece (%)
Place of birth for the foreign-born population - Italy (%)
Place of birth for the foreign-born population - Portugal (%)
Place of birth for the foreign-born population - Spain (%)
Place of birth for the foreign-born population - Other Southern Europe (%)
Place of birth for the foreign-born population - Albania (%)
Place of birth for the foreign-born population - Belarus (%)
Place of birth for the foreign-born population - Bosnia and Herzegovina (%)
Place of birth for the foreign-born population - Bulgaria (%)
Place of birth for the foreign-born population - Croatia (%)
Place of birth for the foreign-born population - Czechoslovakia (%)
Place of birth for the foreign-born population - Hungary (%)
Place of birth for the foreign-born population - Latvia (%)
Place of birth for the foreign-born population - Lithuania (%)
Place of birth for the foreign-born population - North Macedonia (Macedonia) (%)
Place of birth for the foreign-born population - Moldova (%)
Place of birth for the foreign-born population - Poland (%)
Place of birth for the foreign-born population - Romania (%)
Place of birth for the foreign-born population - Russia (%)
Place of birth for the foreign-born population - Serbia (%)
Place of birth for the foreign-born population - Ukraine (%)
Place of birth for the foreign-born population - Other Eastern Europe (%)
Place of birth for the foreign-born population - China (%)
Place of birth for the foreign-born population - Hong Kong (%)
Place of birth for the foreign-born population - Taiwan (%)
Place of birth for the foreign-born population - Japan (%)
Place of birth for the foreign-born population - Korea (%)
Place of birth for the foreign-born population - Other Eastern Asia (%)
Place of birth for the foreign-born population - Afghanistan (%)
Place of birth for the foreign-born population - Bangladesh (%)
Place of birth for the foreign-born population - India (%)
Place of birth for the foreign-born population - Iran (%)
Place of birth for the foreign-born population - Kazakhstan (%)
Place of birth for the foreign-born population - Nepal (%)
Place of birth for the foreign-born population - Pakistan (%)
Place of birth for the foreign-born population - Sri Lanka (%)
Place of birth for the foreign-born population - Uzbekistan (%)
Place of birth for the foreign-born population - Other South Central Asia (%)
Place of birth for the foreign-born population - Burma (%)
Place of birth for the foreign-born population - Cambodia (%)
Place of birth for the foreign-born population - Indonesia (%)
Place of birth for the foreign-born population - Laos (%)
Place of birth for the foreign-born population - Malaysia (%)
Place of birth for the foreign-born population - Philippines (%)
Place of birth for the foreign-born population - Singapore (%)
Place of birth for the foreign-born population - Thailand (%)
Place of birth for the foreign-born population - Vietnam (%)
Place of birth for the foreign-born population - Other South Eastern Asia (%)
Place of birth for the foreign-born population - Armenia (%)
Place of birth for the foreign-born population - Iraq (%)
Place of birth for the foreign-born population - Israel (%)
Place of birth for the foreign-born population - Jordan (%)
Place of birth for the foreign-born population - Kuwait (%)
Place of birth for the foreign-born population - Lebanon (%)
Place of birth for the foreign-born population - Saudi Arabia (%)
Place of birth for the foreign-born population - Syria (%)
Place of birth for the foreign-born population - Turkey (%)
Place of birth for the foreign-born population - Yemen (%)
Place of birth for the foreign-born population - Other Western Asia (%)
Place of birth for the foreign-born population - Eritrea (%)
Place of birth for the foreign-born population - Ethiopia (%)
Place of birth for the foreign-born population - Kenya (%)
Place of birth for the foreign-born population - Somalia (%)
Place of birth for the foreign-born population - Uganda (%)
Place of birth for the foreign-born population - Zimbabwe (%)
Place of birth for the foreign-born population - Other Eastern Africa (%)
Place of birth for the foreign-born population - Cameroon (%)
Place of birth for the foreign-born population - Congo (%)
Place of birth for the foreign-born population - Democratic Republic of Congo (Zaire) (%)
Place of birth for the foreign-born population - Other Middle Africa (%)
Place of birth for the foreign-born population - Egypt (%)
Place of birth for the foreign-born population - Morocco (%)
Place of birth for the foreign-born population - Sudan (%)
Place of birth for the foreign-born population - Other Northern Africa (%)
Place of birth for the foreign-born population - South Africa (%)
Place of birth for the foreign-born population - Other Southern Africa (%)
Place of birth for the foreign-born population - Cabo Verde (%)
Place of birth for the foreign-born population - Ghana (%)
Place of birth for the foreign-born population - Liberia (%)
Place of birth for the foreign-born population - Nigeria (%)
Place of birth for the foreign-born population - Senegal (%)
Place of birth for the foreign-born population - Sierra Leone (%)
Place of birth for the foreign-born population - Other Western Africa (%)
Place of birth for the foreign-born population - Australia (%)
Place of birth for the foreign-born population - New Zealand (%)
Place of birth for the foreign-born population - Fiji (%)
Place of birth for the foreign-born population - Micronesia (%)
Place of birth for the foreign-born population - Bahamas (%)
Place of birth for the foreign-born population - Barbados (%)
Place of birth for the foreign-born population - Cuba (%)
Place of birth for the foreign-born population - Dominica (%)
Place of birth for the foreign-born population - Dominican Republic (%)
Place of birth for the foreign-born population - Grenada (%)
Place of birth for the foreign-born population - Haiti (%)
Place of birth for the foreign-born population - Jamaica (%)
Place of birth for the foreign-born population - St. Vincent and the Grenadines (%)
Place of birth for the foreign-born population - Trinidad and Tobago (%)
Place of birth for the foreign-born population - West Indies (%)
Place of birth for the foreign-born population - Other Caribbean (%)
Place of birth for the foreign-born population - Belize (%)
Place of birth for the foreign-born population - Costa Rica (%)
Place of birth for the foreign-born population - El Salvador (%)
Place of birth for the foreign-born population - Guatemala (%)
Place of birth for the foreign-born population - Honduras (%)
Place of birth for the foreign-born population - Mexico (%)
Place of birth for the foreign-born population - Nicaragua (%)
Place of birth for the foreign-born population - Panama (%)
Place of birth for the foreign-born population - Other Central America (%)
Place of birth for the foreign-born population - Argentina (%)
Place of birth for the foreign-born population - Bolivia (%)
Place of birth for the foreign-born population - Brazil (%)
Place of birth for the foreign-born population - Chile (%)
Place of birth for the foreign-born population - Colombia (%)
Place of birth for the foreign-born population - Ecuador (%)
Place of birth for the foreign-born population - Guyana (%)
Place of birth for the foreign-born population - Peru (%)
Place of birth for the foreign-born population - Uruguay (%)
Place of birth for the foreign-born population - Venezuela (%)
Place of birth for the foreign-born population - Other South America (%)
Place of birth for the foreign-born population - Canada (%)
Place of birth for the foreign-born population - Other Northern America (%)
Place of birth for the foreign-born population - Other (%)
Latest news about races in Garrison, MD collected exclusively by city-data.com from local newspapers, TV, and radio stations
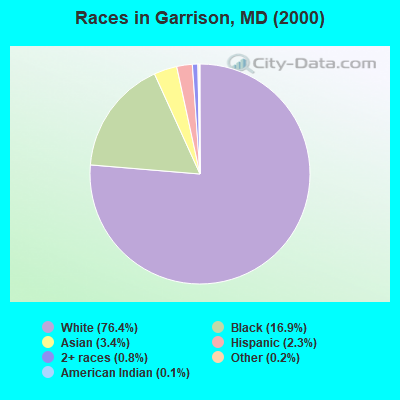
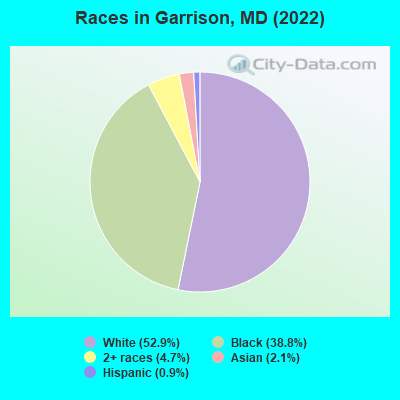
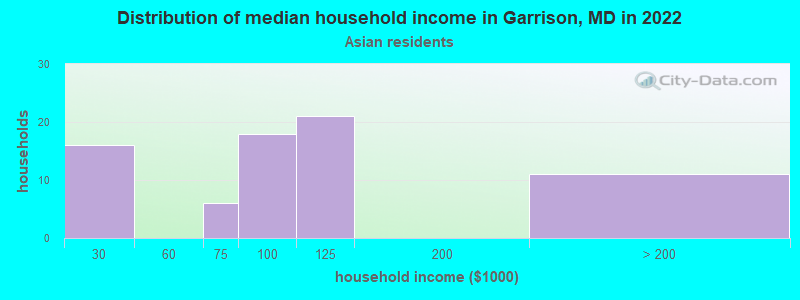
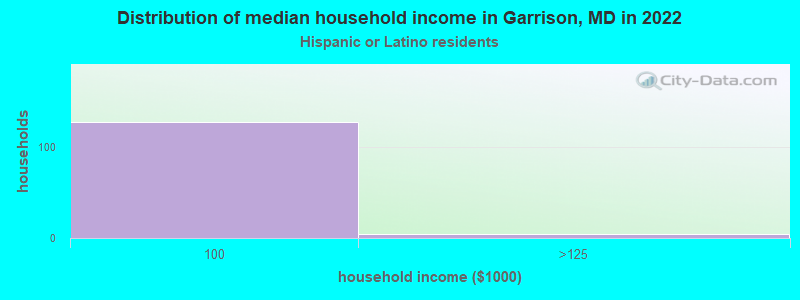
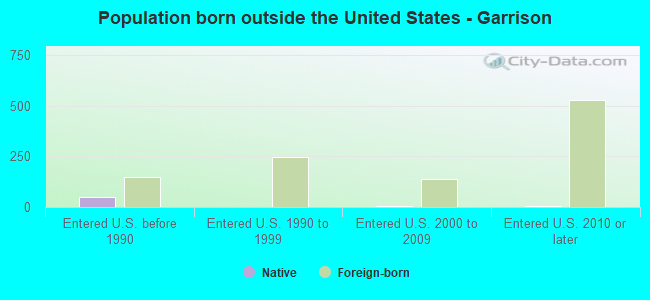
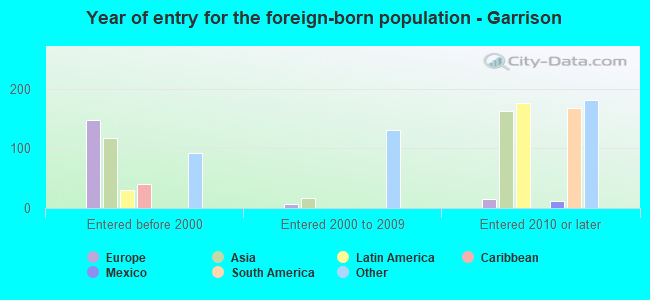
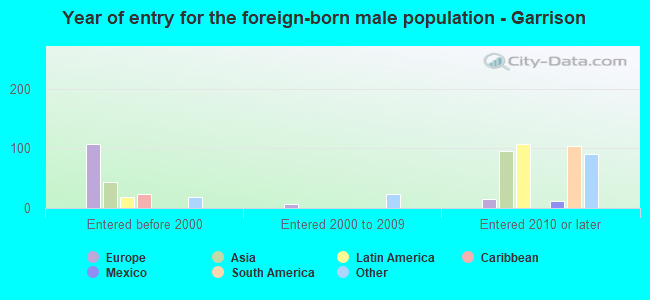
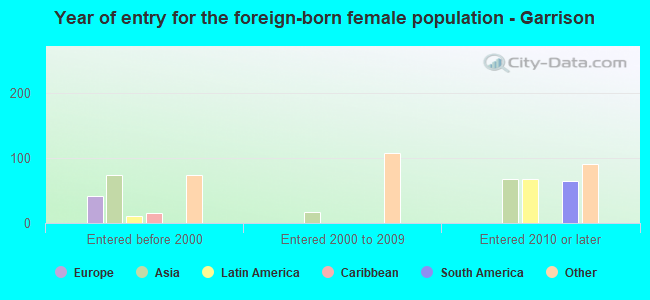
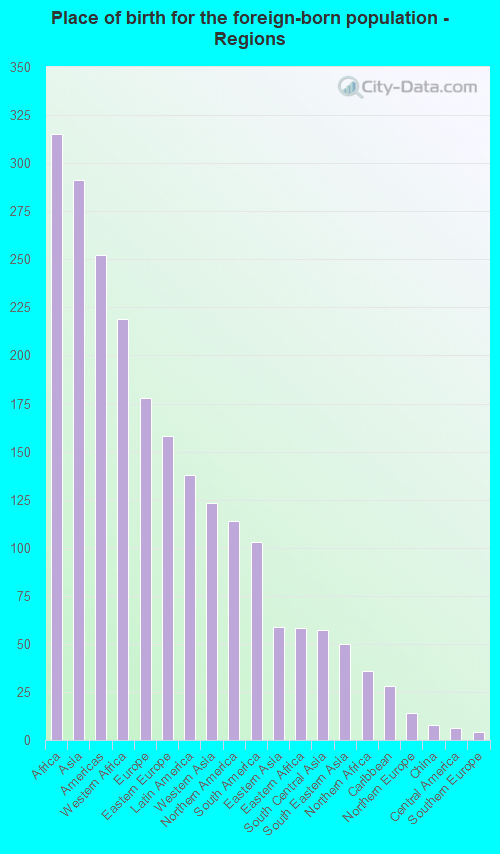
According to 2022 data, the most numerous races in Garrison, MD are White alone (5,137 residents), Black alone (3,769 residents), and Hispanic (90 residents). 88.9% of Garrison residents speak English at home. 10.7% of Garrison, MD residents are foreign-born (3.0% born in Africa, 2.8% born in Asia, 1.7% born in Europe, 1.3% born in Latin America, 1.1% born in North America), which is 49.8% less than the foreign-born rate of 16.0% across the entire state of Maryland.
Race distribution in Garrison
2000 2022
3,286,547 62.1% White alone 1,464,735 27.7% Black alone 227,916 4.3% Hispanic 209,738 4.0% Asian alone 82,946 1.6% Two or more races 13,312 0.3% American Indian alone 9,379 0.2% Other race alone 1,913 0.04% Native Hawaiian and Other
2,906,492 47.1% White alone 1,800,914 29.2% Black alone 705,842 11.4% Hispanic 401,818 6.5% Asian alone 291,317 4.7% Two or more races 46,930 0.8% Other race alone 8,930 0.1% American Indian alone 2,417 0.04% Native Hawaiian and Other
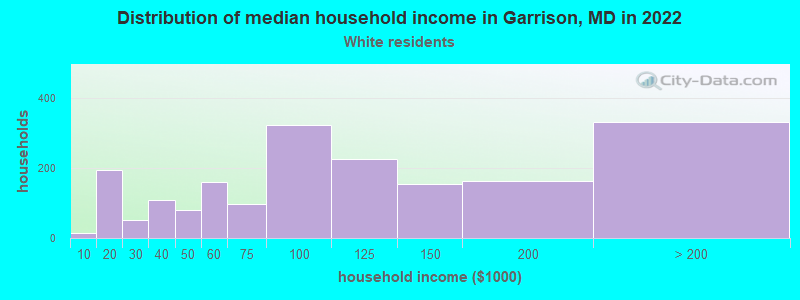
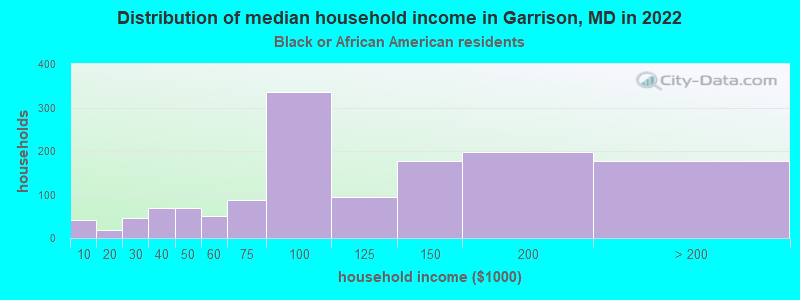
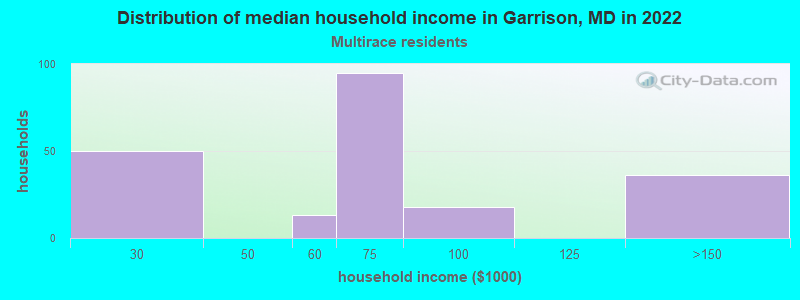
Income and house value in Garrison Median household income in 2022 $87,590 White non-Hispanic householders$95,860 Black householders$91,491 Asian householders$77,447 Two or more races householders$81,834 Hispanic or Latino race householdersMedian 2022 house value $356,986 White Non-Hispanic householders$327,028 Black or African American householders $324,508 Asian householders$314,988 Some other race householders$729,933 Two or more races householders$587,978 Hispanic or Latino householders
Median age by race in Garrison
39.2 Median age for White residents25.9 44.7 33.8 Median age for Black or African American residents28.4 36.6 -768,041,236.3 Median age for American Indian / Alaska Native residents-867,632,849.4 -677,419,354.2 33.1 Median age for Asian residents32.1 54.6 -1,541,125,539.6 Median age for Native Hawaiian / Pacific Islander residents-790,901,136.6 -760,942,760.2 -682,291,666.0 Median age for Other race residents-733,333,332.6 -706,766,916.6 36.2 Median age for Two or more races residents40.5 42.2 39.0 Median age for White alone residents25.7 44.6 56.7 Median age for Hispanic or Latino residents-644,278,606.3 56.6
Owner/renter occupied households by race in Garrison
House owners and renters - White residents 971 51.8% Owner occupied905 48.2% Renter occupiedHouse owners and renters - Black or African American residents 398 30.0% Owner occupied929 70.0% Renter occupiedHouse owners and renters - Asian residents 52 71.7% Owner occupied20 28.3% Renter occupiedHouse owners and renters - Two or more races residents 56 23.6% Owner occupied182 76.4% Renter occupiedHouse owners and renters - White alone residents 975 51.8% Owner occupied909 48.2% Renter occupiedHouse owners and renters - Hispanic or Latino residents 90 100.0% Renter occupied
Language usage in Garrison
English speakers - Total 88.9% of residents of Garrison speak English at home.
0.3% of residents speak Spanish at home 11 42.3% Speak English very well15 57.7% Speak English less than very well11.1% of residents speak other language at home 647 64.9% Speak English very well350 35.1% Speak English less than very well
English speakers - Born in the United States 93.9% of residents of Garrison speak English at home.
0.2% of residents speak Spanish at home 6 100.0% Speak English very well5.4% of residents speak other language at home 152 100.0% Speak English very well
All residents speak only English at home
English speakers - Foreign-born 22.2% of residents of Garrison speak English at home.
2.1% of residents speak Spanish at home 5 22.7% Speak English very well17 77.3% Speak English less than very well74.7% of residents speak other language at home 422 54.9% Speak English very well347 45.1% Speak English less than very well
White (Caucasian) - Speak only English Native:
96.8% (4,187)Foreign-born:
34.6% (135)
White (Caucasian) - Speak another language Native:
3.1% (132)Foreign-born:
66.2% (257)
Black or African American - Speak only English Native:
99.5% (3,240)Foreign-born:
19.8% (56)
Black or African American - Speak another language Native:
1.0% (32)Foreign-born:
71.7% (202)
Asian - Speak only English Native:
37.8% (24)Foreign-born:
4.3% (6)
Asian - Speak another language Native:
62.0% (40)Foreign-born:
94.5% (129)
Two or more races - Speak another language Native:
0.7% (2)Foreign-born:
81.8% (131)
White alone - Speak only English Native:
96.5% (4,191)Foreign-born:
30.8% (133)
White alone - Speak another language Native:
3.3% (142)Foreign-born:
69.1% (299)
Hispanic or Latino - Speak another language Native:
8.7% (6)Foreign-born:
100.0% (17)
Foreign-born residents in Garrison 1,037 residents are foreign born (3.0% Africa , 2.8% Asia , 1.7% Europe , 1.3% Latin America , 1.1% North America ).
This city:
10.7%Maryland:
15.7%
Marital status for residents in Garrison Marital status - White (Caucasian) population 15 years and over
Males 43.4% Never married49.0% Now married1.5% Separated1.4% Widowed4.8% DivorcedFemales 33.7% Never married40.7% Now married0.7% Separated13.2% Widowed11.8% DivorcedWomen who gave birth in the past 12 months Now married:
100.0% (29)Unmarried:
0.0% (0)
Women who did not give birth in the past 12 months Now married:
35.8% (372)Unmarried:
64.2% (668)
Marital status - Black or African American population 15 years and over
Males 46.5% Never married25.8% Now married1.4% Separated3.2% Widowed23.1% DivorcedFemales 49.5% Never married25.5% Now married1.5% Separated9.4% Widowed14.1% DivorcedWomen who gave birth in the past 12 months Now married:
44.7% (21)Unmarried:
55.3% (26)
Women who did not give birth in the past 12 months Now married:
21.6% (235)Unmarried:
78.4% (852)
Marital status - Asian population 15 years and over
Males 56.2% Never married43.7% Now married0.0% Separated0.0% Widowed0.0% DivorcedFemales 9.5% Never married65.5% Now married12.9% Separated12.1% Widowed0.0% DivorcedWomen who gave birth in the past 12 months Now married:
100.0% (24)Unmarried:
0.0% (0)
Women who did not give birth in the past 12 months Now married:
62.1% (17)Unmarried:
37.9% (11)
Marital status - Two or more races population 15 years and over
Males 38.0% Never married30.7% Now married0.0% Separated0.0% Widowed31.2% DivorcedFemales 2.2% Never married62.4% Now married0.0% Separated0.0% Widowed35.5% DivorcedWomen who did not give birth in the past 12 months Now married:
41.1% (29)Unmarried:
58.9% (42)
Marital status - White alone, not Hispanic / Latino population 15 years and over
Males 43.2% Never married49.2% Now married1.5% Separated1.4% Widowed4.8% DivorcedFemales 33.7% Never married40.8% Now married0.7% Separated13.2% Widowed11.6% DivorcedWomen who gave birth in the past 12 months Now married:
100.0% (29)Unmarried:
0.0% (0)
Women who did not give birth in the past 12 months Now married:
35.8% (375)Unmarried:
64.2% (673)
Marital status - Hispanic or Latino population 15 years and over
Males 100.0% Never married0.0% Now married0.0% Separated0.0% Widowed0.0% DivorcedFemales 3.2% Never married88.9% Now married0.0% Separated0.0% Widowed7.9% Divorced
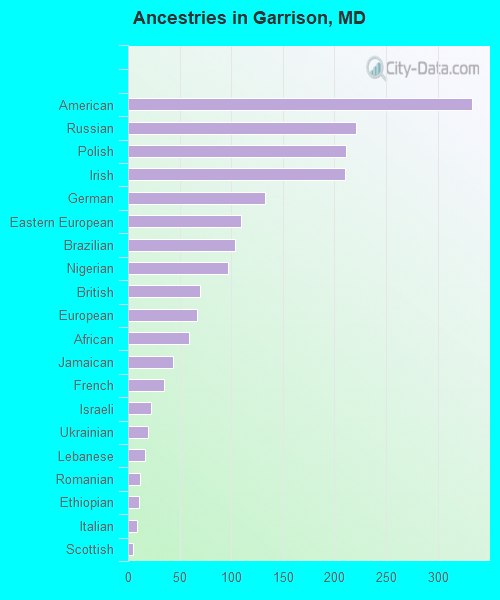
Ancestries in Garrison
333 5.4% American221 3.6% Russian211 3.5% Polish210 3.4% Irish133 2.2% German109 1.8% Eastern European104 1.7% Brazilian97 1.6% Nigerian70 1.1% British67 1.1% European59 1.0% African44 0.7% Jamaican35 0.6% French22 0.4% Israeli19 0.3% Ukrainian16 0.3% Lebanese12 0.2% Romanian11 0.2% Ethiopian9 0.1% Italian5 0.08% Scottish
Children Nativity (place of birth) in Garrison
Children under 6 years - Living with two parents Both parents native 208 100.0% NativeOne native, one foreign-born parent 288 100.0% NativeChildren under 6 years - Living with one parent Native parent 270 100.0% NativeForeign-born parent 24 100.0% NativeChildren 6 to 17 years - Living with two parents Both parents native 480 100.0% NativeBoth parents foreign-born 5 6.4% Native66 93.6% Foreign-bornOne native, one foreign-born parent 653 100.0% NativeChildren 6 to 17 years - Living with one parent Native parent 285 100.0% Native
Grandparents responsible for own grandchildren in Garrison
Grandparents (30 to 59 years) White / Caucasian 22 100.0% Responsible for grandchildrenBlack or African American 44 72.5% Responsible for grandchildren17 27.5% Not responsible for grandchildrenWhite alone, not Hispanic / Latino 22 100.0% Responsible for grandchildren
Grandparents (60 years and over)