Races in Gibsonia, Florida (FL) Detailed Stats
Ancestries, Foreign-born residents, place of birth

Recent posts about races in Gibsonia, Florida on our local forum with over 2,400,000 registered users:
 | Question about Lakeland, Fl: Which is a better area North:33805 area code or South:33813? (2 replies) |
| Tampa Bay neighborhoods (9 replies) |
5.5% of Gibsonia, FL residents are foreign-born (3.0% born in Latin America, 1.5% born in Asia, 1.1% born in Europe), which is 281.6% less than the foreign-born rate of 21.0% across the entire state of Florida.
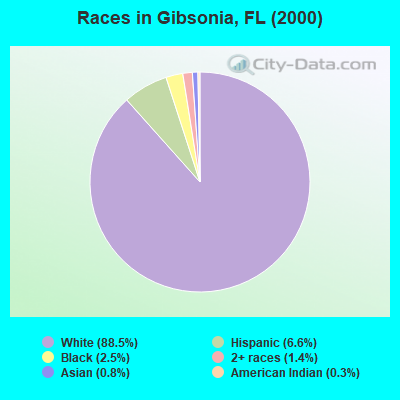
Race distribution in Gibsonia

- 3,98888.5%White alone
- 2976.6%Hispanic
- 1132.5%Black alone
- 611.4%Two or more races
- 340.8%Asian alone
- 140.3%American Indian alone
2000
2022
-
- 10,458,50965.4%White alone
- 2,682,71516.8%Hispanic
- 2,264,26814.2%Black alone
- 261,6931.6%Asian alone
- 236,9541.5%Two or more races
- 42,3580.3%American Indian alone
- 28,9940.2%Other race alone
- 6,8870.04%Native Hawaiian and Other
Pacific Islander alone

-
- 11,309,40350.8%White alone
- 6,025,03927.1%Hispanic
- 3,241,01514.6%Black alone
- 861,6303.9%Two or more races
- 623,6922.8%Asian alone
- 152,0540.7%Other race alone
- 22,5040.1%American Indian alone
- 9,4860.04%Native Hawaiian and Other
Pacific Islander alone

Income and house value in Gibsonia
- Median household income in 2022
- $70,334White non-Hispanic householders
- $84,386Black householders
- $14,767American Indian and Alaska Native householders
- $25,119Asian householders
- $37,785Some other race householders
- $89,457Two or more races householders
- $50,662Hispanic or Latino race householders
- Median 2022 house value
- $327,285White Non-Hispanic householders
- $364,075Black or African American householders
- $364,075Asian householders
- $268,266Some other race householders
- $249,104Two or more races householders
- $303,524Hispanic or Latino householders
Household income for White non-Hispanic householders

Household income for Black householders

Household income for American Indian and Alaska Native householders

Household income for Asian householders

Household income for Two or more races householders

Household income for Hispanic or Latino race householders

Foreign-born residents in Gibsonia
248 residents are foreign born (3.0% Latin America, 1.5% Asia, 1.1% Europe).
| This city: | 5.5% |
| Florida: | 16.7% |
Ancestries in Gibsonia

- 1,21525.4%Other
- 72015.1%German
- 68914.4%United States
- 64013.4%Irish
- 3978.3%English
- 2825.9%Italian
- 2074.3%French
- 1122.3%Polish
- 641.3%Dutch
- 641.3%Swedish
- 551.2%Scottish
- 471.0%Danish
- 450.9%Scotch-Irish
- 430.9%West Indian
- 370.8%Swiss
- 330.7%French Canadian
- 310.6%Greek
- 300.6%Czech
- 270.6%Norwegian
- 190.4%Slovak
- 100.2%Welsh
- 90.2%Lithuanian
- 60.1%Hungarian

Zip codes: 33809.