Races in Gillette, Wyoming (WY) Detailed Stats
Data:
Races - White alone (%)
Races - White alone (% change since 2000)
Races - Black alone (%)
Races - Black alone (% change since 2000)
Races - American Indian alone (%)
Races - American Indian alone (% change since 2000)
Races - Asian alone (%)
Races - Asian alone (% change since 2000)
Races - Hispanic (%)
Races - Hispanic (% change since 2000)
Races - Native Hawaiian and Other Pacific Islander alone (%)
Races - Native Hawaiian and Other Pacific Islander alone (% change since 2000)
Races - Two or more races(%)
Races - Two or more races(% change since 2000)
Races - Other race alone (%)
Races - Other race alone (% change since 2000)
Racial diversity
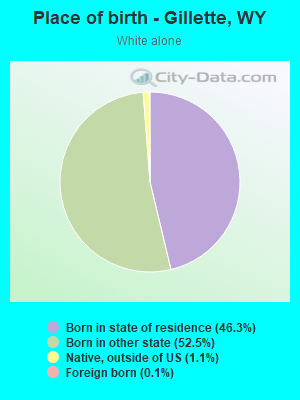
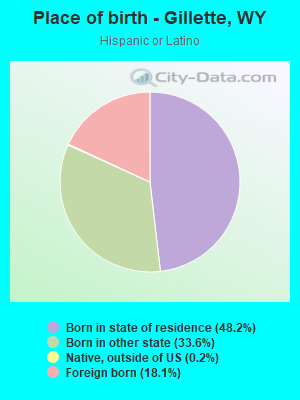
Place of birth - Born in state of residence (%)
Place of birth - Born in state of residence (%) - White
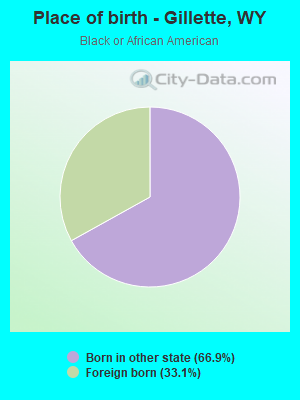
Place of birth - Born in state of residence (%) - Black or African American
Place of birth - Born in state of residence (%) - Asian
Place of birth - Born in state of residence (%) - Hispanic or Latino
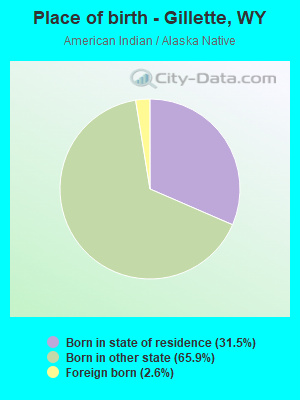
Place of birth - Born in state of residence (%) - American Indian and Alaska Native
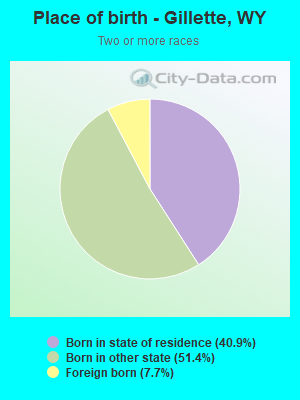
Place of birth - Born in state of residence (%) - Multirace
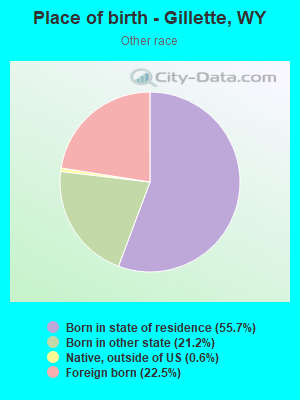
Place of birth - Born in state of residence (%) - Other Race
Place of birth - Born in other state (%)
Place of birth - Born in other state (%) - White
Place of birth - Born in other state (%) - Black or African American
Place of birth - Born in other state (%) - Asian
Place of birth - Born in other state (%) - Hispanic or Latino
Place of birth - Born in other state (%) - American Indian and Alaska Native
Place of birth - Born in other state (%) - Multirace
Place of birth - Born in other state (%) - Other Race
Place of birth - Native, outside of US (%)
Place of birth - Native, outside of US (%) - White
Place of birth - Native, outside of US (%) - Black or African American
Place of birth - Native, outside of US (%) - Asian
Place of birth - Native, outside of US (%) - Hispanic or Latino
Place of birth - Native, outside of US (%) - American Indian and Alaska Native
Place of birth - Native, outside of US (%) - Multirace
Place of birth - Native, outside of US (%) - Other Race
Place of birth - Foreign born (%)
Place of birth - Foreign born (%) - White
Place of birth - Foreign born (%) - Black or African American
Place of birth - Foreign born (%) - Asian
Place of birth - Foreign born (%) - Hispanic or Latino
Place of birth - Foreign born (%) - American Indian and Alaska Native
Place of birth - Foreign born (%) - Multirace
Place of birth - Foreign born (%) - Other Race
Residents speaking English at home (%)
Residents speaking English at home - Born in the United States (%)
Residents speaking English at home - Native, born elsewhere (%)
Residents speaking English at home - Foreign born (%)
Residents speaking Spanish at home (%)
Residents speaking Spanish at home - Born in the United States (%)
Residents speaking Spanish at home - Native, born elsewhere (%)
Residents speaking Spanish at home - Foreign born (%)
Residents speaking other language at home (%)
Residents speaking other language at home - Born in the United States (%)
Residents speaking other language at home - Native, born elsewhere (%)
Residents speaking other language at home - Foreign born (%)
Marital status - Never married (%)
Marital status - Now married (%)
Marital status - Separated (%)
Marital status - Widowed (%)
Marital status - Divorced (%)
Ancestries Reported - Arab (%)
Ancestries Reported - Czech (%)
Ancestries Reported - Danish (%)
Ancestries Reported - Dutch (%)
Ancestries Reported - English (%)
Ancestries Reported - French (%)
Ancestries Reported - French Canadian (%)
Ancestries Reported - German (%)
Ancestries Reported - Greek (%)
Ancestries Reported - Hungarian (%)
Ancestries Reported - Irish (%)
Ancestries Reported - Italian (%)
Ancestries Reported - Lithuanian (%)
Ancestries Reported - Norwegian (%)
Ancestries Reported - Polish (%)
Ancestries Reported - Portuguese (%)
Ancestries Reported - Russian (%)
Ancestries Reported - Scotch-Irish (%)
Ancestries Reported - Scottish (%)
Ancestries Reported - Slovak (%)
Ancestries Reported - Subsaharan African (%)
Ancestries Reported - Swedish (%)
Ancestries Reported - Swiss (%)
Ancestries Reported - Ukrainian (%)
Ancestries Reported - United States (%)
Ancestries Reported - Welsh (%)
Ancestries Reported - West Indian (%)
Ancestries Reported - Other (%)
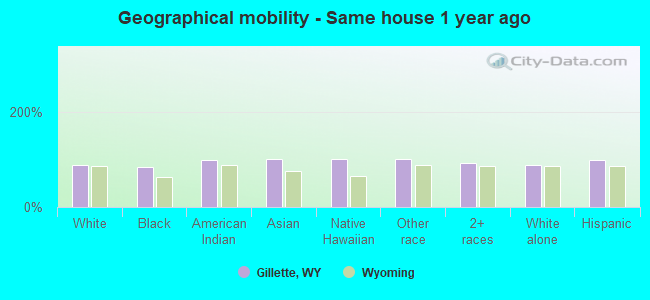
Geographical mobility - Same house 1 year ago (%)
Geographical mobility - Same house 1 year ago (%) - White
Geographical mobility - Same house 1 year ago (%) - Black or African American
Geographical mobility - Same house 1 year ago (%) - Asian
Geographical mobility - Same house 1 year ago (%) - Hispanic or Latino
Geographical mobility - Same house 1 year ago (%) - American Indian and Alaska Native
Geographical mobility - Same house 1 year ago (%) - Multirace
Geographical mobility - Same house 1 year ago (%) - Other Race
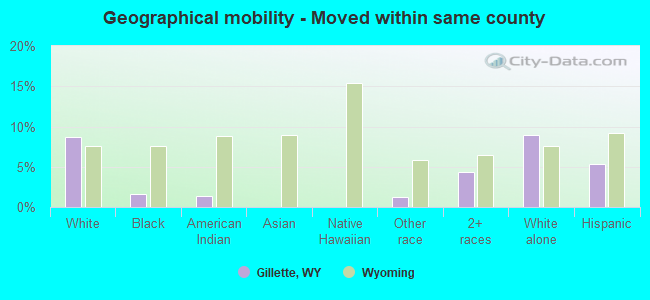
Geographical mobility - Moved within same county (%)
Geographical mobility - Moved within same county (%) - White
Geographical mobility - Moved within same county (%) - Black or African American
Geographical mobility - Moved within same county (%) - Asian
Geographical mobility - Moved within same county (%) - Hispanic or Latino
Geographical mobility - Moved within same county (%) - American Indian and Alaska Native
Geographical mobility - Moved within same county (%) - Multirace
Geographical mobility - Moved within same county (%) - Other Race
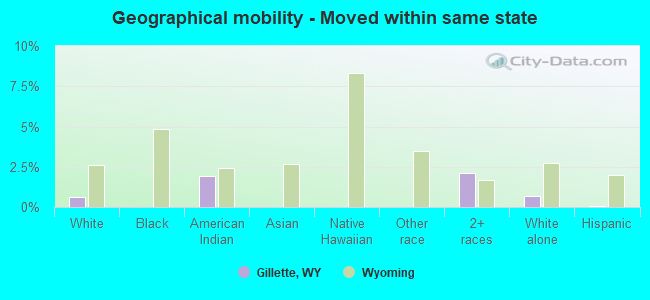
Geographical mobility - Moved from different county within same state (%)
Geographical mobility - Moved from different county within same state (%) - White
Geographical mobility - Moved from different county within same state (%) - Black or African American
Geographical mobility - Moved from different county within same state (%) - Asian
Geographical mobility - Moved from different county within same state (%) - Hispanic or Latino
Geographical mobility - Moved from different county within same state (%) - American Indian and Alaska Native
Geographical mobility - Moved from different county within same state (%) - Multirace
Geographical mobility - Moved from different county within same state (%) - Other Race
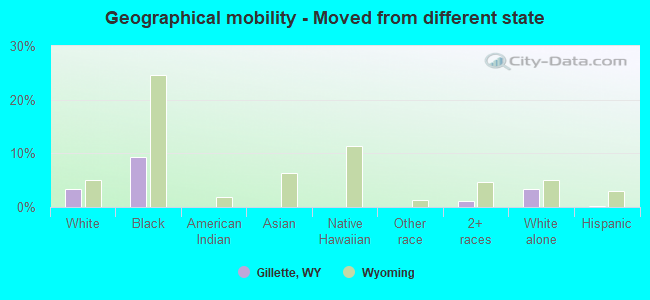
Geographical mobility - Moved from different state (%)
Geographical mobility - Moved from different state (%) - White
Geographical mobility - Moved from different state (%) - Black or African American
Geographical mobility - Moved from different state (%) - Asian
Geographical mobility - Moved from different state (%) - Hispanic or Latino
Geographical mobility - Moved from different state (%) - American Indian and Alaska Native
Geographical mobility - Moved from different state (%) - Multirace
Geographical mobility - Moved from different state (%) - Other Race
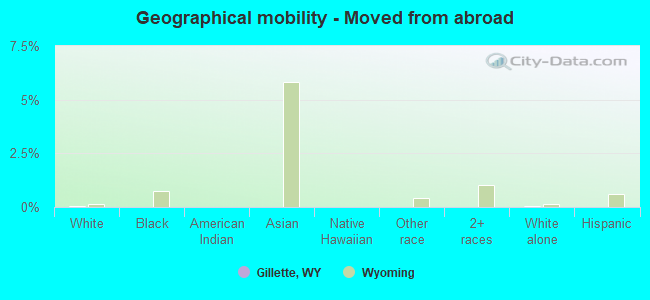
Geographical mobility - Moved from abroad (%)
Geographical mobility - Moved from abroad (%) - White
Geographical mobility - Moved from abroad (%) - Black or African American
Geographical mobility - Moved from abroad (%) - Asian
Geographical mobility - Moved from abroad (%) - Hispanic or Latino
Geographical mobility - Moved from abroad (%) - American Indian and Alaska Native
Geographical mobility - Moved from abroad (%) - Multirace
Geographical mobility - Moved from abroad (%) - Other Race
Place of birth for the foreign-born population - Ireland (%)
Place of birth for the foreign-born population - Denmark (%)
Place of birth for the foreign-born population - Norway (%)
Place of birth for the foreign-born population - Sweden (%)
Place of birth for the foreign-born population - United Kingdom (%)
Place of birth for the foreign-born population - England (%)
Place of birth for the foreign-born population - Scotland (%)
Place of birth for the foreign-born population - Other Northern Europe (%)
Place of birth for the foreign-born population - Austria (%)
Place of birth for the foreign-born population - Belgium (%)
Place of birth for the foreign-born population - France (%)
Place of birth for the foreign-born population - Germany (%)
Place of birth for the foreign-born population - Netherlands (%)
Place of birth for the foreign-born population - Switzerland (%)
Place of birth for the foreign-born population - Other Western Europe (%)
Place of birth for the foreign-born population - Greece (%)
Place of birth for the foreign-born population - Italy (%)
Place of birth for the foreign-born population - Portugal (%)
Place of birth for the foreign-born population - Spain (%)
Place of birth for the foreign-born population - Other Southern Europe (%)
Place of birth for the foreign-born population - Albania (%)
Place of birth for the foreign-born population - Belarus (%)
Place of birth for the foreign-born population - Bosnia and Herzegovina (%)
Place of birth for the foreign-born population - Bulgaria (%)
Place of birth for the foreign-born population - Croatia (%)
Place of birth for the foreign-born population - Czechoslovakia (%)
Place of birth for the foreign-born population - Hungary (%)
Place of birth for the foreign-born population - Latvia (%)
Place of birth for the foreign-born population - Lithuania (%)
Place of birth for the foreign-born population - North Macedonia (Macedonia) (%)
Place of birth for the foreign-born population - Moldova (%)
Place of birth for the foreign-born population - Poland (%)
Place of birth for the foreign-born population - Romania (%)
Place of birth for the foreign-born population - Russia (%)
Place of birth for the foreign-born population - Serbia (%)
Place of birth for the foreign-born population - Ukraine (%)
Place of birth for the foreign-born population - Other Eastern Europe (%)
Place of birth for the foreign-born population - China (%)
Place of birth for the foreign-born population - Hong Kong (%)
Place of birth for the foreign-born population - Taiwan (%)
Place of birth for the foreign-born population - Japan (%)
Place of birth for the foreign-born population - Korea (%)
Place of birth for the foreign-born population - Other Eastern Asia (%)
Place of birth for the foreign-born population - Afghanistan (%)
Place of birth for the foreign-born population - Bangladesh (%)
Place of birth for the foreign-born population - India (%)
Place of birth for the foreign-born population - Iran (%)
Place of birth for the foreign-born population - Kazakhstan (%)
Place of birth for the foreign-born population - Nepal (%)
Place of birth for the foreign-born population - Pakistan (%)
Place of birth for the foreign-born population - Sri Lanka (%)
Place of birth for the foreign-born population - Uzbekistan (%)
Place of birth for the foreign-born population - Other South Central Asia (%)
Place of birth for the foreign-born population - Burma (%)
Place of birth for the foreign-born population - Cambodia (%)
Place of birth for the foreign-born population - Indonesia (%)
Place of birth for the foreign-born population - Laos (%)
Place of birth for the foreign-born population - Malaysia (%)
Place of birth for the foreign-born population - Philippines (%)
Place of birth for the foreign-born population - Singapore (%)
Place of birth for the foreign-born population - Thailand (%)
Place of birth for the foreign-born population - Vietnam (%)
Place of birth for the foreign-born population - Other South Eastern Asia (%)
Place of birth for the foreign-born population - Armenia (%)
Place of birth for the foreign-born population - Iraq (%)
Place of birth for the foreign-born population - Israel (%)
Place of birth for the foreign-born population - Jordan (%)
Place of birth for the foreign-born population - Kuwait (%)
Place of birth for the foreign-born population - Lebanon (%)
Place of birth for the foreign-born population - Saudi Arabia (%)
Place of birth for the foreign-born population - Syria (%)
Place of birth for the foreign-born population - Turkey (%)
Place of birth for the foreign-born population - Yemen (%)
Place of birth for the foreign-born population - Other Western Asia (%)
Place of birth for the foreign-born population - Eritrea (%)
Place of birth for the foreign-born population - Ethiopia (%)
Place of birth for the foreign-born population - Kenya (%)
Place of birth for the foreign-born population - Somalia (%)
Place of birth for the foreign-born population - Uganda (%)
Place of birth for the foreign-born population - Zimbabwe (%)
Place of birth for the foreign-born population - Other Eastern Africa (%)
Place of birth for the foreign-born population - Cameroon (%)
Place of birth for the foreign-born population - Congo (%)
Place of birth for the foreign-born population - Democratic Republic of Congo (Zaire) (%)
Place of birth for the foreign-born population - Other Middle Africa (%)
Place of birth for the foreign-born population - Egypt (%)
Place of birth for the foreign-born population - Morocco (%)
Place of birth for the foreign-born population - Sudan (%)
Place of birth for the foreign-born population - Other Northern Africa (%)
Place of birth for the foreign-born population - South Africa (%)
Place of birth for the foreign-born population - Other Southern Africa (%)
Place of birth for the foreign-born population - Cabo Verde (%)
Place of birth for the foreign-born population - Ghana (%)
Place of birth for the foreign-born population - Liberia (%)
Place of birth for the foreign-born population - Nigeria (%)
Place of birth for the foreign-born population - Senegal (%)
Place of birth for the foreign-born population - Sierra Leone (%)
Place of birth for the foreign-born population - Other Western Africa (%)
Place of birth for the foreign-born population - Australia (%)
Place of birth for the foreign-born population - New Zealand (%)
Place of birth for the foreign-born population - Fiji (%)
Place of birth for the foreign-born population - Micronesia (%)
Place of birth for the foreign-born population - Bahamas (%)
Place of birth for the foreign-born population - Barbados (%)
Place of birth for the foreign-born population - Cuba (%)
Place of birth for the foreign-born population - Dominica (%)
Place of birth for the foreign-born population - Dominican Republic (%)
Place of birth for the foreign-born population - Grenada (%)
Place of birth for the foreign-born population - Haiti (%)
Place of birth for the foreign-born population - Jamaica (%)
Place of birth for the foreign-born population - St. Vincent and the Grenadines (%)
Place of birth for the foreign-born population - Trinidad and Tobago (%)
Place of birth for the foreign-born population - West Indies (%)
Place of birth for the foreign-born population - Other Caribbean (%)
Place of birth for the foreign-born population - Belize (%)
Place of birth for the foreign-born population - Costa Rica (%)
Place of birth for the foreign-born population - El Salvador (%)
Place of birth for the foreign-born population - Guatemala (%)
Place of birth for the foreign-born population - Honduras (%)
Place of birth for the foreign-born population - Mexico (%)
Place of birth for the foreign-born population - Nicaragua (%)
Place of birth for the foreign-born population - Panama (%)
Place of birth for the foreign-born population - Other Central America (%)
Place of birth for the foreign-born population - Argentina (%)
Place of birth for the foreign-born population - Bolivia (%)
Place of birth for the foreign-born population - Brazil (%)
Place of birth for the foreign-born population - Chile (%)
Place of birth for the foreign-born population - Colombia (%)
Place of birth for the foreign-born population - Ecuador (%)
Place of birth for the foreign-born population - Guyana (%)
Place of birth for the foreign-born population - Peru (%)
Place of birth for the foreign-born population - Uruguay (%)
Place of birth for the foreign-born population - Venezuela (%)
Place of birth for the foreign-born population - Other South America (%)
Place of birth for the foreign-born population - Canada (%)
Place of birth for the foreign-born population - Other Northern America (%)
Place of birth for the foreign-born population - Other (%)
Latest news about races in Gillette, WY collected exclusively by city-data.com from local newspapers, TV, and radio stations
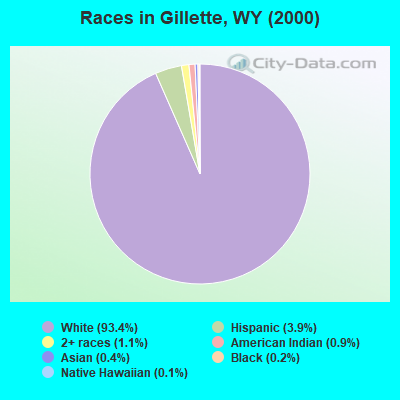
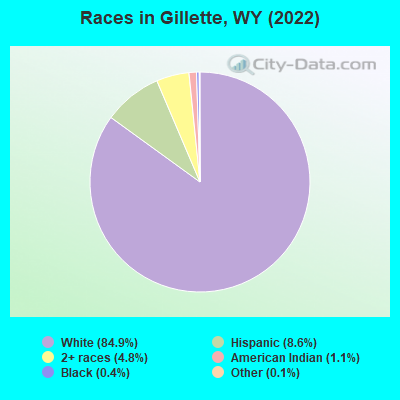
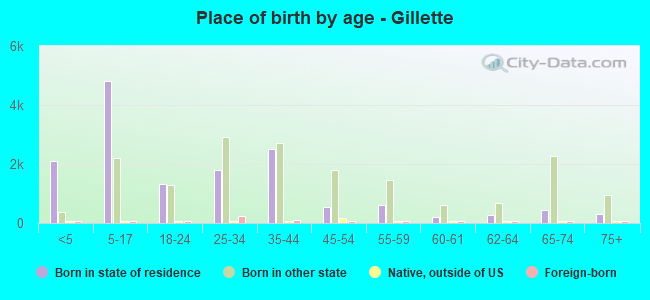
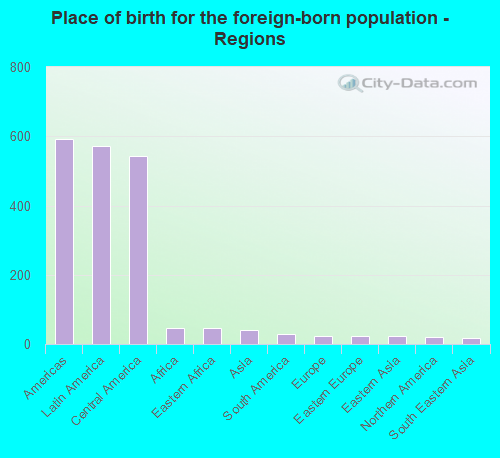
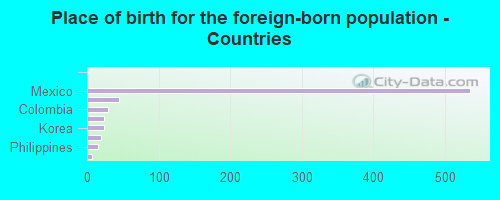
According to 2022 data, the most numerous races in Gillette, WY are White alone (28,321 residents), Hispanic (2,877 residents), and Two or more races (1,595 residents). 94.4% of Gillette residents speak English at home. 2.1% of Gillette, WY residents are foreign-born (1.7% born in Latin America), which is 42.5% less than the foreign-born rate of 3.0% across the entire state of Wyoming.
Race distribution in Gillette
2000 2022
438,799 88.9% White alone 31,669 6.4% Hispanic 10,238 2.1% American Indian alone 6,164 1.2% Two or more races 3,504 0.7% Black alone 2,670 0.5% Asian alone 474 0.10% Other race alone 264 0.05% Native Hawaiian and Other
473,220 81.4% White alone 62,803 10.8% Hispanic 22,911 3.9% Two or more races 9,589 1.6% American Indian alone 4,997 0.9% Other race alone 3,990 0.7% Black alone 3,577 0.6% Asian alone 294 0.05% Native Hawaiian and Other
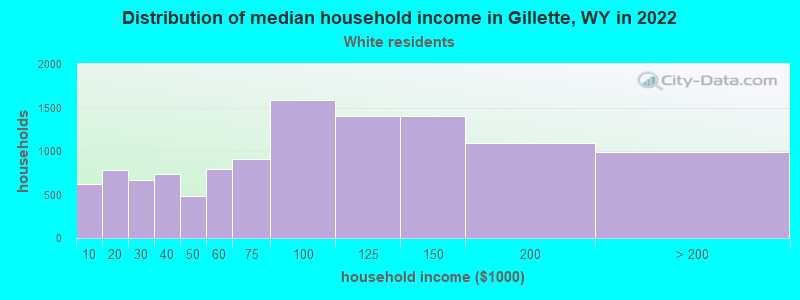
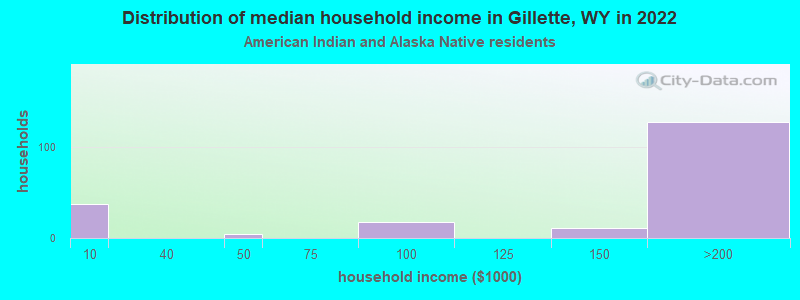
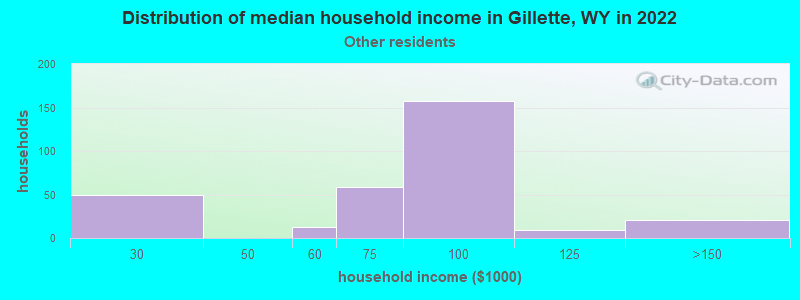
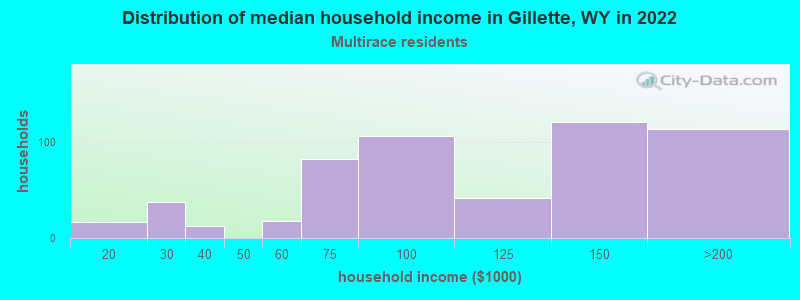
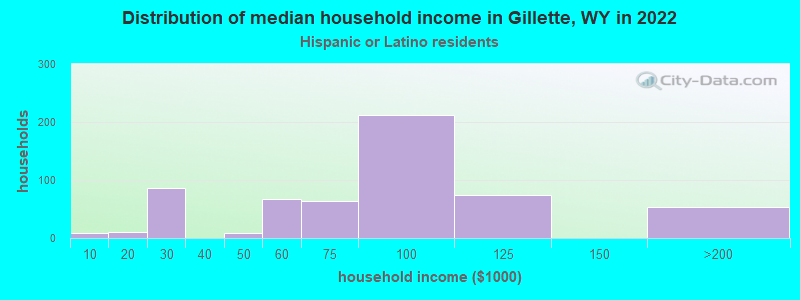
Income and house value in Gillette Median household income in 2022 $85,980 White non-Hispanic householders$106,100 American Indian and Alaska Native householders$85,377 Some other race householders$102,898 Two or more races householders$97,103 Hispanic or Latino race householdersMedian 2022 house value $286,245 White Non-Hispanic householders$153,427 American Indian or Alaska Native householders $379,274 Asian householders$112,208 Some other race householders$250,464 Two or more races householders$310,862 Hispanic or Latino householders
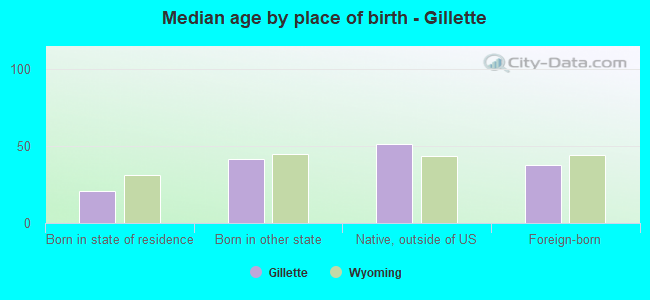
Median age by race in Gillette
34.9 Median age for White residents34.4 35.2 29.6 Median age for Black or African American residents25.0 -746,302,615.9 30.6 Median age for American Indian / Alaska Native residents35.1 53.0 -802,845,527.7 Median age for Asian residents-684,684,684.0 -929,503,915.5 -594,708,994.1 Median age for Native Hawaiian / Pacific Islander residents-652,729,383.8 -865,828,091.4 20.5 Median age for Other race residents11.6 18.5 23.9 Median age for Two or more races residents18.9 36.3 35.1 Median age for White alone residents34.4 35.8 20.0 Median age for Hispanic or Latino residents15.5 22.3
Owner/renter occupied households by race in Gillette
House owners and renters - White residents 8,711 75.6% Owner occupied2,818 24.4% Renter occupiedHouse owners and renters - Black or African American residents 9 100.0% Renter occupiedHouse owners and renters - American Indian / Alaska Native residents 164 75.5% Owner occupied53 24.5% Renter occupiedHouse owners and renters - Asian residents 17 100.0% Owner occupiedHouse owners and renters - Other race residents 292 80.5% Owner occupied71 19.5% Renter occupiedHouse owners and renters - Two or more races residents 545 84.7% Owner occupied98 15.3% Renter occupiedHouse owners and renters - White alone residents 8,726 75.6% Owner occupied2,820 24.4% Renter occupiedHouse owners and renters - Hispanic or Latino residents 467 76.7% Owner occupied142 23.3% Renter occupied
Language usage in Gillette
English speakers - Total 94.4% of residents of Gillette speak English at home.
5.9% of residents speak Spanish at home 1,303 72.1% Speak English very well503 27.9% Speak English less than very well0.2% of residents speak other language at home 53 81.5% Speak English very well12 18.5% Speak English less than very well
English speakers - Born in the United States 96.5% of residents of Gillette speak English at home.
3.4% of residents speak Spanish at home 474 81.6% Speak English very well107 18.4% Speak English less than very well0.2% of residents speak other language at home 38 100.0% Speak English very well
All residents speak only English at home
English speakers - Foreign-born 23.2% of residents of Gillette speak English at home.
76.1% of residents speak Spanish at home 223 47.2% Speak English very well249 52.8% Speak English less than very well3.5% of residents speak other language at home 9 40.9% Speak English very well13 59.1% Speak English less than very well
White (Caucasian) - Speak only English Native:
98.6% (26,319)Foreign-born:
30.8% (26)
White (Caucasian) - Speak another language Native:
1.5% (390)Foreign-born:
64.8% (54)
Black or African American - Speak only English Native:
94.7% (105)Foreign-born:
97.4% (44)
American Indian / Alaska Native - Speak another language Native:
3.5% (16)Foreign-born:
100.0% (11)
Other race - Speak only English Native:
41.6% (298)Foreign-born:
16.4% (60)
Other race - Speak another language Native:
54.4% (390)Foreign-born:
81.2% (300)
Two or more races - Speak another language Native:
24.0% (584)Foreign-born:
100.0% (216)
White alone - Speak only English Native:
98.5% (26,100)Foreign-born:
70.8% (24)
White alone - Speak another language Native:
1.4% (377)Foreign-born:
28.6% (10)
Hispanic or Latino - Speak only English Native:
52.9% (962)Foreign-born:
14.9% (78)
Hispanic or Latino - Speak another language Native:
47.3% (860)Foreign-born:
93.3% (486)
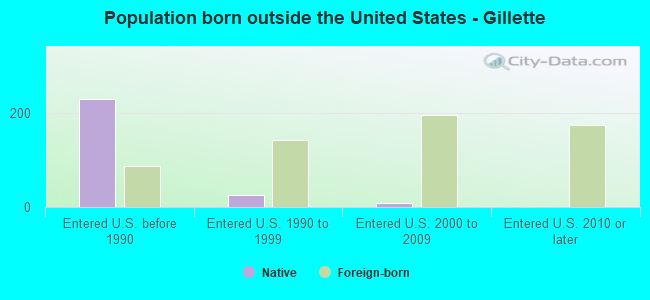
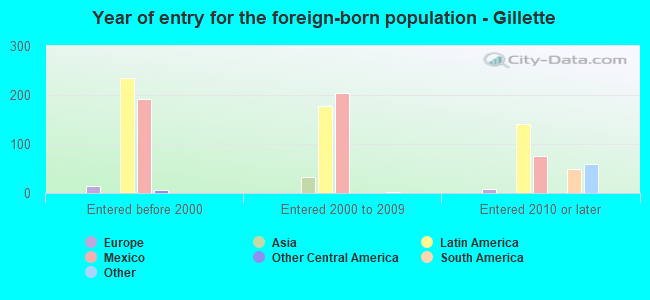
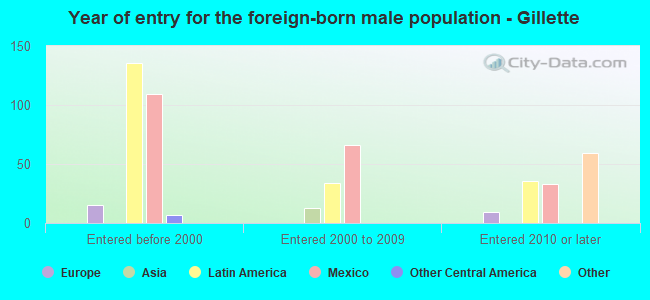
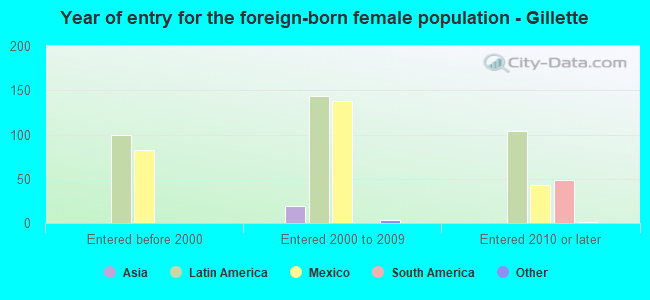
Foreign-born residents in Gillette 702 residents are foreign born (1.7% Latin America ).
This city:
2.1%Wyoming:
3.4%
Marital status for residents in Gillette Marital status - White (Caucasian) population 15 years and over
Males 30.5% Never married55.0% Now married3.2% Separated1.4% Widowed9.9% DivorcedFemales 20.7% Never married55.8% Now married1.4% Separated7.8% Widowed14.3% DivorcedWomen who gave birth in the past 12 months Now married:
80.6% (447)Unmarried:
19.4% (108)
Women who did not give birth in the past 12 months Now married:
52.1% (2,973)Unmarried:
47.9% (2,728)
Marital status - Black or African American population 15 years and over
Males 19.3% Never married79.5% Now married1.1% Separated0.0% Widowed0.0% DivorcedFemales 51.5% Never married48.5% Now married0.0% Separated0.0% Widowed0.0% DivorcedWomen who did not give birth in the past 12 months Now married:
0.0% (0)Unmarried:
100.0% (17)
Marital status - American Indian / Alaska Native population 15 years and over
Males 25.4% Never married70.6% Now married0.0% Separated0.0% Widowed3.9% DivorcedFemales 7.1% Never married63.6% Now married0.0% Separated0.0% Widowed29.2% DivorcedWomen who gave birth in the past 12 months Now married:
100.0% (21)Unmarried:
0.0% (0)
Women who did not give birth in the past 12 months Now married:
66.7% (20)Unmarried:
33.3% (10)
Marital status - Other race population 15 years and over
Males 7.7% Never married70.2% Now married0.0% Separated3.4% Widowed18.6% DivorcedFemales 43.7% Never married56.3% Now married0.0% Separated0.0% Widowed0.0% DivorcedWomen who gave birth in the past 12 months Now married:
0.0% (0)Unmarried:
100.0% (42)
Women who did not give birth in the past 12 months Now married:
61.4% (205)Unmarried:
38.6% (129)
Marital status - Two or more races population 15 years and over
Males 42.8% Never married53.6% Now married0.2% Separated0.0% Widowed3.5% DivorcedFemales 34.8% Never married51.0% Now married3.1% Separated7.6% Widowed3.5% DivorcedWomen who gave birth in the past 12 months Now married:
79.5% (52)Unmarried:
20.5% (13)
Women who did not give birth in the past 12 months Now married:
51.5% (408)Unmarried:
48.5% (384)
Marital status - White alone, not Hispanic / Latino population 15 years and over
Males 30.4% Never married54.9% Now married3.2% Separated1.4% Widowed10.0% DivorcedFemales 20.3% Never married55.9% Now married1.2% Separated7.9% Widowed14.7% DivorcedWomen who gave birth in the past 12 months Now married:
79.7% (434)Unmarried:
20.3% (110)
Women who did not give birth in the past 12 months Now married:
52.1% (2,942)Unmarried:
47.9% (2,702)
Marital status - Hispanic or Latino population 15 years and over
Males 26.2% Never married61.5% Now married0.1% Separated1.6% Widowed10.4% DivorcedFemales 34.6% Never married52.7% Now married2.8% Separated8.8% Widowed1.1% DivorcedWomen who gave birth in the past 12 months Now married:
35.3% (24)Unmarried:
64.7% (44)
Women who did not give birth in the past 12 months Now married:
61.0% (337)Unmarried:
39.0% (216)
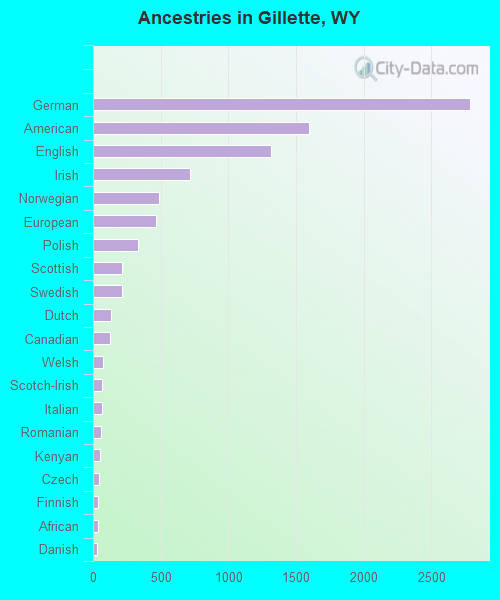
Ancestries in Gillette
2,787 23.3% German1,597 13.3% American1,314 11.0% English719 6.0% Irish488 4.1% Norwegian462 3.9% European330 2.8% Polish216 1.8% Scottish211 1.8% Swedish131 1.1% Dutch123 1.0% Canadian77 0.6% Welsh68 0.6% Scotch-Irish65 0.5% Italian62 0.5% Romanian52 0.4% Kenyan47 0.4% Czech40 0.3% Finnish38 0.3% African31 0.3% Danish25 0.2% Yugoslavian24 0.2% British21 0.2% Northern European17 0.1% Hungarian16 0.1% French8 0.07% Czechoslovakian2 0.02% Russian2 0.02% Scandinavian1 0.01% Portuguese
Geographical mobility in Gillette Same house 1 year ago 24,447 86.9% White (Caucasian)111 83.6% Black or African American445 98.7% American Indian / Alaska Native25 99.8% Asian16 100.0% Native Hawaiian / Pacific Islander1,608 100.0% Other race2,549 92.9% Two or more races24,216 86.6% White alone, not Hispanic / Latino2,815 98.1% Hispanic or LatinoMoved within same county 2,456 8.7% White / Caucasian2 1.7% Black or African American6 1.4% American Indian / Alaska Native20 1.3% Other race118 4.3% Two or more races2,491 8.9% White alone, not Hispanic / Latino152 5.3% Hispanic or LatinoMoved within same state 182 0.6% White / Caucasian9 1.9% American Indian / Alaska Native58 2.1% Two or more races190 0.7% White alone, not Hispanic / Latino3 0.1% Hispanic or LatinoMoved from different state 957 3.4% White / Caucasian12 9.3% Black or African American31 1.1% Two or more races959 3.4% White alone, not Hispanic / Latino5 0.2% Hispanic or LatinoMoved from abroad 11 0.0% White13 0.0% White alone, not Hispanic / Latino
Children Nativity (place of birth) in Gillette
Children under 6 years - Living with two parents Both parents native 2,173 100.0% NativeBoth parents foreign-born 13 100.0% NativeOne native, one foreign-born parent 114 100.0% NativeChildren under 6 years - Living with one parent Native parent 699 100.0% NativeForeign-born parent 20 100.0% Native
Children 6 to 17 years - Living with two parents Both parents native 3,656 100.0% NativeBoth parents foreign-born 174 100.0% NativeOne native, one foreign-born parent 288 100.0% NativeChildren 6 to 17 years - Living with one parent Native parent 2,200 100.0% Native
Grandparents responsible for own grandchildren in Gillette
Grandparents (30 to 59 years) White / Caucasian 17 9.8% Responsible for grandchildren161 90.2% Not responsible for grandchildrenAmerican Indian / Alaska Native 18 65.8% Responsible for grandchildren9 34.2% Not responsible for grandchildrenTwo or more races 20 100.0% Responsible for grandchildrenWhite alone, not Hispanic / Latino 23 12.2% Responsible for grandchildren166 87.8% Not responsible for grandchildrenGrandparents (60 years and over) White / Caucasian 3 4.4% Responsible for grandchildren61 95.6% Not responsible for grandchildrenAmerican Indian / Alaska Native 17 100.0% Responsible for grandchildrenWhite alone, not Hispanic / Latino 3 4.6% Responsible for grandchildren61 95.4% Not responsible for grandchildren