Races in Glendora, California (CA) Detailed Stats
Data:
Races - White alone (%)
Races - White alone (% change since 2000)
Races - Black alone (%)
Races - Black alone (% change since 2000)
Races - American Indian alone (%)
Races - American Indian alone (% change since 2000)
Races - Asian alone (%)
Races - Asian alone (% change since 2000)
Races - Hispanic (%)
Races - Hispanic (% change since 2000)
Races - Native Hawaiian and Other Pacific Islander alone (%)
Races - Native Hawaiian and Other Pacific Islander alone (% change since 2000)
Races - Two or more races(%)
Races - Two or more races(% change since 2000)
Races - Other race alone (%)
Races - Other race alone (% change since 2000)
Racial diversity
Place of birth - Born in state of residence (%)
Place of birth - Born in state of residence (%) - White
Place of birth - Born in state of residence (%) - Black or African American
Place of birth - Born in state of residence (%) - Asian
Place of birth - Born in state of residence (%) - Hispanic or Latino
Place of birth - Born in state of residence (%) - American Indian and Alaska Native
Place of birth - Born in state of residence (%) - Multirace
Place of birth - Born in state of residence (%) - Other Race
Place of birth - Born in other state (%)
Place of birth - Born in other state (%) - White
Place of birth - Born in other state (%) - Black or African American
Place of birth - Born in other state (%) - Asian
Place of birth - Born in other state (%) - Hispanic or Latino
Place of birth - Born in other state (%) - American Indian and Alaska Native
Place of birth - Born in other state (%) - Multirace
Place of birth - Born in other state (%) - Other Race
Place of birth - Native, outside of US (%)
Place of birth - Native, outside of US (%) - White
Place of birth - Native, outside of US (%) - Black or African American
Place of birth - Native, outside of US (%) - Asian
Place of birth - Native, outside of US (%) - Hispanic or Latino
Place of birth - Native, outside of US (%) - American Indian and Alaska Native
Place of birth - Native, outside of US (%) - Multirace
Place of birth - Native, outside of US (%) - Other Race
Place of birth - Foreign born (%)
Place of birth - Foreign born (%) - White
Place of birth - Foreign born (%) - Black or African American
Place of birth - Foreign born (%) - Asian
Place of birth - Foreign born (%) - Hispanic or Latino
Place of birth - Foreign born (%) - American Indian and Alaska Native
Place of birth - Foreign born (%) - Multirace
Place of birth - Foreign born (%) - Other Race
Residents speaking English at home (%)
Residents speaking English at home - Born in the United States (%)
Residents speaking English at home - Native, born elsewhere (%)
Residents speaking English at home - Foreign born (%)
Residents speaking Spanish at home (%)
Residents speaking Spanish at home - Born in the United States (%)
Residents speaking Spanish at home - Native, born elsewhere (%)
Residents speaking Spanish at home - Foreign born (%)
Residents speaking other language at home (%)
Residents speaking other language at home - Born in the United States (%)
Residents speaking other language at home - Native, born elsewhere (%)
Residents speaking other language at home - Foreign born (%)
Marital status - Never married (%)
Marital status - Now married (%)
Marital status - Separated (%)
Marital status - Widowed (%)
Marital status - Divorced (%)
Ancestries Reported - Arab (%)
Ancestries Reported - Czech (%)
Ancestries Reported - Danish (%)
Ancestries Reported - Dutch (%)
Ancestries Reported - English (%)
Ancestries Reported - French (%)
Ancestries Reported - French Canadian (%)
Ancestries Reported - German (%)
Ancestries Reported - Greek (%)
Ancestries Reported - Hungarian (%)
Ancestries Reported - Irish (%)
Ancestries Reported - Italian (%)
Ancestries Reported - Lithuanian (%)
Ancestries Reported - Norwegian (%)
Ancestries Reported - Polish (%)
Ancestries Reported - Portuguese (%)
Ancestries Reported - Russian (%)
Ancestries Reported - Scotch-Irish (%)
Ancestries Reported - Scottish (%)
Ancestries Reported - Slovak (%)
Ancestries Reported - Subsaharan African (%)
Ancestries Reported - Swedish (%)
Ancestries Reported - Swiss (%)
Ancestries Reported - Ukrainian (%)
Ancestries Reported - United States (%)
Ancestries Reported - Welsh (%)
Ancestries Reported - West Indian (%)
Ancestries Reported - Other (%)
Geographical mobility - Same house 1 year ago (%)
Geographical mobility - Same house 1 year ago (%) - White
Geographical mobility - Same house 1 year ago (%) - Black or African American
Geographical mobility - Same house 1 year ago (%) - Asian
Geographical mobility - Same house 1 year ago (%) - Hispanic or Latino
Geographical mobility - Same house 1 year ago (%) - American Indian and Alaska Native
Geographical mobility - Same house 1 year ago (%) - Multirace
Geographical mobility - Same house 1 year ago (%) - Other Race
Geographical mobility - Moved within same county (%)
Geographical mobility - Moved within same county (%) - White
Geographical mobility - Moved within same county (%) - Black or African American
Geographical mobility - Moved within same county (%) - Asian
Geographical mobility - Moved within same county (%) - Hispanic or Latino
Geographical mobility - Moved within same county (%) - American Indian and Alaska Native
Geographical mobility - Moved within same county (%) - Multirace
Geographical mobility - Moved within same county (%) - Other Race
Geographical mobility - Moved from different county within same state (%)
Geographical mobility - Moved from different county within same state (%) - White
Geographical mobility - Moved from different county within same state (%) - Black or African American
Geographical mobility - Moved from different county within same state (%) - Asian
Geographical mobility - Moved from different county within same state (%) - Hispanic or Latino
Geographical mobility - Moved from different county within same state (%) - American Indian and Alaska Native
Geographical mobility - Moved from different county within same state (%) - Multirace
Geographical mobility - Moved from different county within same state (%) - Other Race
Geographical mobility - Moved from different state (%)
Geographical mobility - Moved from different state (%) - White
Geographical mobility - Moved from different state (%) - Black or African American
Geographical mobility - Moved from different state (%) - Asian
Geographical mobility - Moved from different state (%) - Hispanic or Latino
Geographical mobility - Moved from different state (%) - American Indian and Alaska Native
Geographical mobility - Moved from different state (%) - Multirace
Geographical mobility - Moved from different state (%) - Other Race
Geographical mobility - Moved from abroad (%)
Geographical mobility - Moved from abroad (%) - White
Geographical mobility - Moved from abroad (%) - Black or African American
Geographical mobility - Moved from abroad (%) - Asian
Geographical mobility - Moved from abroad (%) - Hispanic or Latino
Geographical mobility - Moved from abroad (%) - American Indian and Alaska Native
Geographical mobility - Moved from abroad (%) - Multirace
Geographical mobility - Moved from abroad (%) - Other Race
Place of birth for the foreign-born population - Ireland (%)
Place of birth for the foreign-born population - Denmark (%)
Place of birth for the foreign-born population - Norway (%)
Place of birth for the foreign-born population - Sweden (%)
Place of birth for the foreign-born population - United Kingdom (%)
Place of birth for the foreign-born population - England (%)
Place of birth for the foreign-born population - Scotland (%)
Place of birth for the foreign-born population - Other Northern Europe (%)
Place of birth for the foreign-born population - Austria (%)
Place of birth for the foreign-born population - Belgium (%)
Place of birth for the foreign-born population - France (%)
Place of birth for the foreign-born population - Germany (%)
Place of birth for the foreign-born population - Netherlands (%)
Place of birth for the foreign-born population - Switzerland (%)
Place of birth for the foreign-born population - Other Western Europe (%)
Place of birth for the foreign-born population - Greece (%)
Place of birth for the foreign-born population - Italy (%)
Place of birth for the foreign-born population - Portugal (%)
Place of birth for the foreign-born population - Spain (%)
Place of birth for the foreign-born population - Other Southern Europe (%)
Place of birth for the foreign-born population - Albania (%)
Place of birth for the foreign-born population - Belarus (%)
Place of birth for the foreign-born population - Bosnia and Herzegovina (%)
Place of birth for the foreign-born population - Bulgaria (%)
Place of birth for the foreign-born population - Croatia (%)
Place of birth for the foreign-born population - Czechoslovakia (%)
Place of birth for the foreign-born population - Hungary (%)
Place of birth for the foreign-born population - Latvia (%)
Place of birth for the foreign-born population - Lithuania (%)
Place of birth for the foreign-born population - North Macedonia (Macedonia) (%)
Place of birth for the foreign-born population - Moldova (%)
Place of birth for the foreign-born population - Poland (%)
Place of birth for the foreign-born population - Romania (%)
Place of birth for the foreign-born population - Russia (%)
Place of birth for the foreign-born population - Serbia (%)
Place of birth for the foreign-born population - Ukraine (%)
Place of birth for the foreign-born population - Other Eastern Europe (%)
Place of birth for the foreign-born population - China (%)
Place of birth for the foreign-born population - Hong Kong (%)
Place of birth for the foreign-born population - Taiwan (%)
Place of birth for the foreign-born population - Japan (%)
Place of birth for the foreign-born population - Korea (%)
Place of birth for the foreign-born population - Other Eastern Asia (%)
Place of birth for the foreign-born population - Afghanistan (%)
Place of birth for the foreign-born population - Bangladesh (%)
Place of birth for the foreign-born population - India (%)
Place of birth for the foreign-born population - Iran (%)
Place of birth for the foreign-born population - Kazakhstan (%)
Place of birth for the foreign-born population - Nepal (%)
Place of birth for the foreign-born population - Pakistan (%)
Place of birth for the foreign-born population - Sri Lanka (%)
Place of birth for the foreign-born population - Uzbekistan (%)
Place of birth for the foreign-born population - Other South Central Asia (%)
Place of birth for the foreign-born population - Burma (%)
Place of birth for the foreign-born population - Cambodia (%)
Place of birth for the foreign-born population - Indonesia (%)
Place of birth for the foreign-born population - Laos (%)
Place of birth for the foreign-born population - Malaysia (%)
Place of birth for the foreign-born population - Philippines (%)
Place of birth for the foreign-born population - Singapore (%)
Place of birth for the foreign-born population - Thailand (%)
Place of birth for the foreign-born population - Vietnam (%)
Place of birth for the foreign-born population - Other South Eastern Asia (%)
Place of birth for the foreign-born population - Armenia (%)
Place of birth for the foreign-born population - Iraq (%)
Place of birth for the foreign-born population - Israel (%)
Place of birth for the foreign-born population - Jordan (%)
Place of birth for the foreign-born population - Kuwait (%)
Place of birth for the foreign-born population - Lebanon (%)
Place of birth for the foreign-born population - Saudi Arabia (%)
Place of birth for the foreign-born population - Syria (%)
Place of birth for the foreign-born population - Turkey (%)
Place of birth for the foreign-born population - Yemen (%)
Place of birth for the foreign-born population - Other Western Asia (%)
Place of birth for the foreign-born population - Eritrea (%)
Place of birth for the foreign-born population - Ethiopia (%)
Place of birth for the foreign-born population - Kenya (%)
Place of birth for the foreign-born population - Somalia (%)
Place of birth for the foreign-born population - Uganda (%)
Place of birth for the foreign-born population - Zimbabwe (%)
Place of birth for the foreign-born population - Other Eastern Africa (%)
Place of birth for the foreign-born population - Cameroon (%)
Place of birth for the foreign-born population - Congo (%)
Place of birth for the foreign-born population - Democratic Republic of Congo (Zaire) (%)
Place of birth for the foreign-born population - Other Middle Africa (%)
Place of birth for the foreign-born population - Egypt (%)
Place of birth for the foreign-born population - Morocco (%)
Place of birth for the foreign-born population - Sudan (%)
Place of birth for the foreign-born population - Other Northern Africa (%)
Place of birth for the foreign-born population - South Africa (%)
Place of birth for the foreign-born population - Other Southern Africa (%)
Place of birth for the foreign-born population - Cabo Verde (%)
Place of birth for the foreign-born population - Ghana (%)
Place of birth for the foreign-born population - Liberia (%)
Place of birth for the foreign-born population - Nigeria (%)
Place of birth for the foreign-born population - Senegal (%)
Place of birth for the foreign-born population - Sierra Leone (%)
Place of birth for the foreign-born population - Other Western Africa (%)
Place of birth for the foreign-born population - Australia (%)
Place of birth for the foreign-born population - New Zealand (%)
Place of birth for the foreign-born population - Fiji (%)
Place of birth for the foreign-born population - Micronesia (%)
Place of birth for the foreign-born population - Bahamas (%)
Place of birth for the foreign-born population - Barbados (%)
Place of birth for the foreign-born population - Cuba (%)
Place of birth for the foreign-born population - Dominica (%)
Place of birth for the foreign-born population - Dominican Republic (%)
Place of birth for the foreign-born population - Grenada (%)
Place of birth for the foreign-born population - Haiti (%)
Place of birth for the foreign-born population - Jamaica (%)
Place of birth for the foreign-born population - St. Vincent and the Grenadines (%)
Place of birth for the foreign-born population - Trinidad and Tobago (%)
Place of birth for the foreign-born population - West Indies (%)
Place of birth for the foreign-born population - Other Caribbean (%)
Place of birth for the foreign-born population - Belize (%)
Place of birth for the foreign-born population - Costa Rica (%)
Place of birth for the foreign-born population - El Salvador (%)
Place of birth for the foreign-born population - Guatemala (%)
Place of birth for the foreign-born population - Honduras (%)
Place of birth for the foreign-born population - Mexico (%)
Place of birth for the foreign-born population - Nicaragua (%)
Place of birth for the foreign-born population - Panama (%)
Place of birth for the foreign-born population - Other Central America (%)
Place of birth for the foreign-born population - Argentina (%)
Place of birth for the foreign-born population - Bolivia (%)
Place of birth for the foreign-born population - Brazil (%)
Place of birth for the foreign-born population - Chile (%)
Place of birth for the foreign-born population - Colombia (%)
Place of birth for the foreign-born population - Ecuador (%)
Place of birth for the foreign-born population - Guyana (%)
Place of birth for the foreign-born population - Peru (%)
Place of birth for the foreign-born population - Uruguay (%)
Place of birth for the foreign-born population - Venezuela (%)
Place of birth for the foreign-born population - Other South America (%)
Place of birth for the foreign-born population - Canada (%)
Place of birth for the foreign-born population - Other Northern America (%)
Place of birth for the foreign-born population - Other (%)
Latest news about races in Glendora, CA collected exclusively by city-data.com from local newspapers, TV, and radio stations
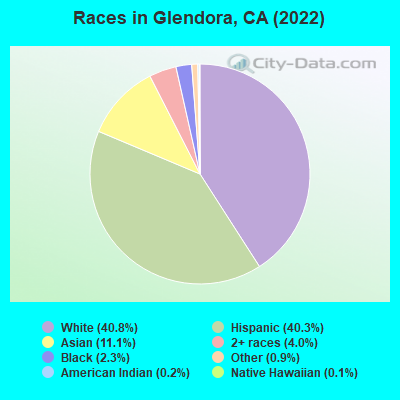
According to 2022 data, the most numerous races in Glendora, CA are Hispanic (18,107 residents), White alone (23,118 residents), and Asian alone (6,136 residents). 69.7% of Glendora residents speak English at home. 19.7% of Glendora, CA residents are foreign-born (9.8% born in Asia, 7.1% born in Latin America), which is 31.7% less than the foreign-born rate of 26.0% across the entire state of California.
Race distribution in Glendora
2000 2022
15,816,790 46.7% White alone 10,966,556 32.4% Hispanic 3,648,860 10.8% Asian alone 2,181,926 6.4% Black alone 903,115 2.7% Two or more races 178,984 0.5% American Indian alone 103,736 0.3% Native Hawaiian and Other 71,681 0.2% Other race alone
15,732,184 40.3% Hispanic 13,160,426 33.7% White alone 5,957,867 15.3% Asian alone 2,025,218 5.2% Black alone 1,663,222 4.3% Two or more races 251,618 0.6% Other race alone 135,777 0.3% Native Hawaiian and Other 103,030 0.3% American Indian alone
Income and house value in Glendora Median household income in 2022 $120,675 White non-Hispanic householders$136,459 Black householders$131,830 American Indian and Alaska Native householders$144,905 Asian householders$157,108 Native Hawaiian and other Pacific Islander householders$135,384 Some other race householders$87,834 Two or more races householders$128,958 Hispanic or Latino race householdersMedian 2022 house value $838,635 White Non-Hispanic householders$704,742 Black or African American householders$624,837 American Indian or Alaska Native householders $763,770 Asian householders$584,885 Native Hawaiian and other Pacific Islander householders$686,025 Some other race householders$700,423 Two or more races householders$709,421 Hispanic or Latino householders
Median age by race in Glendora
46.6 Median age for White residents45.2 47.5 45.8 Median age for Black or African American residents54.5 41.6 30.5 Median age for American Indian / Alaska Native residents37.8 28.2 43.4 Median age for Asian residents40.2 44.6 20.0 Median age for Native Hawaiian / Pacific Islander residents9.6 54.0 36.5 Median age for Other race residents33.6 38.0 30.3 Median age for Two or more races residents25.3 32.4 49.4 Median age for White alone residents47.5 51.0 33.4 Median age for Hispanic or Latino residents32.1 35.4
Owner/renter occupied households by race in Glendora
House owners and renters - White residents 8,046 71.2% Owner occupied3,252 28.8% Renter occupiedHouse owners and renters - Black or African American residents 99 31.1% Owner occupied219 68.9% Renter occupiedHouse owners and renters - American Indian / Alaska Native residents 29 30.1% Owner occupied67 69.9% Renter occupiedHouse owners and renters - Asian residents 1,557 78.5% Owner occupied426 21.5% Renter occupiedHouse owners and renters - Native Hawaiian / Pacific Islander residents 50 70.1% Owner occupied21 29.9% Renter occupiedHouse owners and renters - Other race residents 778 65.3% Owner occupied413 34.7% Renter occupiedHouse owners and renters - Two or more races residents 1,621 59.4% Owner occupied1,108 40.6% Renter occupiedHouse owners and renters - White alone residents 6,585 72.3% Owner occupied2,526 27.7% Renter occupiedHouse owners and renters - Hispanic or Latino residents 3,152 63.6% Owner occupied1,807 36.4% Renter occupied
Language usage in Glendora
English speakers - Total 69.7% of residents of Glendora speak English at home.
16.2% of residents speak Spanish at home 5,678 71.6% Speak English very well2,248 28.4% Speak English less than very well14.5% of residents speak other language at home 4,462 62.8% Speak English very well2,638 37.2% Speak English less than very well
English speakers - Born in the United States 90.6% of residents of Glendora speak English at home.
6.3% of residents speak Spanish at home 374 86.6% Speak English very well58 13.4% Speak English less than very well3.0% of residents speak other language at home 132 64.7% Speak English very well72 35.3% Speak English less than very well
English speakers - Native, born elsewhere 55.7% of residents of Glendora speak English at home.
15.8% of residents speak Spanish at home 74 80.4% Speak English very well18 19.6% Speak English less than very well27.8% of residents speak other language at home 120 74.1% Speak English very well42 25.9% Speak English less than very well
English speakers - Foreign-born 16.0% of residents of Glendora speak English at home.
31.5% of residents speak Spanish at home 1,384 44.5% Speak English very well1,725 55.5% Speak English less than very well53.9% of residents speak other language at home 2,991 56.1% Speak English very well2,336 43.9% Speak English less than very well
White (Caucasian) - Speak only English Native:
91.4% (23,417)Foreign-born:
21.1% (678)
White (Caucasian) - Speak another language Native:
9.7% (2,490)Foreign-born:
79.6% (2,559)
Black or African American - Speak only English Native:
95.1% (721)Foreign-born:
28.6% (49)
Black or African American - Speak another language Native:
4.7% (36)Foreign-born:
72.9% (124)
American Indian / Alaska Native - Speak only English Native:
73.1% (250)Foreign-born:
100.0% (23)
Asian - Speak only English Native:
68.1% (1,557)Foreign-born:
13.1% (477)
Asian - Speak another language Native:
32.6% (745)Foreign-born:
87.2% (3,187)
Native Hawaiian / Pacific Islander - Speak only English Native:
100.0% (86)Foreign-born:
14.2% (3)
Other race - Speak only English Native:
60.0% (2,204)Foreign-born:
26.2% (225)
Other race - Speak another language Native:
44.3% (1,625)Foreign-born:
79.3% (684)
Two or more races - Speak only English Native:
62.3% (4,443)Foreign-born:
1.7% (50)
Two or more races - Speak another language Native:
40.7% (2,899)Foreign-born:
100.0% (3,037)
White alone - Speak only English Native:
94.8% (18,850)Foreign-born:
24.6% (567)
White alone - Speak another language Native:
5.2% (1,031)Foreign-born:
75.5% (1,739)
Hispanic or Latino - Speak only English Native:
69.1% (9,603)Foreign-born:
11.4% (383)
Hispanic or Latino - Speak another language Native:
33.4% (4,644)Foreign-born:
89.9% (3,030)
Foreign-born residents in Glendora 10,202 residents are foreign born (9.8% Asia , 7.1% Latin America ).
This city:
19.7%California:
100.0%
Marital status for residents in Glendora Marital status - White (Caucasian) population 15 years and over
Males 33.1% Never married54.6% Now married1.0% Separated2.2% Widowed9.1% DivorcedFemales 27.6% Never married49.7% Now married1.5% Separated8.7% Widowed12.5% DivorcedWomen who gave birth in the past 12 months Now married:
74.0% (189)Unmarried:
26.0% (66)
Women who did not give birth in the past 12 months Now married:
44.1% (2,631)Unmarried:
55.9% (3,330)
Marital status - Black or African American population 15 years and over
Males 35.7% Never married51.6% Now married3.6% Separated1.7% Widowed7.4% DivorcedFemales 44.8% Never married43.1% Now married1.2% Separated7.9% Widowed3.0% DivorcedWomen who gave birth in the past 12 months Now married:
0.0% (0)Unmarried:
100.0% (6)
Women who did not give birth in the past 12 months Now married:
41.0% (102)Unmarried:
59.0% (146)
Marital status - American Indian / Alaska Native population 15 years and over
Males 51.8% Never married45.5% Now married0.0% Separated0.0% Widowed2.7% DivorcedFemales 60.5% Never married26.6% Now married12.9% Separated0.0% Widowed0.0% DivorcedWomen who gave birth in the past 12 months Now married:
0.0% (0)Unmarried:
100.0% (7)
Women who did not give birth in the past 12 months Now married:
35.9% (48)Unmarried:
64.1% (86)
Marital status - Asian population 15 years and over
Males 30.7% Never married63.3% Now married0.8% Separated1.4% Widowed3.7% DivorcedFemales 20.7% Never married59.9% Now married1.8% Separated9.4% Widowed8.3% DivorcedWomen who gave birth in the past 12 months Now married:
76.9% (40)Unmarried:
23.1% (12)
Women who did not give birth in the past 12 months Now married:
61.9% (895)Unmarried:
38.1% (551)
Marital status - Native Hawaiian / Pacific Islander population 15 years and over
Males 56.5% Never married43.5% Now married0.0% Separated0.0% Widowed0.0% DivorcedFemales 0.0% Never married70.0% Now married0.0% Separated0.0% Widowed30.0% DivorcedWomen who did not give birth in the past 12 months Now married:
100.0% (23)Unmarried:
0.0% (0)
Marital status - Other race population 15 years and over
Males 37.6% Never married53.2% Now married0.0% Separated3.6% Widowed5.6% DivorcedFemales 35.0% Never married42.5% Now married1.5% Separated4.4% Widowed16.6% DivorcedWomen who gave birth in the past 12 months Now married:
29.9% (25)Unmarried:
70.1% (58)
Women who did not give birth in the past 12 months Now married:
42.3% (549)Unmarried:
57.7% (750)
Marital status - Two or more races population 15 years and over
Males 47.4% Never married43.5% Now married1.3% Separated0.8% Widowed7.1% DivorcedFemales 39.5% Never married43.6% Now married0.0% Separated9.2% Widowed7.7% DivorcedWomen who gave birth in the past 12 months Now married:
17.1% (18)Unmarried:
82.9% (85)
Women who did not give birth in the past 12 months Now married:
37.7% (829)Unmarried:
62.3% (1,371)
Marital status - White alone, not Hispanic / Latino population 15 years and over
Males 28.6% Never married59.6% Now married1.0% Separated2.5% Widowed8.3% DivorcedFemales 23.4% Never married53.2% Now married1.1% Separated9.9% Widowed12.4% DivorcedWomen who gave birth in the past 12 months Now married:
95.0% (171)Unmarried:
5.0% (9)
Women who did not give birth in the past 12 months Now married:
48.5% (1,963)Unmarried:
51.5% (2,085)
Marital status - Hispanic or Latino population 15 years and over
Males 43.3% Never married45.3% Now married0.8% Separated1.8% Widowed8.9% DivorcedFemales 36.6% Never married42.9% Now married2.1% Separated5.3% Widowed13.2% DivorcedWomen who gave birth in the past 12 months Now married:
33.5% (82)Unmarried:
66.5% (163)
Women who did not give birth in the past 12 months Now married:
39.9% (1,873)Unmarried:
60.1% (2,823)
Ancestries in Glendora
1,006 3.6% English982 3.5% Italian961 3.4% German931 3.3% American875 3.1% Irish685 2.5% European679 2.4% Syrian616 2.2% Egyptian273 1.0% Eastern European262 0.9% Armenian175 0.6% Northern European173 0.6% British172 0.6% Scottish156 0.6% Lebanese150 0.5% Dutch148 0.5% African112 0.4% Norwegian104 0.4% Polish103 0.4% Danish92 0.3% Scotch-Irish88 0.3% Arab80 0.3% Iranian77 0.3% Swedish55 0.2% Russian48 0.2% French Canadian47 0.2% French42 0.2% Nigerian41 0.1% Ukrainian37 0.1% Greek36 0.1% Swiss34 0.1% Romanian33 0.1% Basque28 0.1% Welsh27 0.10% Jordanian26 0.09% Portuguese25 0.09% Canadian24 0.09% Palestinian24 0.09% Assyrian24 0.09% Czech20 0.07% Turkish19 0.07% Jamaican14 0.05% Slovak13 0.05% Hungarian13 0.05% Finnish11 0.04% Czechoslovakian10 0.04% Maltese10 0.04% Israeli10 0.04% Scandinavian10 0.04% Croatian9 0.03% Lithuanian9 0.03% Austrian8 0.03% Belgian8 0.03% Bahamian7 0.03% Slavic7 0.03% Serbian6 0.02% Ethiopian5 0.02% Slovene4 0.01% Yugoslavian
Geographical mobility in Glendora Same house 1 year ago 26,590 89.8% White (Caucasian)762 83.1% Black or African American326 77.7% American Indian / Alaska Native5,665 91.8% Asian125 94.6% Native Hawaiian / Pacific Islander3,865 84.2% Other race9,445 92.9% Two or more races21,232 91.0% White alone, not Hispanic / Latino15,566 86.7% Hispanic or LatinoMoved within same county 2,211 7.5% White / Caucasian126 13.8% Black or African American77 18.3% American Indian / Alaska Native431 7.0% Asian5 3.5% Native Hawaiian / Pacific Islander434 9.5% Other race583 5.7% Two or more races1,545 6.6% White alone, not Hispanic / Latino1,699 9.5% Hispanic or LatinoMoved within same state 433 1.5% White / Caucasian30 0.5% Asian160 3.5% Other race115 1.1% Two or more races319 1.4% White alone, not Hispanic / Latino470 2.6% Hispanic or LatinoMoved from different state 277 0.9% White / Caucasian20 2.1% Black or African American43 0.7% Asian149 1.5% Two or more races259 1.1% White alone, not Hispanic / Latino63 0.4% Hispanic or LatinoMoved from abroad 48 0.2% White33 0.5% Asian2 1.7% Native Hawaiian / Pacific Islander13 0.3% Other race41 0.2% White alone, not Hispanic / Latino35 0.2% Hispanic or Latino
Children Nativity (place of birth) in Glendora
Children under 6 years - Living with two parents Both parents native 1,640 100.0% Native1 0.0% Foreign-bornBoth parents foreign-born 305 80.5% Native74 19.5% Foreign-bornOne native, one foreign-born parent 380 100.0% NativeChildren under 6 years - Living with one parent Native parent 688 98.6% Native10 1.4% Foreign-bornForeign-born parent 80 79.9% Native20 20.1% Foreign-bornChildren 6 to 17 years - Living with two parents Both parents native 3,858 100.0% NativeBoth parents foreign-born 750 69.1% Native336 30.9% Foreign-bornOne native, one foreign-born parent 687 100.0% NativeChildren 6 to 17 years - Living with one parent Native parent 1,450 100.0% NativeForeign-born parent 386 53.9% Native330 46.1% Foreign-born
Place of birth for residents in Glendora 5,129 Asia3,891 Americas3,720 Latin America3,221 Central America1,699 Eastern Asia1,486 South Eastern Asia1,482 China1,064 Western Asia851 South Central Asia616 Africa531 Europe489 Northern Africa398 South America182 Western Europe179 Eastern Europe171 Northern America100 Caribbean90 Northern Europe84 Eastern Africa69 Southern Europe34 Western Africa33 Oceania9 Australia and New Zealand Subregion6 Southern Africa2,192 Mexico1,003 Philippines813 El Salvador805 China679 Syria620 India498 Taiwan485 Egypt201 Vietnam179 Hong Kong171 Canada162 Lebanon153 Iran145 Korea125 Peru123 Germany108 Indonesia100 Colombia95 Guatemala92 Malaysia71 Cuba67 Jordan63 Turkey60 Chile56 Argentina56 Japan54 Costa Rica48 England48 Nicaragua47 Thailand44 Iraq41 Kenya38 Pakistan38 Poland38 Brazil35 Netherlands34 Nigeria30 Italy29 Scotland28 Uganda28 Russia27 Romania27 Israel26 Hungary23 Switzerland22 Nepal18 Singapore17 Serbia17 Honduras16 Jamaica16 Sri Lanka16 Bolivia15 Burma13 Spain12 Lithuania11 Kuwait11 Czechoslovakia9 Azores Islands9 Croatia9 Belarus9 Australia9 Portugal8 Armenia6 South Africa6 Dominican Republic6 Haiti6 Sweden2 Micronesia
Grandparents responsible for own grandchildren in Glendora
Grandparents (30 to 59 years) White / Caucasian 41 23.3% Responsible for grandchildren134 76.7% Not responsible for grandchildrenAsian 40 100.0% Not responsible for grandchildrenOther race 45 100.0% Not responsible for grandchildrenTwo or more races 179 100.0% Not responsible for grandchildrenWhite alone, not Hispanic / Latino 10 8.6% Responsible for grandchildren104 91.4% Not responsible for grandchildrenHispanic or Latino 51 38.8% Responsible for grandchildren81 61.2% Not responsible for grandchildrenGrandparents (60 years and over) White / Caucasian 119 22.4% Responsible for grandchildren413 77.6% Not responsible for grandchildrenAsian 2 2.0% Responsible for grandchildren116 98.0% Not responsible for grandchildrenOther race 17 14.9% Responsible for grandchildren98 85.1% Not responsible for grandchildrenTwo or more races 41 100.0% Not responsible for grandchildrenWhite alone, not Hispanic / Latino 119 25.0% Responsible for grandchildren357 75.0% Not responsible for grandchildrenHispanic or Latino 45 13.6% Responsible for grandchildren283 86.4% Not responsible for grandchildren