Races in Glocester, Rhode Island (RI) Detailed Stats
Ancestries, Foreign-born residents, place of birth
1.6% of Glocester, RI residents are foreign-born , which is 759.7% less than the foreign-born rate of 14.0% across the entire state of Rhode Island.
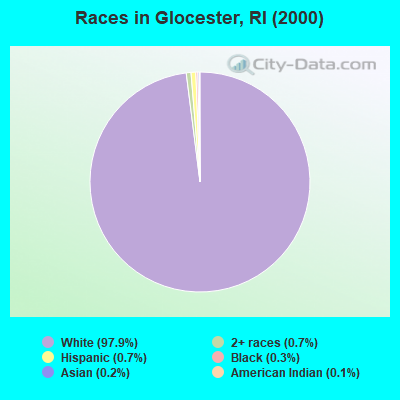
Race distribution in Glocester

- 9,74497.9%White alone
- 650.7%Hispanic
- 670.7%Two or more races
- 330.3%Black alone
- 240.2%Asian alone
- 110.1%American Indian alone
- 40.04%Other race alone
2000
2022
-
- 858,43381.9%White alone
- 90,8208.7%Hispanic
- 41,9224.0%Black alone
- 23,4162.2%Asian alone
- 20,8162.0%Two or more races
- 8,4110.8%Other race alone
- 4,1810.4%American Indian alone
- 3200.03%Native Hawaiian and Other
Pacific Islander alone

-
- 745,82568.2%White alone
- 191,97917.6%Hispanic
- 56,7385.2%Two or more races
- 51,3264.7%Black alone
- 37,2343.4%Asian alone
- 9,5140.9%Other race alone
- 9780.09%American Indian alone
- 1400.01%Native Hawaiian and Other
Pacific Islander alone

Income and house value in Glocester
- Median household income in 2022
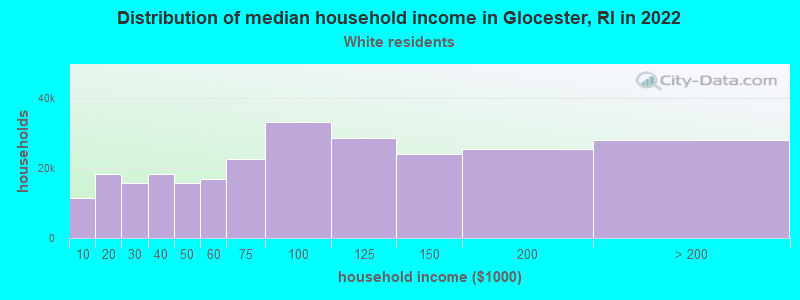
- $114,580White non-Hispanic householders
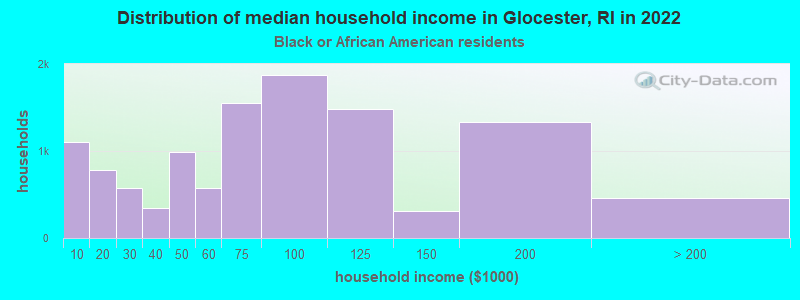
- $49,091Black householders
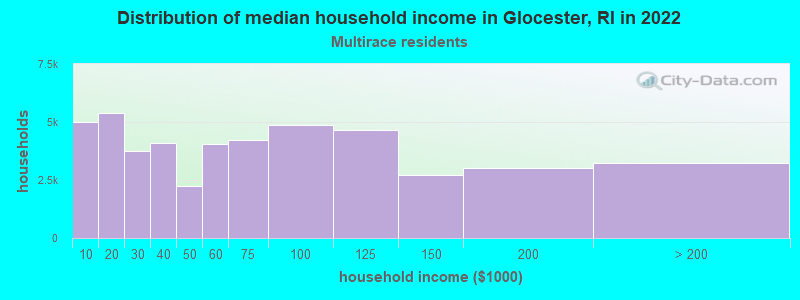
- $85,692Two or more races householders
- Median 2022 house value
- $435,318White Non-Hispanic householders
- $432,365Two or more races householders
Household income for White non-Hispanic householders
Household income for Black householders
Household income for Two or more races householders
Foreign-born residents in Glocester
162 residents are foreign born
| This city: | 1.6% |
| Rhode Island: | 11.4% |
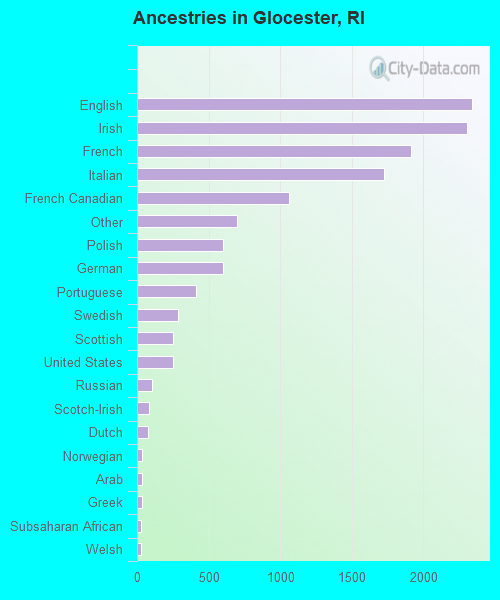
Ancestries in Glocester

- 2,34218.1%English
- 2,30817.8%Irish
- 1,91214.8%French
- 1,72513.3%Italian
- 1,0658.2%French Canadian
- 7025.4%Other
- 6034.7%Polish
- 6004.6%German
- 4123.2%Portuguese
- 2842.2%Swedish
- 2542.0%Scottish
- 2532.0%United States
- 1040.8%Russian
- 860.7%Scotch-Irish
- 760.6%Dutch
- 370.3%Norwegian
- 350.3%Arab
- 350.3%Greek
- 310.2%Subsaharan African
- 260.2%Welsh
- 210.2%Czech
- 180.1%Ukrainian
- 140.1%Danish
- 90.07%Hungarian
- 90.07%Lithuanian
Zip codes: 02814.