Races in Gloversville, New York (NY) Detailed Stats
Ancestries, Foreign-born residents, place of birth
Settings
X


Recent posts about races in Gloversville, New York on our local forum with over 2,400,000 registered users:
 | Gloversville (20 replies) |
| smaller Upstate NY cities and towns/African American communities (5949 replies) |
| What are Good Italians Communnities in Upstate NY? (161 replies) |
| Buyer’s Regret in North Country? (29 replies) |
| opinions on Nathan Littauer Hospital (4 replies) |
| Characterize the 62 counties of New York (13 replies) |
Latest news about races in Gloversville, NY collected exclusively by city-data.com from local newspapers, TV, and radio stations
According to 2022 data, the most numerous races in Gloversville, NY are White alone (12,377 residents), Hispanic (785 residents), and Black alone (213 residents). 96.9% of Gloversville residents speak English at home. 1.9% of Gloversville, NY residents are foreign-born , which is 1032.2% less than the foreign-born rate of 22.0% across the entire state of New York.
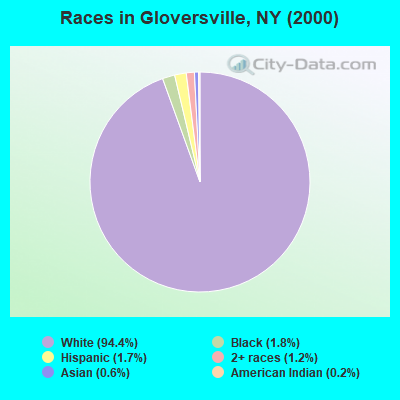
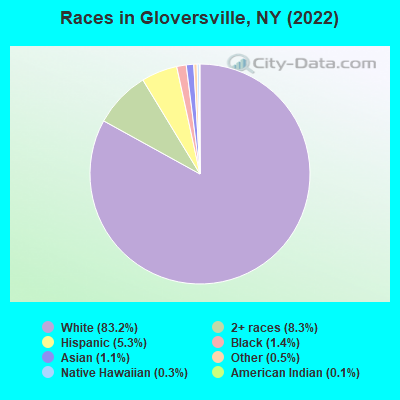
Race distribution in Gloversville
2000
2022

- 14,55794.4%White alone
- 2751.8%Black alone
- 2581.7%Hispanic
- 1851.2%Two or more races
- 920.6%Asian alone
- 280.2%American Indian alone
- 150.10%Other race alone
- 30.02%Native Hawaiian and Other
Pacific Islander alone
-
- 12,37783.2%White alone
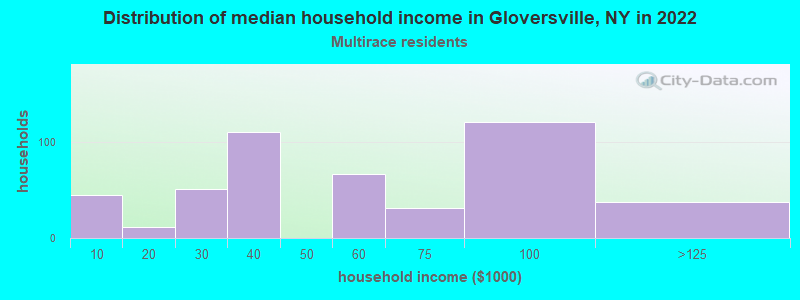
- 1,2288.3%Two or more races
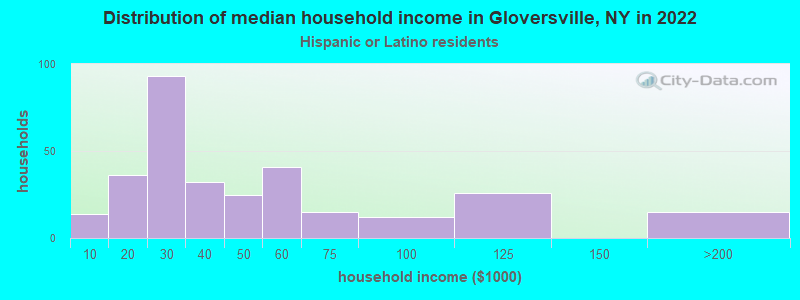
- 7855.3%Hispanic
- 2131.4%Black alone
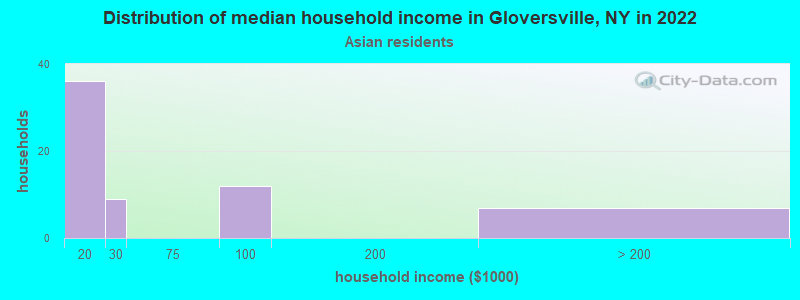
- 1661.1%Asian alone
- 690.5%Other race alone
- 460.3%Native Hawaiian and Other
Pacific Islander alone - 180.1%American Indian alone
2000
2022
-
- 11,760,98162.0%White alone
- 2,867,58315.1%Hispanic
- 2,812,62314.8%Black alone
- 1,035,9265.5%Asian alone
- 366,1161.9%Two or more races
- 75,4990.4%Other race alone
- 52,4990.3%American Indian alone
- 5,2300.03%Native Hawaiian and Other
Pacific Islander alone

-
- 10,408,93352.9%White alone
- 3,867,29919.7%Hispanic
- 2,633,84013.4%Black alone
- 1,776,2869.0%Asian alone
- 732,6703.7%Two or more races
- 216,1101.1%Other race alone
- 35,0820.2%American Indian alone
- 6,9310.04%Native Hawaiian and Other
Pacific Islander alone

Income and house value in Gloversville
- Median household income in 2022
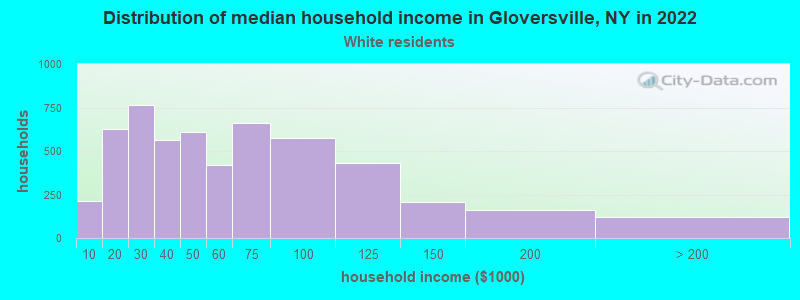
- $46,663White non-Hispanic householders
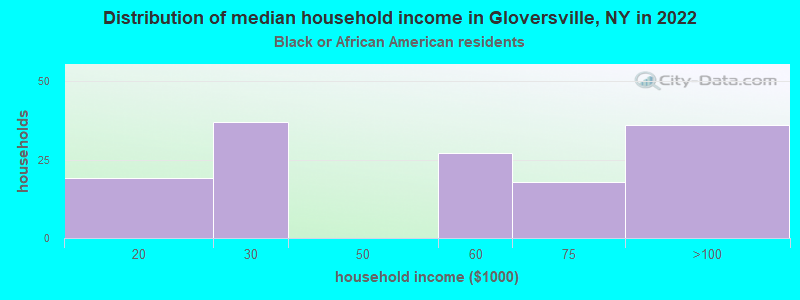
- $55,118Black householders
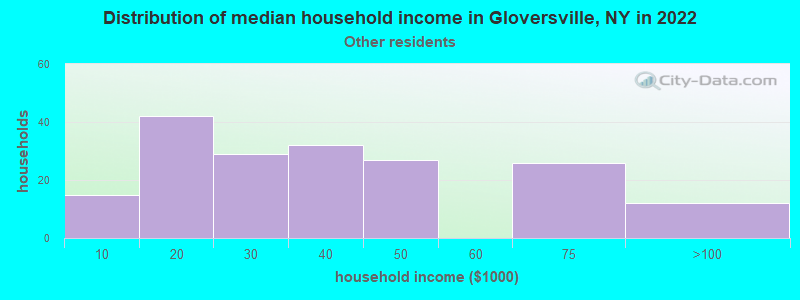
- $30,764Some other race householders
- $54,996Two or more races householders
- $30,249Hispanic or Latino race householders
- Median 2022 house value
- $94,717White Non-Hispanic householders
- $64,379Black or African American householders
- $114,648American Indian or Alaska Native householders
- $61,028Asian householders
- $97,010Hispanic or Latino householders
Household income for White non-Hispanic householders
Household income for Black householders
Household income for Asian householders
Household income for Some other race householders
Household income for Two or more races householders
Household income for Hispanic or Latino race householders
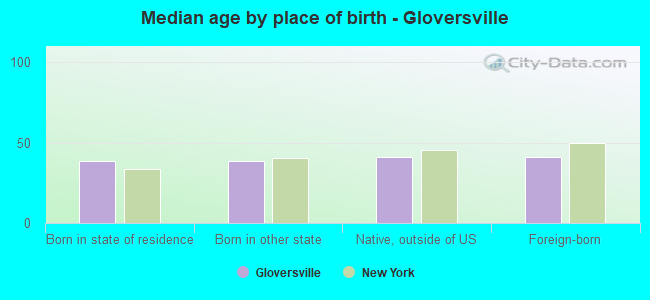
Median age by race in Gloversville
- 42.9Median age for White residents
- 38.8Males
- 45.3Females
- 46.2Median age for Black or African American residents
- 45.8Males
- 62.6Females
- -676,300,577.4Median age for American Indian / Alaska Native residents
- -707,843,136.5Males
- -642,115,202.4Females
- 33.1Median age for Asian residents
- 33.6Males
- 31.5Females
- -487,992,314.6Median age for Native Hawaiian / Pacific Islander residents
- -477,502,295.2Males
- -497,387,669.3Females
- 26.6Median age for Other race residents
- 25.3Males
- 36.0Females
- 23.1Median age for Two or more races residents
- 13.5Males
- 26.5Females
- 43.2Median age for White alone residents
- 38.5Males
- 45.2Females
- 24.9Median age for Hispanic or Latino residents
- 25.5Males
- 24.7Females
Owner/renter occupied households by race in Gloversville
- House owners and renters - White residents
- 2,64349.6%Owner occupied
- 2,68950.4%Renter occupied
- House owners and renters - Black or African American residents
- 4734.0%Owner occupied
- 9166.0%Renter occupied
- House owners and renters - Asian residents
- 1321.7%Owner occupied
- 4778.3%Renter occupied
- House owners and renters - Other race residents
- 6332.5%Owner occupied
- 13167.5%Renter occupied
- House owners and renters - Two or more races residents
- 17136.7%Owner occupied
- 29563.3%Renter occupied
- House owners and renters - White alone residents
- 2,66248.4%Owner occupied
- 2,84251.6%Renter occupied
- House owners and renters - Hispanic or Latino residents
- 7924.8%Owner occupied
- 23975.2%Renter occupied
Language usage in Gloversville
- English speakers - Total
- 96.9% of residents of Gloversville speak English at home.
- 1.7% of residents speak Spanish at home
- 12552.5%Speak English very well
- 11347.5%Speak English less than very well
- 1.3% of residents speak other language at home
- 8950.3%Speak English very well
- 8849.7%Speak English less than very well
- English speakers - Born in the United States
- 98.3% of residents of Gloversville speak English at home.
- 1.6% of residents speak Spanish at home
- 25100.0%Speak English very well
- English speakers - Native, born elsewhere
- 83.8% of residents of Gloversville speak English at home.
- 18.9% of residents speak Spanish at home
- 14100.0%Speak English very well
- English speakers - Foreign-born
- 26.5% of residents of Gloversville speak English at home.
- 18.3% of residents speak Spanish at home
- 42100.0%Speak English less than very well
- 54.3% of residents speak other language at home
- 3931.2%Speak English very well
- 8668.8%Speak English less than very well
White (Caucasian) - Speak only English
| Native: | 100.0% (11,470) |
| Foreign-born: | 69.3% (27) |
White (Caucasian) - Speak another language
| Native: | 0.5% (61) |
| Foreign-born: | 38.2% (15) |
Black or African American - Speak only English
| Native: | 100.0% (229) |
| Foreign-born: | 30.0% (4) |
Other race - Speak another language
| Native: | 44.6% (152) |
| Foreign-born: | 99.8% (46) |
Two or more races - Speak only English
| Native: | 95.4% (1,555) |
| Foreign-born: | 94.3% (40) |
White alone - Speak only English
| Native: | 99.5% (11,629) |
| Foreign-born: | 60.7% (28) |
White alone - Speak another language
| Native: | 0.6% (69) |
| Foreign-born: | 39.8% (19) |
Hispanic or Latino - Speak another language
| Native: | 25.1% (173) |
| Foreign-born: | 99.6% (42) |
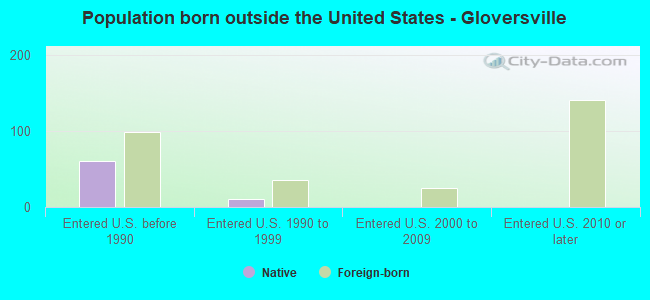
Foreign-born residents in Gloversville
289 residents are foreign born
| This city: | 1.9% |
| New York: | 22.6% |

Marital status for residents in Gloversville
Marital status - White (Caucasian) population 15 years and over
- Males
- 41.9%Never married
- 35.5%Now married
- 3.5%Separated
- 3.1%Widowed
- 15.9%Divorced
- Females
- 31.6%Never married
- 37.3%Now married
- 3.3%Separated
- 10.1%Widowed
- 17.7%Divorced
Women who gave birth in the past 12 months
| Now married: | 49.3% (98) |
| Unmarried: | 50.7% (101) |
Women who did not give birth in the past 12 months
| Now married: | 41.2% (956) |
| Unmarried: | 58.8% (1,363) |
Marital status - Black or African American population 15 years and over
- Males
- 52.4%Never married
- 36.0%Now married
- 7.9%Separated
- 0.0%Widowed
- 3.7%Divorced
- Females
- 64.2%Never married
- 11.9%Now married
- 0.0%Separated
- 0.0%Widowed
- 23.9%Divorced
Women who did not give birth in the past 12 months
| Now married: | 0.0% (0) |
| Unmarried: | 100.0% (30) |
Marital status - Asian population 15 years and over
- Males
- 9.4%Never married
- 48.4%Now married
- 42.2%Separated
- 0.0%Widowed
- 0.0%Divorced
- Females
- 0.0%Never married
- 100.0%Now married
- 0.0%Separated
- 0.0%Widowed
- 0.0%Divorced
Women who did not give birth in the past 12 months
| Now married: | 100.0% (40) |
| Unmarried: | 0.0% (0) |
Marital status - Other race population 15 years and over
- Males
- 66.1%Never married
- 33.9%Now married
- 0.0%Separated
- 0.0%Widowed
- 0.0%Divorced
- Females
- 68.2%Never married
- 31.8%Now married
- 0.0%Separated
- 0.0%Widowed
- 0.0%Divorced
Women who gave birth in the past 12 months
| Now married: | 0.0% (0) |
| Unmarried: | 100.0% (22) |
Women who did not give birth in the past 12 months
| Now married: | 44.1% (33) |
| Unmarried: | 55.9% (42) |
Marital status - Two or more races population 15 years and over
- Males
- 68.4%Never married
- 26.5%Now married
- 0.0%Separated
- 0.0%Widowed
- 5.2%Divorced
- Females
- 81.6%Never married
- 8.2%Now married
- 0.0%Separated
- 2.9%Widowed
- 7.2%Divorced
Women who gave birth in the past 12 months
| Now married: | 0.0% (0) |
| Unmarried: | 100.0% (26) |
Women who did not give birth in the past 12 months
| Now married: | 9.0% (54) |
| Unmarried: | 91.0% (548) |
Marital status - White alone, not Hispanic / Latino population 15 years and over
- Males
- 41.9%Never married
- 35.3%Now married
- 3.5%Separated
- 3.2%Widowed
- 16.0%Divorced
- Females
- 31.3%Never married
- 37.5%Now married
- 3.3%Separated
- 10.1%Widowed
- 17.7%Divorced
Women who gave birth in the past 12 months
| Now married: | 49.3% (103) |
| Unmarried: | 50.7% (106) |
Women who did not give birth in the past 12 months
| Now married: | 41.6% (1,007) |
| Unmarried: | 58.4% (1,412) |
Marital status - Hispanic or Latino population 15 years and over
- Males
- 55.1%Never married
- 43.0%Now married
- 0.0%Separated
- 0.0%Widowed
- 2.0%Divorced
- Females
- 66.0%Never married
- 26.7%Now married
- 0.0%Separated
- 0.0%Widowed
- 7.3%Divorced
Women who gave birth in the past 12 months
| Now married: | 0.0% (0) |
| Unmarried: | 100.0% (39) |
Women who did not give birth in the past 12 months
| Now married: | 36.0% (63) |
| Unmarried: | 64.0% (111) |
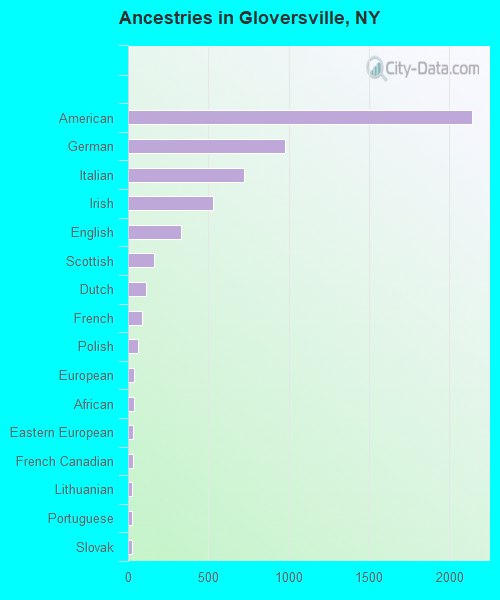
Ancestries in Gloversville

- 2,14033.9%American
- 97715.5%German
- 72511.5%Italian
- 5328.4%Irish
- 3285.2%English
- 1602.5%Scottish
- 1101.7%Dutch
- 851.3%French
- 600.9%Polish
- 390.6%European
- 350.6%African
- 290.5%Eastern European
- 290.5%French Canadian
- 280.4%Lithuanian
- 270.4%Portuguese
- 270.4%Slovak
- 180.3%Czech
- 150.2%Welsh
- 140.2%British West Indian
- 120.2%Scotch-Irish
- 120.2%Trinidadian and Tobagonian
- 80.1%Czechoslovakian
- 70.1%British
- 60.09%Greek
- 50.08%Hungarian
- 30.05%Ukrainian
- 30.05%West Indian
- 20.03%Jamaican
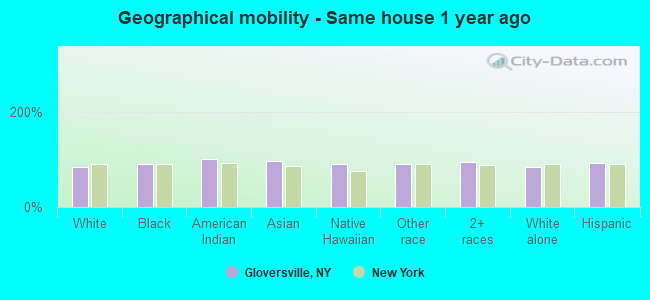
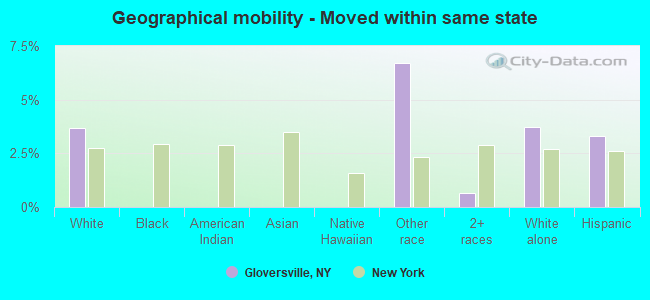
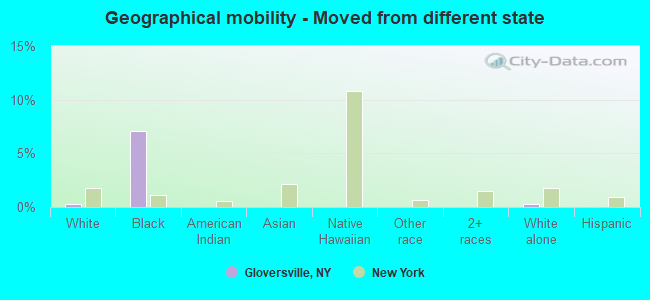
Geographical mobility in Gloversville

- Same house 1 year ago
- 9,84182.9%White (Caucasian)
- 21689.7%Black or African American
- 27100.0%American Indian / Alaska Native
- 15995.5%Asian
- 3389.7%Native Hawaiian / Pacific Islander
- 37990.3%Other race
- 1,61994.0%Two or more races
- 10,14682.7%White alone, not Hispanic / Latino
- 73493.5%Hispanic or Latino
-
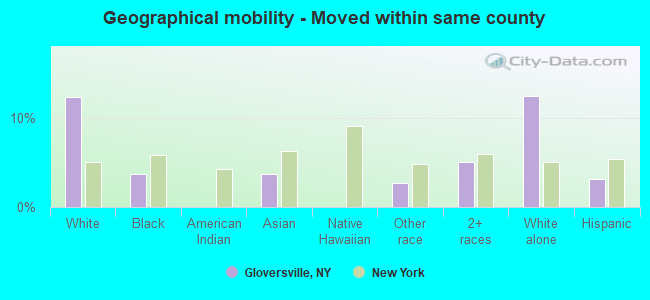
- Moved within same county
- 1,45712.3%White / Caucasian
- 93.7%Black or African American
- 63.7%Asian
- 112.7%Other race
- 875.1%Two or more races
- 1,52312.4%White alone, not Hispanic / Latino
- 243.1%Hispanic or Latino
-
- Moved within same state
- 4383.7%White / Caucasian
- 286.7%Other race
- 110.6%Two or more races
- 4543.7%White alone, not Hispanic / Latino
- 263.3%Hispanic or Latino
-
- Moved from different state
- 370.3%White / Caucasian
- 177.1%Black or African American
- 390.3%White alone, not Hispanic / Latino
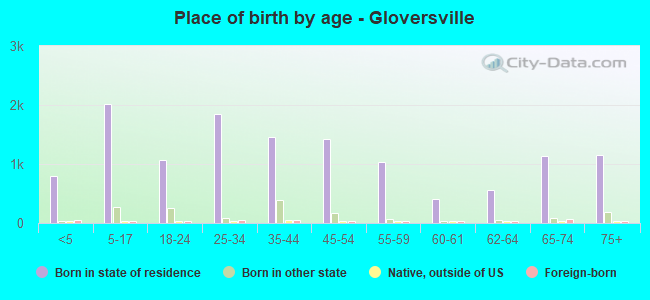
Children Nativity (place of birth) in Gloversville
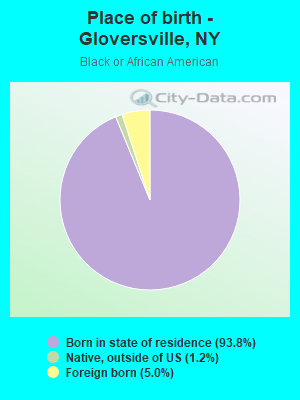
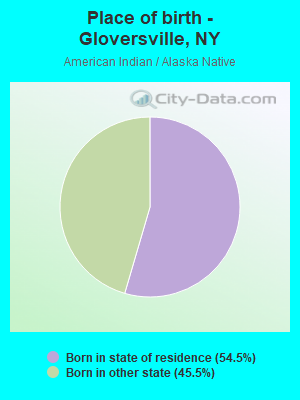
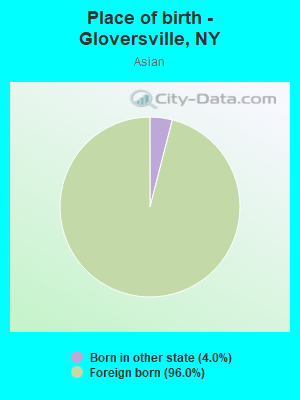
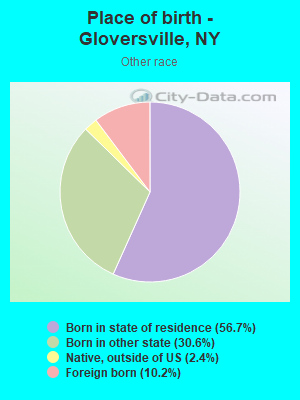
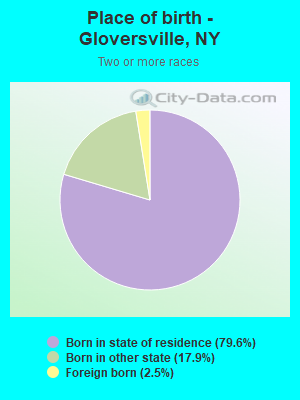
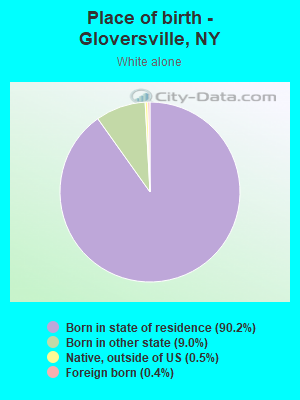
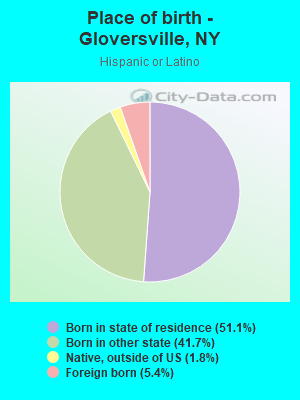
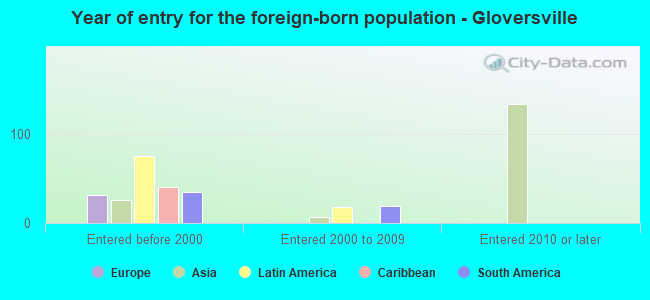
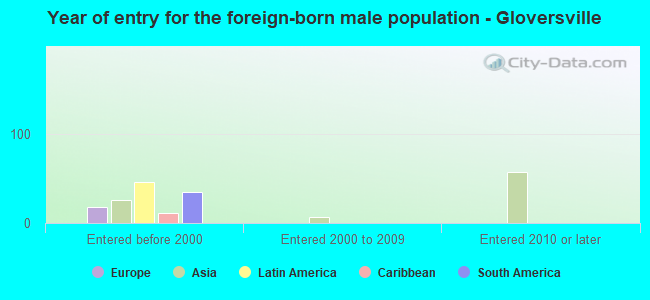
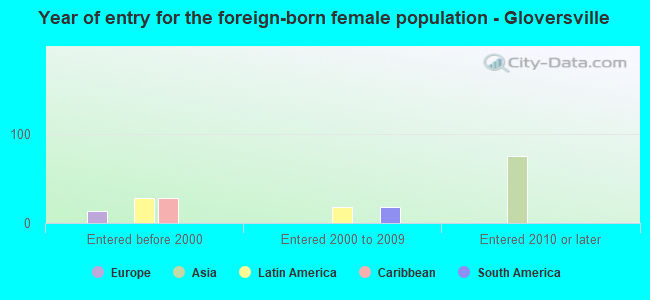
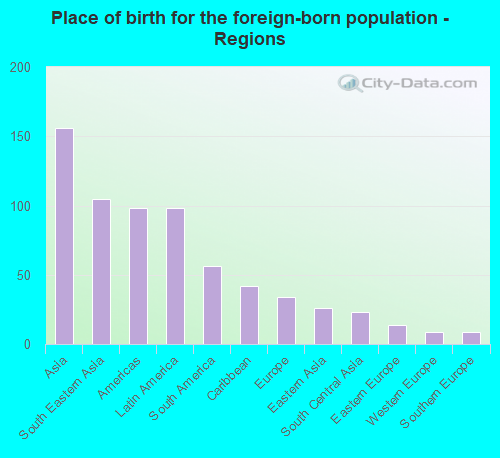
Place of birth for residents in Gloversville
![Place of birth for the foreign-born population - Regions]()
- 156Asia
- 105South Eastern Asia
- 98Americas
- 98Latin America
- 56South America
- 42Caribbean
- 34Europe
- 26Eastern Asia
- 23South Central Asia
- 14Eastern Europe
- 9Western Europe
- 9Southern Europe
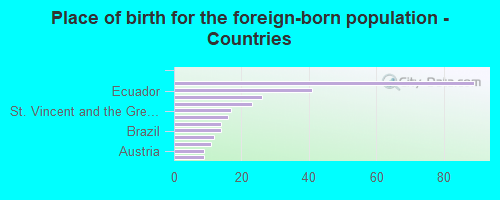
![Place of birth for the foreign-born population - Countries]()
- 89Philippines
- 41Ecuador
- 26Korea
- 23Bangladesh
- 17St. Vincent and the Grenadines
- 16Burma (Myanmar)
- 14Hungary
- 14Brazil
- 12Jamaica
- 11Trinidad and Tobago
- 9Austria
- 9Italy
Grandparents responsible for own grandchildren in Gloversville
Zip codes: 12095.