Races in Grafton, Massachusetts (MA) Detailed Stats
Ancestries, Foreign-born residents, place of birth

Recent posts about races in Grafton, Massachusetts on our local forum with over 2,400,000 registered users:
 | Exploring Grafton to purchase first house (11 replies) |
| Buying a house in Sterling, MA (51 replies) |
| 2024 Real Estate Observations (970 replies) |
| Boston job possibility.. (142 replies) |
| Houses in Bellingham/Hopedale (12 replies) |
| buying a SF house in Grafton (6 replies) |
4.3% of Grafton, MA residents are foreign-born (1.3% born in Europe, 1.3% born in Asia, 1.0% born in North America, 0.5% born in Latin America), which is 315.0% less than the foreign-born rate of 18.0% across the entire state of Massachusetts.
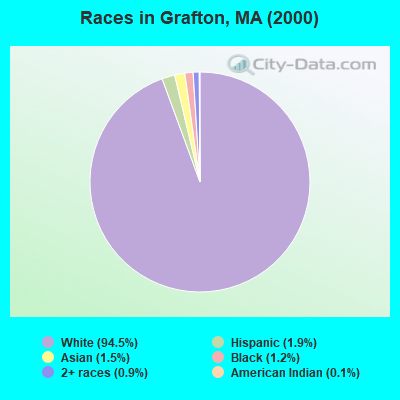
Race distribution in Grafton

- 14,06894.5%White alone
- 2851.9%Hispanic
- 2161.5%Asian alone
- 1771.2%Black alone
- 1280.9%Two or more races
- 170.1%American Indian alone
- 30.02%Other race alone
2000
2022
-
- 5,198,35981.9%White alone
- 428,7296.8%Hispanic
- 318,3295.0%Black alone
- 236,7863.7%Asian alone
- 110,3381.7%Two or more races
- 43,5860.7%Other race alone
- 11,2640.2%American Indian alone
- 1,7060.03%Native Hawaiian and Other
Pacific Islander alone

-
- 4,676,62767.0%White alone
- 911,03813.0%Hispanic
- 501,4637.2%Asian alone
- 459,7406.6%Black alone
- 341,8894.9%Two or more races
- 84,4031.2%Other race alone
- 5,8380.08%American Indian alone
- 9760.01%Native Hawaiian and Other
Pacific Islander alone

Income and house value in Grafton
- Median household income in 2022
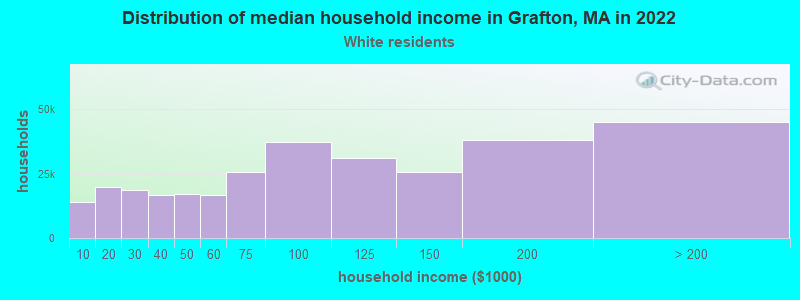
- $104,425White non-Hispanic householders
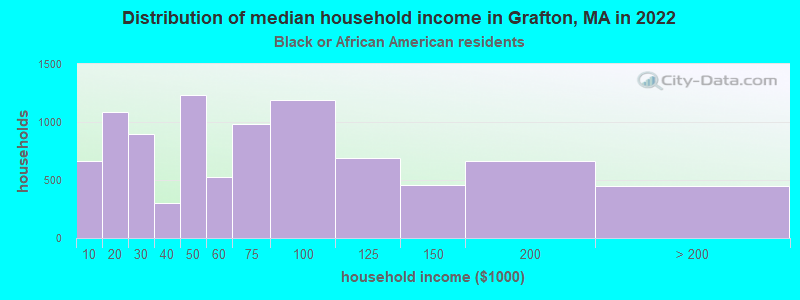
- $35,172Black householders
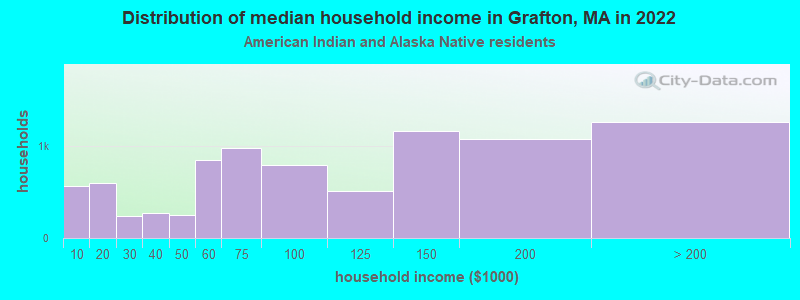
- $151,104American Indian and Alaska Native householders
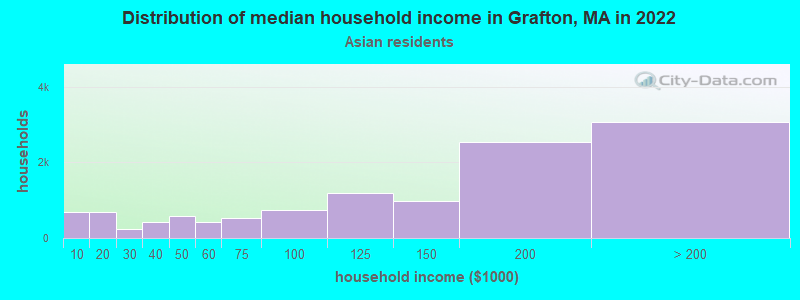
- $109,195Asian householders
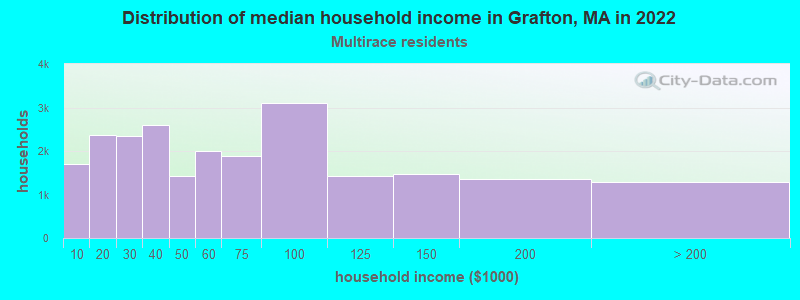
- $45,892Two or more races householders
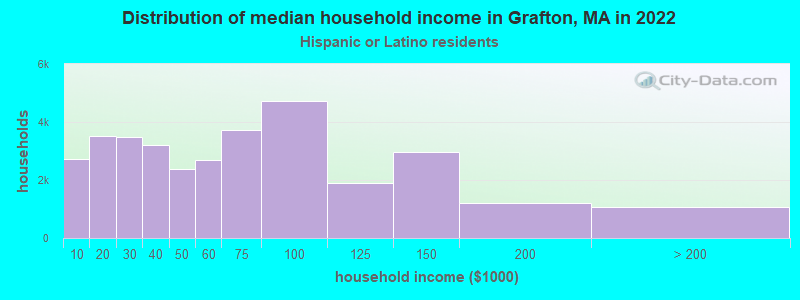
- $53,333Hispanic or Latino race householders
- Median 2022 house value
- $502,053White Non-Hispanic householders
- $966,549Black or African American householders
- $966,549American Indian or Alaska Native householders
- $613,344Asian householders
- $517,794Two or more races householders
- $629,085Hispanic or Latino householders
Household income for White non-Hispanic householders
Household income for Black householders
Household income for American Indian and Alaska Native householders
Household income for Asian householders
Household income for Two or more races householders
Household income for Hispanic or Latino race householders
Foreign-born residents in Grafton
646 residents are foreign born (1.3% Europe, 1.3% Asia, 1.0% North America, 0.5% Latin America).
| This city: | 4.3% |
| Massachusetts: | 12.2% |
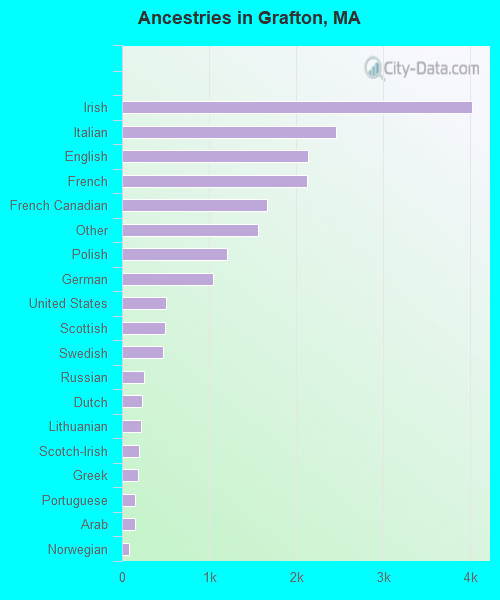
Ancestries in Grafton

- 4,01420.8%Irish
- 2,45912.7%Italian
- 2,14111.1%English
- 2,12911.0%French
- 1,6628.6%French Canadian
- 1,5668.1%Other
- 1,2116.3%Polish
- 1,0455.4%German
- 5112.6%United States
- 4912.5%Scottish
- 4682.4%Swedish
- 2471.3%Russian
- 2351.2%Dutch
- 2171.1%Lithuanian
- 1941.0%Scotch-Irish
- 1891.0%Greek
- 1460.8%Portuguese
- 1440.7%Arab
- 800.4%Norwegian
- 280.1%Welsh
- 260.1%Danish
- 230.1%Subsaharan African
- 200.1%Hungarian
- 160.08%Swiss
- 160.08%Ukrainian
- 120.06%West Indian
- 50.03%Czech
Zip codes: 01536.