Races in Granite City, Illinois (IL) Detailed Stats
Data:
Races - White alone (%)
Races - White alone (% change since 2000)
Races - Black alone (%)
Races - Black alone (% change since 2000)
Races - American Indian alone (%)
Races - American Indian alone (% change since 2000)
Races - Asian alone (%)
Races - Asian alone (% change since 2000)
Races - Hispanic (%)
Races - Hispanic (% change since 2000)
Races - Native Hawaiian and Other Pacific Islander alone (%)
Races - Native Hawaiian and Other Pacific Islander alone (% change since 2000)
Races - Two or more races(%)
Races - Two or more races(% change since 2000)
Races - Other race alone (%)
Races - Other race alone (% change since 2000)
Racial diversity
Place of birth - Born in state of residence (%)
Place of birth - Born in state of residence (%) - White
Place of birth - Born in state of residence (%) - Black or African American
Place of birth - Born in state of residence (%) - Asian
Place of birth - Born in state of residence (%) - Hispanic or Latino
Place of birth - Born in state of residence (%) - American Indian and Alaska Native
Place of birth - Born in state of residence (%) - Multirace
Place of birth - Born in state of residence (%) - Other Race
Place of birth - Born in other state (%)
Place of birth - Born in other state (%) - White
Place of birth - Born in other state (%) - Black or African American
Place of birth - Born in other state (%) - Asian
Place of birth - Born in other state (%) - Hispanic or Latino
Place of birth - Born in other state (%) - American Indian and Alaska Native
Place of birth - Born in other state (%) - Multirace
Place of birth - Born in other state (%) - Other Race
Place of birth - Native, outside of US (%)
Place of birth - Native, outside of US (%) - White
Place of birth - Native, outside of US (%) - Black or African American
Place of birth - Native, outside of US (%) - Asian
Place of birth - Native, outside of US (%) - Hispanic or Latino
Place of birth - Native, outside of US (%) - American Indian and Alaska Native
Place of birth - Native, outside of US (%) - Multirace
Place of birth - Native, outside of US (%) - Other Race
Place of birth - Foreign born (%)
Place of birth - Foreign born (%) - White
Place of birth - Foreign born (%) - Black or African American
Place of birth - Foreign born (%) - Asian
Place of birth - Foreign born (%) - Hispanic or Latino
Place of birth - Foreign born (%) - American Indian and Alaska Native
Place of birth - Foreign born (%) - Multirace
Place of birth - Foreign born (%) - Other Race
Residents speaking English at home (%)
Residents speaking English at home - Born in the United States (%)
Residents speaking English at home - Native, born elsewhere (%)
Residents speaking English at home - Foreign born (%)
Residents speaking Spanish at home (%)
Residents speaking Spanish at home - Born in the United States (%)
Residents speaking Spanish at home - Native, born elsewhere (%)
Residents speaking Spanish at home - Foreign born (%)
Residents speaking other language at home (%)
Residents speaking other language at home - Born in the United States (%)
Residents speaking other language at home - Native, born elsewhere (%)
Residents speaking other language at home - Foreign born (%)
Marital status - Never married (%)
Marital status - Now married (%)
Marital status - Separated (%)
Marital status - Widowed (%)
Marital status - Divorced (%)
Ancestries Reported - Arab (%)
Ancestries Reported - Czech (%)
Ancestries Reported - Danish (%)
Ancestries Reported - Dutch (%)
Ancestries Reported - English (%)
Ancestries Reported - French (%)
Ancestries Reported - French Canadian (%)
Ancestries Reported - German (%)
Ancestries Reported - Greek (%)
Ancestries Reported - Hungarian (%)
Ancestries Reported - Irish (%)
Ancestries Reported - Italian (%)
Ancestries Reported - Lithuanian (%)
Ancestries Reported - Norwegian (%)
Ancestries Reported - Polish (%)
Ancestries Reported - Portuguese (%)
Ancestries Reported - Russian (%)
Ancestries Reported - Scotch-Irish (%)
Ancestries Reported - Scottish (%)
Ancestries Reported - Slovak (%)
Ancestries Reported - Subsaharan African (%)
Ancestries Reported - Swedish (%)
Ancestries Reported - Swiss (%)
Ancestries Reported - Ukrainian (%)
Ancestries Reported - United States (%)
Ancestries Reported - Welsh (%)
Ancestries Reported - West Indian (%)
Ancestries Reported - Other (%)
Geographical mobility - Same house 1 year ago (%)
Geographical mobility - Same house 1 year ago (%) - White
Geographical mobility - Same house 1 year ago (%) - Black or African American
Geographical mobility - Same house 1 year ago (%) - Asian
Geographical mobility - Same house 1 year ago (%) - Hispanic or Latino
Geographical mobility - Same house 1 year ago (%) - American Indian and Alaska Native
Geographical mobility - Same house 1 year ago (%) - Multirace
Geographical mobility - Same house 1 year ago (%) - Other Race
Geographical mobility - Moved within same county (%)
Geographical mobility - Moved within same county (%) - White
Geographical mobility - Moved within same county (%) - Black or African American
Geographical mobility - Moved within same county (%) - Asian
Geographical mobility - Moved within same county (%) - Hispanic or Latino
Geographical mobility - Moved within same county (%) - American Indian and Alaska Native
Geographical mobility - Moved within same county (%) - Multirace
Geographical mobility - Moved within same county (%) - Other Race
Geographical mobility - Moved from different county within same state (%)
Geographical mobility - Moved from different county within same state (%) - White
Geographical mobility - Moved from different county within same state (%) - Black or African American
Geographical mobility - Moved from different county within same state (%) - Asian
Geographical mobility - Moved from different county within same state (%) - Hispanic or Latino
Geographical mobility - Moved from different county within same state (%) - American Indian and Alaska Native
Geographical mobility - Moved from different county within same state (%) - Multirace
Geographical mobility - Moved from different county within same state (%) - Other Race
Geographical mobility - Moved from different state (%)
Geographical mobility - Moved from different state (%) - White
Geographical mobility - Moved from different state (%) - Black or African American
Geographical mobility - Moved from different state (%) - Asian
Geographical mobility - Moved from different state (%) - Hispanic or Latino
Geographical mobility - Moved from different state (%) - American Indian and Alaska Native
Geographical mobility - Moved from different state (%) - Multirace
Geographical mobility - Moved from different state (%) - Other Race
Geographical mobility - Moved from abroad (%)
Geographical mobility - Moved from abroad (%) - White
Geographical mobility - Moved from abroad (%) - Black or African American
Geographical mobility - Moved from abroad (%) - Asian
Geographical mobility - Moved from abroad (%) - Hispanic or Latino
Geographical mobility - Moved from abroad (%) - American Indian and Alaska Native
Geographical mobility - Moved from abroad (%) - Multirace
Geographical mobility - Moved from abroad (%) - Other Race
Place of birth for the foreign-born population - Ireland (%)
Place of birth for the foreign-born population - Denmark (%)
Place of birth for the foreign-born population - Norway (%)
Place of birth for the foreign-born population - Sweden (%)
Place of birth for the foreign-born population - United Kingdom (%)
Place of birth for the foreign-born population - England (%)
Place of birth for the foreign-born population - Scotland (%)
Place of birth for the foreign-born population - Other Northern Europe (%)
Place of birth for the foreign-born population - Austria (%)
Place of birth for the foreign-born population - Belgium (%)
Place of birth for the foreign-born population - France (%)
Place of birth for the foreign-born population - Germany (%)
Place of birth for the foreign-born population - Netherlands (%)
Place of birth for the foreign-born population - Switzerland (%)
Place of birth for the foreign-born population - Other Western Europe (%)
Place of birth for the foreign-born population - Greece (%)
Place of birth for the foreign-born population - Italy (%)
Place of birth for the foreign-born population - Portugal (%)
Place of birth for the foreign-born population - Spain (%)
Place of birth for the foreign-born population - Other Southern Europe (%)
Place of birth for the foreign-born population - Albania (%)
Place of birth for the foreign-born population - Belarus (%)
Place of birth for the foreign-born population - Bosnia and Herzegovina (%)
Place of birth for the foreign-born population - Bulgaria (%)
Place of birth for the foreign-born population - Croatia (%)
Place of birth for the foreign-born population - Czechoslovakia (%)
Place of birth for the foreign-born population - Hungary (%)
Place of birth for the foreign-born population - Latvia (%)
Place of birth for the foreign-born population - Lithuania (%)
Place of birth for the foreign-born population - North Macedonia (Macedonia) (%)
Place of birth for the foreign-born population - Moldova (%)
Place of birth for the foreign-born population - Poland (%)
Place of birth for the foreign-born population - Romania (%)
Place of birth for the foreign-born population - Russia (%)
Place of birth for the foreign-born population - Serbia (%)
Place of birth for the foreign-born population - Ukraine (%)
Place of birth for the foreign-born population - Other Eastern Europe (%)
Place of birth for the foreign-born population - China (%)
Place of birth for the foreign-born population - Hong Kong (%)
Place of birth for the foreign-born population - Taiwan (%)
Place of birth for the foreign-born population - Japan (%)
Place of birth for the foreign-born population - Korea (%)
Place of birth for the foreign-born population - Other Eastern Asia (%)
Place of birth for the foreign-born population - Afghanistan (%)
Place of birth for the foreign-born population - Bangladesh (%)
Place of birth for the foreign-born population - India (%)
Place of birth for the foreign-born population - Iran (%)
Place of birth for the foreign-born population - Kazakhstan (%)
Place of birth for the foreign-born population - Nepal (%)
Place of birth for the foreign-born population - Pakistan (%)
Place of birth for the foreign-born population - Sri Lanka (%)
Place of birth for the foreign-born population - Uzbekistan (%)
Place of birth for the foreign-born population - Other South Central Asia (%)
Place of birth for the foreign-born population - Burma (%)
Place of birth for the foreign-born population - Cambodia (%)
Place of birth for the foreign-born population - Indonesia (%)
Place of birth for the foreign-born population - Laos (%)
Place of birth for the foreign-born population - Malaysia (%)
Place of birth for the foreign-born population - Philippines (%)
Place of birth for the foreign-born population - Singapore (%)
Place of birth for the foreign-born population - Thailand (%)
Place of birth for the foreign-born population - Vietnam (%)
Place of birth for the foreign-born population - Other South Eastern Asia (%)
Place of birth for the foreign-born population - Armenia (%)
Place of birth for the foreign-born population - Iraq (%)
Place of birth for the foreign-born population - Israel (%)
Place of birth for the foreign-born population - Jordan (%)
Place of birth for the foreign-born population - Kuwait (%)
Place of birth for the foreign-born population - Lebanon (%)
Place of birth for the foreign-born population - Saudi Arabia (%)
Place of birth for the foreign-born population - Syria (%)
Place of birth for the foreign-born population - Turkey (%)
Place of birth for the foreign-born population - Yemen (%)
Place of birth for the foreign-born population - Other Western Asia (%)
Place of birth for the foreign-born population - Eritrea (%)
Place of birth for the foreign-born population - Ethiopia (%)
Place of birth for the foreign-born population - Kenya (%)
Place of birth for the foreign-born population - Somalia (%)
Place of birth for the foreign-born population - Uganda (%)
Place of birth for the foreign-born population - Zimbabwe (%)
Place of birth for the foreign-born population - Other Eastern Africa (%)
Place of birth for the foreign-born population - Cameroon (%)
Place of birth for the foreign-born population - Congo (%)
Place of birth for the foreign-born population - Democratic Republic of Congo (Zaire) (%)
Place of birth for the foreign-born population - Other Middle Africa (%)
Place of birth for the foreign-born population - Egypt (%)
Place of birth for the foreign-born population - Morocco (%)
Place of birth for the foreign-born population - Sudan (%)
Place of birth for the foreign-born population - Other Northern Africa (%)
Place of birth for the foreign-born population - South Africa (%)
Place of birth for the foreign-born population - Other Southern Africa (%)
Place of birth for the foreign-born population - Cabo Verde (%)
Place of birth for the foreign-born population - Ghana (%)
Place of birth for the foreign-born population - Liberia (%)
Place of birth for the foreign-born population - Nigeria (%)
Place of birth for the foreign-born population - Senegal (%)
Place of birth for the foreign-born population - Sierra Leone (%)
Place of birth for the foreign-born population - Other Western Africa (%)
Place of birth for the foreign-born population - Australia (%)
Place of birth for the foreign-born population - New Zealand (%)
Place of birth for the foreign-born population - Fiji (%)
Place of birth for the foreign-born population - Micronesia (%)
Place of birth for the foreign-born population - Bahamas (%)
Place of birth for the foreign-born population - Barbados (%)
Place of birth for the foreign-born population - Cuba (%)
Place of birth for the foreign-born population - Dominica (%)
Place of birth for the foreign-born population - Dominican Republic (%)
Place of birth for the foreign-born population - Grenada (%)
Place of birth for the foreign-born population - Haiti (%)
Place of birth for the foreign-born population - Jamaica (%)
Place of birth for the foreign-born population - St. Vincent and the Grenadines (%)
Place of birth for the foreign-born population - Trinidad and Tobago (%)
Place of birth for the foreign-born population - West Indies (%)
Place of birth for the foreign-born population - Other Caribbean (%)
Place of birth for the foreign-born population - Belize (%)
Place of birth for the foreign-born population - Costa Rica (%)
Place of birth for the foreign-born population - El Salvador (%)
Place of birth for the foreign-born population - Guatemala (%)
Place of birth for the foreign-born population - Honduras (%)
Place of birth for the foreign-born population - Mexico (%)
Place of birth for the foreign-born population - Nicaragua (%)
Place of birth for the foreign-born population - Panama (%)
Place of birth for the foreign-born population - Other Central America (%)
Place of birth for the foreign-born population - Argentina (%)
Place of birth for the foreign-born population - Bolivia (%)
Place of birth for the foreign-born population - Brazil (%)
Place of birth for the foreign-born population - Chile (%)
Place of birth for the foreign-born population - Colombia (%)
Place of birth for the foreign-born population - Ecuador (%)
Place of birth for the foreign-born population - Guyana (%)
Place of birth for the foreign-born population - Peru (%)
Place of birth for the foreign-born population - Uruguay (%)
Place of birth for the foreign-born population - Venezuela (%)
Place of birth for the foreign-born population - Other South America (%)
Place of birth for the foreign-born population - Canada (%)
Place of birth for the foreign-born population - Other Northern America (%)
Place of birth for the foreign-born population - Other (%)
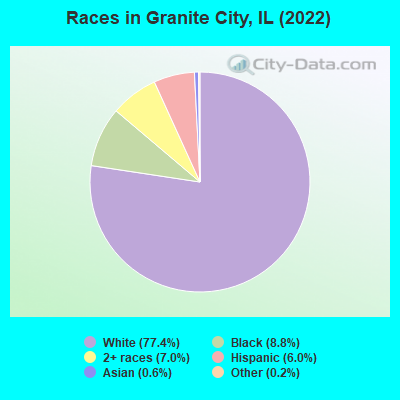
According to 2022 data, the most numerous races in Granite City, IL are White alone (20,791 residents), Hispanic (1,616 residents), and Black alone (2,371 residents). 95.9% of Granite City residents speak English at home. 2.6% of Granite City, IL residents are foreign-born (1.3% born in Latin America, 0.5% born in Europe, 0.4% born in Asia), which is 431.8% less than the foreign-born rate of 14.0% across the entire state of Illinois.
Race distribution in Granite City
2000 2022
8,424,140 67.8% White alone 1,856,152 14.9% Black alone 1,530,262 12.3% Hispanic 419,916 3.4% Asian alone 153,996 1.2% Two or more races 13,479 0.1% Other race alone 18,232 0.1% American Indian alone 3,116 0.03% Native Hawaiian and Other
7,356,301 58.5% White alone 2,299,726 18.3% Hispanic 1,660,423 13.2% Black alone 747,296 5.9% Asian alone 458,599 3.6% Two or more races 45,386 0.4% Other race alone 10,405 0.08% American Indian alone 3,896 0.03% Native Hawaiian and Other
Income and house value in Granite City Median household income in 2022 $58,139 White non-Hispanic householders$25,237 Black householders$39,906 Asian householders$28,258 Some other race householders$47,497 Two or more races householders$39,856 Hispanic or Latino race householdersMedian 2022 house value $104,432 White Non-Hispanic householders$135,980 Black or African American householders$135,980 American Indian or Alaska Native householders $77,599 Asian householders$69,440 Some other race householders$94,823 Two or more races householders$68,352 Hispanic or Latino householders
Median age by race in Granite City
42.9 Median age for White residents40.8 45.5 25.0 Median age for Black or African American residents24.1 27.8 54.3 Median age for American Indian / Alaska Native residents35.1 -741,617,356.3 27.9 Median age for Asian residents18.2 38.3 -593,236,714.4 Median age for Native Hawaiian / Pacific Islander residents-666,666,666.0 -666,666,666.0 49.3 Median age for Other race residents57.4 43.5 22.0 Median age for Two or more races residents14.7 25.4 43.5 Median age for White alone residents41.1 46.0 31.4 Median age for Hispanic or Latino residents38.7 30.9
Owner/renter occupied households by race in Granite City
House owners and renters - White residents 7,096 72.9% Owner occupied2,636 27.1% Renter occupiedHouse owners and renters - Black or African American residents 61 7.6% Owner occupied737 92.4% Renter occupiedHouse owners and renters - American Indian / Alaska Native residents 5 25.8% Owner occupied15 74.2% Renter occupiedHouse owners and renters - Asian residents 130 100.0% Owner occupiedHouse owners and renters - Other race residents 94 71.3% Owner occupied38 28.7% Renter occupiedHouse owners and renters - Two or more races residents 491 70.3% Owner occupied208 29.7% Renter occupiedHouse owners and renters - White alone residents 7,041 72.9% Owner occupied2,621 27.1% Renter occupiedHouse owners and renters - Hispanic or Latino residents 256 65.6% Owner occupied134 34.4% Renter occupied
Language usage in Granite City
English speakers - Total 95.9% of residents of Granite City speak English at home.
2.6% of residents speak Spanish at home 334 50.7% Speak English very well325 49.3% Speak English less than very well1.4% of residents speak other language at home 255 73.5% Speak English very well92 26.5% Speak English less than very well
English speakers - Born in the United States 97.8% of residents of Granite City speak English at home.
1.4% of residents speak Spanish at home 86 87.8% Speak English very well12 12.2% Speak English less than very well0.5% of residents speak other language at home 34 100.0% Speak English less than very well
English speakers - Native, born elsewhere 58.2% of residents of Granite City speak English at home.
12.4% of residents speak Spanish at home 8 38.1% Speak English very well13 61.9% Speak English less than very well14.1% of residents speak other language at home 24 100.0% Speak English very well
English speakers - Foreign-born 20.1% of residents of Granite City speak English at home.
37.2% of residents speak Spanish at home 64 24.4% Speak English very well198 75.6% Speak English less than very well38.2% of residents speak other language at home 203 75.5% Speak English very well66 24.5% Speak English less than very well
White (Caucasian) - Speak only English Native:
98.9% (20,025)Foreign-born:
41.5% (129)
White (Caucasian) - Speak another language Native:
0.9% (189)Foreign-born:
58.6% (183)
Asian - Speak another language Native:
100.0% (37)Foreign-born:
100.0% (118)
Other race - Speak another language Native:
43.2% (104)Foreign-born:
99.9% (166)
Two or more races - Speak only English Native:
88.9% (2,111)Foreign-born:
34.8% (47)
Two or more races - Speak another language Native:
7.3% (173)Foreign-born:
55.2% (75)
White alone - Speak only English Native:
99.6% (19,716)Foreign-born:
55.0% (165)
White alone - Speak another language Native:
0.5% (95)Foreign-born:
35.4% (106)
Hispanic or Latino - Speak only English Native:
78.8% (947)Foreign-born:
7.2% (20)
Hispanic or Latino - Speak another language Native:
19.2% (231)Foreign-born:
93.7% (267)
Foreign-born residents in Granite City 707 residents are foreign born (1.3% Latin America , 0.5% Europe , 0.4% Asia ).
This city:
2.6%Illinois:
14.1%
Marital status for residents in Granite City Marital status - White (Caucasian) population 15 years and over
Males 35.2% Never married42.3% Now married1.4% Separated4.7% Widowed16.4% DivorcedFemales 25.5% Never married44.2% Now married2.9% Separated10.4% Widowed17.1% DivorcedWomen who gave birth in the past 12 months Now married:
53.2% (137)Unmarried:
46.8% (121)
Women who did not give birth in the past 12 months Now married:
44.8% (1,856)Unmarried:
55.2% (2,285)
Marital status - Black or African American population 15 years and over
Males 74.3% Never married22.4% Now married0.0% Separated0.0% Widowed3.2% DivorcedFemales 70.1% Never married19.9% Now married2.1% Separated1.6% Widowed6.3% DivorcedWomen who gave birth in the past 12 months Now married:
0.0% (0)Unmarried:
100.0% (77)
Women who did not give birth in the past 12 months Now married:
23.3% (182)Unmarried:
76.7% (601)
Marital status - American Indian / Alaska Native population 15 years and over
Males 61.1% Never married16.7% Now married0.0% Separated0.0% Widowed22.2% DivorcedFemales 0.0% Never married20.0% Now married0.0% Separated0.0% Widowed80.0% DivorcedMarital status - Asian population 15 years and over
Males 55.6% Never married44.4% Now married0.0% Separated0.0% Widowed0.0% DivorcedFemales 78.1% Never married2.2% Now married4.4% Separated8.8% Widowed6.6% DivorcedWomen who did not give birth in the past 12 months Now married:
0.0% (0)Unmarried:
100.0% (96)
Marital status - Other race population 15 years and over
Males 45.7% Never married43.7% Now married0.0% Separated0.0% Widowed10.7% DivorcedFemales 62.6% Never married24.3% Now married0.0% Separated10.3% Widowed2.8% DivorcedWomen who did not give birth in the past 12 months Now married:
27.1% (30)Unmarried:
72.9% (81)
Marital status - Two or more races population 15 years and over
Males 62.3% Never married19.7% Now married5.3% Separated0.4% Widowed12.3% DivorcedFemales 58.1% Never married22.0% Now married3.4% Separated7.0% Widowed9.5% DivorcedWomen who gave birth in the past 12 months Now married:
0.0% (0)Unmarried:
100.0% (8)
Women who did not give birth in the past 12 months Now married:
22.1% (156)Unmarried:
77.9% (549)
Marital status - White alone, not Hispanic / Latino population 15 years and over
Males 35.4% Never married41.4% Now married1.4% Separated4.9% Widowed16.8% DivorcedFemales 24.7% Never married44.1% Now married3.0% Separated10.7% Widowed17.5% DivorcedWomen who gave birth in the past 12 months Now married:
48.1% (114)Unmarried:
51.9% (123)
Women who did not give birth in the past 12 months Now married:
45.2% (1,805)Unmarried:
54.8% (2,187)
Marital status - Hispanic or Latino population 15 years and over
Males 41.4% Never married51.6% Now married2.0% Separated0.0% Widowed4.9% DivorcedFemales 41.8% Never married42.0% Now married0.6% Separated7.7% Widowed7.9% DivorcedWomen who gave birth in the past 12 months Now married:
86.7% (26)Unmarried:
13.3% (4)
Women who did not give birth in the past 12 months Now married:
40.2% (140)Unmarried:
59.8% (208)
Ancestries in Granite City
1,561 15.6% German977 9.8% English819 8.2% Irish814 8.1% American389 3.9% Italian294 2.9% Scotch-Irish269 2.7% Polish168 1.7% European102 1.0% French101 1.0% Hungarian56 0.6% Dutch45 0.4% Croatian38 0.4% Canadian33 0.3% Yugoslavian22 0.2% Welsh18 0.2% Czechoslovakian15 0.1% Austrian15 0.1% Dutch West Indian14 0.1% Scottish12 0.1% Scandinavian11 0.1% British11 0.1% Lithuanian11 0.1% Maltese10 0.10% Kenyan9 0.09% Slovak5 0.05% Czech4 0.04% Danish4 0.04% Greek4 0.04% Macedonian3 0.03% Norwegian
Geographical mobility in Granite City Same house 1 year ago 19,420 91.6% White (Caucasian)2,236 94.2% Black or African American20 46.3% American Indian / Alaska Native167 99.4% Asian415 100.0% Other race2,466 96.9% Two or more races18,883 91.3% White alone, not Hispanic / Latino1,533 96.5% Hispanic or LatinoMoved within same county 1,065 5.0% White / Caucasian91 3.8% Black or African American17 40.1% American Indian / Alaska Native30 1.2% Two or more races1,074 5.2% White alone, not Hispanic / Latino23 1.4% Hispanic or LatinoMoved within same state 403 1.9% White / Caucasian46 1.9% Black or African American7 15.7% American Indian / Alaska Native54 2.1% Two or more races386 1.9% White alone, not Hispanic / Latino17 1.1% Hispanic or LatinoMoved from different state 205 1.0% White / Caucasian107 4.5% Black or African American23 0.9% Two or more races213 1.0% White alone, not Hispanic / Latino24 1.5% Hispanic or LatinoMoved from abroad 15 0.1% White18 0.8% Black or African American18 0.1% White alone, not Hispanic / Latino
Children Nativity (place of birth) in Granite City
Children under 6 years - Living with two parents Both parents native 722 100.0% NativeBoth parents foreign-born 33 100.0% NativeOne native, one foreign-born parent 31 100.0% NativeChildren under 6 years - Living with one parent Native parent 748 100.0% NativeForeign-born parent 4 100.0% NativeChildren 6 to 17 years - Living with two parents Both parents native 1,418 100.0% NativeBoth parents foreign-born 41 100.0% NativeOne native, one foreign-born parent 116 100.0% NativeChildren 6 to 17 years - Living with one parent Native parent 1,883 100.0% NativeForeign-born parent 44 54.1% Native37 45.9% Foreign-born
Grandparents responsible for own grandchildren in Granite City
Grandparents (30 to 59 years) White / Caucasian 72 76.0% Responsible for grandchildren23 24.0% Not responsible for grandchildrenBlack or African American 31 80.8% Responsible for grandchildren7 19.2% Not responsible for grandchildrenTwo or more races 39 100.0% Responsible for grandchildrenWhite alone, not Hispanic / Latino 77 76.4% Responsible for grandchildren24 23.6% Not responsible for grandchildrenGrandparents (60 years and over) White / Caucasian 163 73.5% Responsible for grandchildren59 26.5% Not responsible for grandchildrenBlack or African American 23 28.1% Responsible for grandchildren59 71.9% Not responsible for grandchildrenTwo or more races 13 100.0% Not responsible for grandchildrenWhite alone, not Hispanic / Latino 163 73.5% Responsible for grandchildren59 26.5% Not responsible for grandchildren