Races in Greenfield-Panama, California (CA) Detailed Stats
Ancestries, Foreign-born residents, place of birth
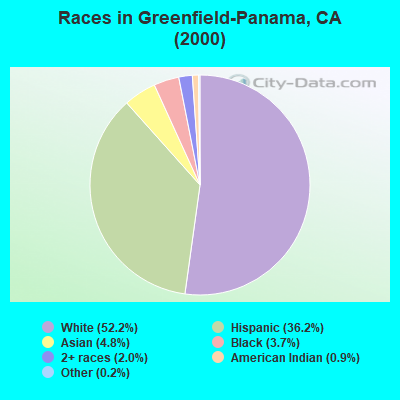
Race distribution in Greenfield-Panama

- 9,17352.2%White alone
- 6,36636.2%Hispanic
- 8384.8%Asian alone
- 6503.7%Black alone
- 3462.0%Two or more races
- 1570.9%American Indian alone
- 290.2%Other race alone
- 80.05%Native Hawaiian and Other
Pacific Islander alone
2000
2022
-
- 15,816,79046.7%White alone
- 10,966,55632.4%Hispanic
- 3,648,86010.8%Asian alone
- 2,181,9266.4%Black alone
- 903,1152.7%Two or more races
- 178,9840.5%American Indian alone
- 103,7360.3%Native Hawaiian and Other
Pacific Islander alone - 71,6810.2%Other race alone

-
- 15,732,18440.3%Hispanic
- 13,160,42633.7%White alone
- 5,957,86715.3%Asian alone
- 2,025,2185.2%Black alone
- 1,663,2224.3%Two or more races
- 251,6180.6%Other race alone
- 135,7770.3%Native Hawaiian and Other
Pacific Islander alone - 103,0300.3%American Indian alone

Income and house value in Greenfield-Panama
- Median household income in 2022
- $99,055White non-Hispanic householders
- $96,288Black householders
- $95,691American Indian and Alaska Native householders
- $134,606Asian householders
- $75,464Some other race householders
- $123,489Two or more races householders
- $75,493Hispanic or Latino race householders
- Median 2022 house value
- $432,275White Non-Hispanic householders
- $384,764Black or African American householders
- $305,940American Indian or Alaska Native householders
- $447,752Asian householders
- $337,254Some other race householders
- $460,709Two or more races householders
- $344,092Hispanic or Latino householders
Household income for White non-Hispanic householders

Household income for Black householders

Household income for American Indian and Alaska Native householders

Household income for Asian householders

Household income for Two or more races householders

Household income for Hispanic or Latino race householders

Zip code: 93313