Races in Greenfield, Wisconsin (WI) Detailed Stats
Data:
Races - White alone (%)
Races - White alone (% change since 2000)
Races - Black alone (%)
Races - Black alone (% change since 2000)
Races - American Indian alone (%)
Races - American Indian alone (% change since 2000)
Races - Asian alone (%)
Races - Asian alone (% change since 2000)
Races - Hispanic (%)
Races - Hispanic (% change since 2000)
Races - Native Hawaiian and Other Pacific Islander alone (%)
Races - Native Hawaiian and Other Pacific Islander alone (% change since 2000)
Races - Two or more races(%)
Races - Two or more races(% change since 2000)
Races - Other race alone (%)
Races - Other race alone (% change since 2000)
Racial diversity
Place of birth - Born in state of residence (%)
Place of birth - Born in state of residence (%) - White
Place of birth - Born in state of residence (%) - Black or African American
Place of birth - Born in state of residence (%) - Asian
Place of birth - Born in state of residence (%) - Hispanic or Latino
Place of birth - Born in state of residence (%) - American Indian and Alaska Native
Place of birth - Born in state of residence (%) - Multirace
Place of birth - Born in state of residence (%) - Other Race
Place of birth - Born in other state (%)
Place of birth - Born in other state (%) - White
Place of birth - Born in other state (%) - Black or African American
Place of birth - Born in other state (%) - Asian
Place of birth - Born in other state (%) - Hispanic or Latino
Place of birth - Born in other state (%) - American Indian and Alaska Native
Place of birth - Born in other state (%) - Multirace
Place of birth - Born in other state (%) - Other Race
Place of birth - Native, outside of US (%)
Place of birth - Native, outside of US (%) - White
Place of birth - Native, outside of US (%) - Black or African American
Place of birth - Native, outside of US (%) - Asian
Place of birth - Native, outside of US (%) - Hispanic or Latino
Place of birth - Native, outside of US (%) - American Indian and Alaska Native
Place of birth - Native, outside of US (%) - Multirace
Place of birth - Native, outside of US (%) - Other Race
Place of birth - Foreign born (%)
Place of birth - Foreign born (%) - White
Place of birth - Foreign born (%) - Black or African American
Place of birth - Foreign born (%) - Asian
Place of birth - Foreign born (%) - Hispanic or Latino
Place of birth - Foreign born (%) - American Indian and Alaska Native
Place of birth - Foreign born (%) - Multirace
Place of birth - Foreign born (%) - Other Race
Residents speaking English at home (%)
Residents speaking English at home - Born in the United States (%)
Residents speaking English at home - Native, born elsewhere (%)
Residents speaking English at home - Foreign born (%)
Residents speaking Spanish at home (%)
Residents speaking Spanish at home - Born in the United States (%)
Residents speaking Spanish at home - Native, born elsewhere (%)
Residents speaking Spanish at home - Foreign born (%)
Residents speaking other language at home (%)
Residents speaking other language at home - Born in the United States (%)
Residents speaking other language at home - Native, born elsewhere (%)
Residents speaking other language at home - Foreign born (%)
Marital status - Never married (%)
Marital status - Now married (%)
Marital status - Separated (%)
Marital status - Widowed (%)
Marital status - Divorced (%)
Ancestries Reported - Arab (%)
Ancestries Reported - Czech (%)
Ancestries Reported - Danish (%)
Ancestries Reported - Dutch (%)
Ancestries Reported - English (%)
Ancestries Reported - French (%)
Ancestries Reported - French Canadian (%)
Ancestries Reported - German (%)
Ancestries Reported - Greek (%)
Ancestries Reported - Hungarian (%)
Ancestries Reported - Irish (%)
Ancestries Reported - Italian (%)
Ancestries Reported - Lithuanian (%)
Ancestries Reported - Norwegian (%)
Ancestries Reported - Polish (%)
Ancestries Reported - Portuguese (%)
Ancestries Reported - Russian (%)
Ancestries Reported - Scotch-Irish (%)
Ancestries Reported - Scottish (%)
Ancestries Reported - Slovak (%)
Ancestries Reported - Subsaharan African (%)
Ancestries Reported - Swedish (%)
Ancestries Reported - Swiss (%)
Ancestries Reported - Ukrainian (%)
Ancestries Reported - United States (%)
Ancestries Reported - Welsh (%)
Ancestries Reported - West Indian (%)
Ancestries Reported - Other (%)
Geographical mobility - Same house 1 year ago (%)
Geographical mobility - Same house 1 year ago (%) - White
Geographical mobility - Same house 1 year ago (%) - Black or African American
Geographical mobility - Same house 1 year ago (%) - Asian
Geographical mobility - Same house 1 year ago (%) - Hispanic or Latino
Geographical mobility - Same house 1 year ago (%) - American Indian and Alaska Native
Geographical mobility - Same house 1 year ago (%) - Multirace
Geographical mobility - Same house 1 year ago (%) - Other Race
Geographical mobility - Moved within same county (%)
Geographical mobility - Moved within same county (%) - White
Geographical mobility - Moved within same county (%) - Black or African American
Geographical mobility - Moved within same county (%) - Asian
Geographical mobility - Moved within same county (%) - Hispanic or Latino
Geographical mobility - Moved within same county (%) - American Indian and Alaska Native
Geographical mobility - Moved within same county (%) - Multirace
Geographical mobility - Moved within same county (%) - Other Race
Geographical mobility - Moved from different county within same state (%)
Geographical mobility - Moved from different county within same state (%) - White
Geographical mobility - Moved from different county within same state (%) - Black or African American
Geographical mobility - Moved from different county within same state (%) - Asian
Geographical mobility - Moved from different county within same state (%) - Hispanic or Latino
Geographical mobility - Moved from different county within same state (%) - American Indian and Alaska Native
Geographical mobility - Moved from different county within same state (%) - Multirace
Geographical mobility - Moved from different county within same state (%) - Other Race
Geographical mobility - Moved from different state (%)
Geographical mobility - Moved from different state (%) - White
Geographical mobility - Moved from different state (%) - Black or African American
Geographical mobility - Moved from different state (%) - Asian
Geographical mobility - Moved from different state (%) - Hispanic or Latino
Geographical mobility - Moved from different state (%) - American Indian and Alaska Native
Geographical mobility - Moved from different state (%) - Multirace
Geographical mobility - Moved from different state (%) - Other Race
Geographical mobility - Moved from abroad (%)
Geographical mobility - Moved from abroad (%) - White
Geographical mobility - Moved from abroad (%) - Black or African American
Geographical mobility - Moved from abroad (%) - Asian
Geographical mobility - Moved from abroad (%) - Hispanic or Latino
Geographical mobility - Moved from abroad (%) - American Indian and Alaska Native
Geographical mobility - Moved from abroad (%) - Multirace
Geographical mobility - Moved from abroad (%) - Other Race
Place of birth for the foreign-born population - Ireland (%)
Place of birth for the foreign-born population - Denmark (%)
Place of birth for the foreign-born population - Norway (%)
Place of birth for the foreign-born population - Sweden (%)
Place of birth for the foreign-born population - United Kingdom (%)
Place of birth for the foreign-born population - England (%)
Place of birth for the foreign-born population - Scotland (%)
Place of birth for the foreign-born population - Other Northern Europe (%)
Place of birth for the foreign-born population - Austria (%)
Place of birth for the foreign-born population - Belgium (%)
Place of birth for the foreign-born population - France (%)
Place of birth for the foreign-born population - Germany (%)
Place of birth for the foreign-born population - Netherlands (%)
Place of birth for the foreign-born population - Switzerland (%)
Place of birth for the foreign-born population - Other Western Europe (%)
Place of birth for the foreign-born population - Greece (%)
Place of birth for the foreign-born population - Italy (%)
Place of birth for the foreign-born population - Portugal (%)
Place of birth for the foreign-born population - Spain (%)
Place of birth for the foreign-born population - Other Southern Europe (%)
Place of birth for the foreign-born population - Albania (%)
Place of birth for the foreign-born population - Belarus (%)
Place of birth for the foreign-born population - Bosnia and Herzegovina (%)
Place of birth for the foreign-born population - Bulgaria (%)
Place of birth for the foreign-born population - Croatia (%)
Place of birth for the foreign-born population - Czechoslovakia (%)
Place of birth for the foreign-born population - Hungary (%)
Place of birth for the foreign-born population - Latvia (%)
Place of birth for the foreign-born population - Lithuania (%)
Place of birth for the foreign-born population - North Macedonia (Macedonia) (%)
Place of birth for the foreign-born population - Moldova (%)
Place of birth for the foreign-born population - Poland (%)
Place of birth for the foreign-born population - Romania (%)
Place of birth for the foreign-born population - Russia (%)
Place of birth for the foreign-born population - Serbia (%)
Place of birth for the foreign-born population - Ukraine (%)
Place of birth for the foreign-born population - Other Eastern Europe (%)
Place of birth for the foreign-born population - China (%)
Place of birth for the foreign-born population - Hong Kong (%)
Place of birth for the foreign-born population - Taiwan (%)
Place of birth for the foreign-born population - Japan (%)
Place of birth for the foreign-born population - Korea (%)
Place of birth for the foreign-born population - Other Eastern Asia (%)
Place of birth for the foreign-born population - Afghanistan (%)
Place of birth for the foreign-born population - Bangladesh (%)
Place of birth for the foreign-born population - India (%)
Place of birth for the foreign-born population - Iran (%)
Place of birth for the foreign-born population - Kazakhstan (%)
Place of birth for the foreign-born population - Nepal (%)
Place of birth for the foreign-born population - Pakistan (%)
Place of birth for the foreign-born population - Sri Lanka (%)
Place of birth for the foreign-born population - Uzbekistan (%)
Place of birth for the foreign-born population - Other South Central Asia (%)
Place of birth for the foreign-born population - Burma (%)
Place of birth for the foreign-born population - Cambodia (%)
Place of birth for the foreign-born population - Indonesia (%)
Place of birth for the foreign-born population - Laos (%)
Place of birth for the foreign-born population - Malaysia (%)
Place of birth for the foreign-born population - Philippines (%)
Place of birth for the foreign-born population - Singapore (%)
Place of birth for the foreign-born population - Thailand (%)
Place of birth for the foreign-born population - Vietnam (%)
Place of birth for the foreign-born population - Other South Eastern Asia (%)
Place of birth for the foreign-born population - Armenia (%)
Place of birth for the foreign-born population - Iraq (%)
Place of birth for the foreign-born population - Israel (%)
Place of birth for the foreign-born population - Jordan (%)
Place of birth for the foreign-born population - Kuwait (%)
Place of birth for the foreign-born population - Lebanon (%)
Place of birth for the foreign-born population - Saudi Arabia (%)
Place of birth for the foreign-born population - Syria (%)
Place of birth for the foreign-born population - Turkey (%)
Place of birth for the foreign-born population - Yemen (%)
Place of birth for the foreign-born population - Other Western Asia (%)
Place of birth for the foreign-born population - Eritrea (%)
Place of birth for the foreign-born population - Ethiopia (%)
Place of birth for the foreign-born population - Kenya (%)
Place of birth for the foreign-born population - Somalia (%)
Place of birth for the foreign-born population - Uganda (%)
Place of birth for the foreign-born population - Zimbabwe (%)
Place of birth for the foreign-born population - Other Eastern Africa (%)
Place of birth for the foreign-born population - Cameroon (%)
Place of birth for the foreign-born population - Congo (%)
Place of birth for the foreign-born population - Democratic Republic of Congo (Zaire) (%)
Place of birth for the foreign-born population - Other Middle Africa (%)
Place of birth for the foreign-born population - Egypt (%)
Place of birth for the foreign-born population - Morocco (%)
Place of birth for the foreign-born population - Sudan (%)
Place of birth for the foreign-born population - Other Northern Africa (%)
Place of birth for the foreign-born population - South Africa (%)
Place of birth for the foreign-born population - Other Southern Africa (%)
Place of birth for the foreign-born population - Cabo Verde (%)
Place of birth for the foreign-born population - Ghana (%)
Place of birth for the foreign-born population - Liberia (%)
Place of birth for the foreign-born population - Nigeria (%)
Place of birth for the foreign-born population - Senegal (%)
Place of birth for the foreign-born population - Sierra Leone (%)
Place of birth for the foreign-born population - Other Western Africa (%)
Place of birth for the foreign-born population - Australia (%)
Place of birth for the foreign-born population - New Zealand (%)
Place of birth for the foreign-born population - Fiji (%)
Place of birth for the foreign-born population - Micronesia (%)
Place of birth for the foreign-born population - Bahamas (%)
Place of birth for the foreign-born population - Barbados (%)
Place of birth for the foreign-born population - Cuba (%)
Place of birth for the foreign-born population - Dominica (%)
Place of birth for the foreign-born population - Dominican Republic (%)
Place of birth for the foreign-born population - Grenada (%)
Place of birth for the foreign-born population - Haiti (%)
Place of birth for the foreign-born population - Jamaica (%)
Place of birth for the foreign-born population - St. Vincent and the Grenadines (%)
Place of birth for the foreign-born population - Trinidad and Tobago (%)
Place of birth for the foreign-born population - West Indies (%)
Place of birth for the foreign-born population - Other Caribbean (%)
Place of birth for the foreign-born population - Belize (%)
Place of birth for the foreign-born population - Costa Rica (%)
Place of birth for the foreign-born population - El Salvador (%)
Place of birth for the foreign-born population - Guatemala (%)
Place of birth for the foreign-born population - Honduras (%)
Place of birth for the foreign-born population - Mexico (%)
Place of birth for the foreign-born population - Nicaragua (%)
Place of birth for the foreign-born population - Panama (%)
Place of birth for the foreign-born population - Other Central America (%)
Place of birth for the foreign-born population - Argentina (%)
Place of birth for the foreign-born population - Bolivia (%)
Place of birth for the foreign-born population - Brazil (%)
Place of birth for the foreign-born population - Chile (%)
Place of birth for the foreign-born population - Colombia (%)
Place of birth for the foreign-born population - Ecuador (%)
Place of birth for the foreign-born population - Guyana (%)
Place of birth for the foreign-born population - Peru (%)
Place of birth for the foreign-born population - Uruguay (%)
Place of birth for the foreign-born population - Venezuela (%)
Place of birth for the foreign-born population - Other South America (%)
Place of birth for the foreign-born population - Canada (%)
Place of birth for the foreign-born population - Other Northern America (%)
Place of birth for the foreign-born population - Other (%)
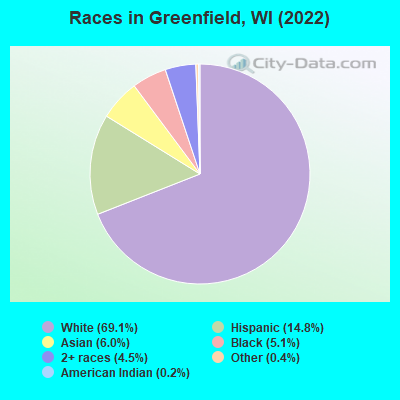
According to 2022 data, the most numerous races in Greenfield, WI are White alone (25,519 residents), Hispanic (5,466 residents), and Black alone (1,889 residents). 82.3% of Greenfield residents speak English at home. 10.7% of Greenfield, WI residents are foreign-born (4.5% born in Asia, 2.8% born in Latin America, 2.2% born in Europe), which is 53.1% greater than the foreign-born rate of 5.0% across the entire state of Wisconsin.
Race distribution in Greenfield
2000 2022
4,681,630 87.3% White alone 300,245 5.6% Black alone 192,921 3.6% Hispanic 87,995 1.6% Asian alone 51,921 1.0% Two or more races 43,980 0.8% American Indian alone 3,637 0.07% Other race alone 1,346 0.03% Native Hawaiian and Other
4,654,031 79.0% White alone 447,022 7.6% Hispanic 345,678 5.9% Black alone 217,532 3.7% Two or more races 172,242 2.9% Asian alone 33,762 0.6% American Indian alone 19,680 0.3% Other race alone 2,592 0.04% Native Hawaiian and Other
Income and house value in Greenfield Median household income in 2022 $68,174 White non-Hispanic householders$45,264 Black householders$80,757 American Indian and Alaska Native householders$102,782 Asian householders$50,252 Some other race householders$60,371 Two or more races householders$61,701 Hispanic or Latino race householdersMedian 2022 house value $258,723 White Non-Hispanic householders$345,999 Black or African American householders$465,330 American Indian or Alaska Native householders $294,089 Asian householders$178,480 Some other race householders$205,572 Two or more races householders$243,212 Hispanic or Latino householders
Median age by race in Greenfield
50.8 Median age for White residents47.3 55.4 33.3 Median age for Black or African American residents33.7 33.3 52.7 Median age for American Indian / Alaska Native residents54.2 47.7 34.4 Median age for Asian residents32.1 36.1 -825,688,072.6 Median age for Native Hawaiian / Pacific Islander residents-862,745,097.2 -732,444,443.7 42.6 Median age for Other race residents34.0 49.0 29.6 Median age for Two or more races residents32.3 23.1 51.3 Median age for White alone residents47.8 55.6 32.6 Median age for Hispanic or Latino residents32.2 34.1
Owner/renter occupied households by race in Greenfield
House owners and renters - White residents 8,502 63.3% Owner occupied4,932 36.7% Renter occupiedHouse owners and renters - Black or African American residents 230 20.1% Owner occupied913 79.9% Renter occupiedHouse owners and renters - American Indian / Alaska Native residents 32 58.4% Owner occupied23 41.6% Renter occupiedHouse owners and renters - Asian residents 373 52.1% Owner occupied343 47.9% Renter occupiedHouse owners and renters - Native Hawaiian / Pacific Islander residents 5 100.0% Renter occupiedHouse owners and renters - Other race residents 122 25.6% Owner occupied356 74.4% Renter occupiedHouse owners and renters - Two or more races residents 664 35.6% Owner occupied1,202 64.4% Renter occupiedHouse owners and renters - White alone residents 8,503 63.4% Owner occupied4,900 36.6% Renter occupiedHouse owners and renters - Hispanic or Latino residents 623 30.0% Owner occupied1,454 70.0% Renter occupied
Language usage in Greenfield
English speakers - Total 82.3% of residents of Greenfield speak English at home.
9.0% of residents speak Spanish at home 1,760 55.9% Speak English very well1,389 44.1% Speak English less than very well8.9% of residents speak other language at home 1,985 63.8% Speak English very well1,128 36.2% Speak English less than very well
English speakers - Born in the United States 84.3% of residents of Greenfield speak English at home.
10.7% of residents speak Spanish at home 599 97.2% Speak English very well17 2.8% Speak English less than very well5.5% of residents speak other language at home 270 84.9% Speak English very well48 15.1% Speak English less than very well
English speakers - Native, born elsewhere 32.5% of residents of Greenfield speak English at home.
69.8% of residents speak Spanish at home 285 44.0% Speak English very well362 56.0% Speak English less than very well1.0% of residents speak other language at home 9 100.0% Speak English very well
English speakers - Foreign-born 21.3% of residents of Greenfield speak English at home.
24.5% of residents speak Spanish at home 246 24.9% Speak English very well742 75.1% Speak English less than very well53.7% of residents speak other language at home 1,088 50.2% Speak English very well1,081 49.8% Speak English less than very well
White (Caucasian) - Speak only English Native:
97.7% (23,103)Foreign-born:
42.7% (404)
White (Caucasian) - Speak another language Native:
2.9% (688)Foreign-born:
61.6% (583)
Black or African American - Speak only English Native:
92.0% (1,593)Foreign-born:
85.3% (111)
Black or African American - Speak another language Native:
5.1% (88)Foreign-born:
8.0% (10)
American Indian / Alaska Native - Speak another language Native:
5.7% (7)Foreign-born:
100.0% (5)
Asian - Speak only English Native:
47.0% (317)Foreign-born:
11.2% (157)
Asian - Speak another language Native:
52.8% (356)Foreign-born:
89.0% (1,252)
Other race - Speak only English Native:
63.3% (581)Foreign-born:
4.4% (9)
Other race - Speak another language Native:
42.6% (391)Foreign-born:
92.4% (192)
Two or more races - Speak only English Native:
61.6% (2,378)Foreign-born:
10.3% (96)
Two or more races - Speak another language Native:
33.4% (1,292)Foreign-born:
88.9% (825)
White alone - Speak only English Native:
97.4% (22,759)Foreign-born:
38.1% (410)
White alone - Speak another language Native:
2.6% (599)Foreign-born:
61.3% (659)
Hispanic or Latino - Speak only English Native:
51.4% (2,043)Foreign-born:
8.7% (96)
Hispanic or Latino - Speak another language Native:
48.9% (1,946)Foreign-born:
91.7% (1,010)
Foreign-born residents in Greenfield 3,940 residents are foreign born (4.5% Asia , 2.8% Latin America , 2.2% Europe ).
This city:
10.7%Wisconsin:
5.0%
Marital status for residents in Greenfield Marital status - White (Caucasian) population 15 years and over
Males 33.6% Never married49.7% Now married0.3% Separated2.9% Widowed13.5% DivorcedFemales 25.6% Never married44.9% Now married0.8% Separated13.5% Widowed15.2% DivorcedWomen who gave birth in the past 12 months Now married:
96.8% (226)Unmarried:
3.2% (7)
Women who did not give birth in the past 12 months Now married:
45.6% (2,047)Unmarried:
54.4% (2,443)
Marital status - Black or African American population 15 years and over
Males 58.0% Never married32.6% Now married2.9% Separated0.0% Widowed6.4% DivorcedFemales 60.2% Never married33.0% Now married1.9% Separated1.3% Widowed3.7% DivorcedWomen who did not give birth in the past 12 months Now married:
31.9% (210)Unmarried:
68.1% (448)
Marital status - American Indian / Alaska Native population 15 years and over
Males 30.3% Never married62.9% Now married0.0% Separated0.0% Widowed6.7% DivorcedFemales 0.0% Never married62.8% Now married0.0% Separated0.0% Widowed37.2% DivorcedWomen who did not give birth in the past 12 months Now married:
100.0% (37)Unmarried:
0.0% (0)
Marital status - Asian population 15 years and over
Males 43.2% Never married54.5% Now married0.0% Separated1.4% Widowed0.9% DivorcedFemales 35.3% Never married51.4% Now married0.9% Separated5.2% Widowed7.1% DivorcedWomen who gave birth in the past 12 months Now married:
100.0% (33)Unmarried:
0.0% (0)
Women who did not give birth in the past 12 months Now married:
42.3% (268)Unmarried:
57.7% (365)
Marital status - Native Hawaiian / Pacific Islander population 15 years and over
Males 100.0% Never married0.0% Now married0.0% Separated0.0% Widowed0.0% DivorcedFemales 0.0% Never married100.0% Now married0.0% Separated0.0% Widowed0.0% DivorcedWomen who did not give birth in the past 12 months Now married:
100.0% (3)Unmarried:
0.0% (0)
Marital status - Other race population 15 years and over
Males 51.3% Never married34.4% Now married1.5% Separated10.6% Widowed2.2% DivorcedFemales 60.0% Never married25.0% Now married0.0% Separated1.7% Widowed13.4% DivorcedWomen who gave birth in the past 12 months Now married:
0.0% (0)Unmarried:
100.0% (7)
Women who did not give birth in the past 12 months Now married:
32.1% (122)Unmarried:
67.9% (259)
Marital status - Two or more races population 15 years and over
Males 45.8% Never married47.4% Now married1.4% Separated0.9% Widowed4.4% DivorcedFemales 60.0% Never married27.5% Now married1.2% Separated0.6% Widowed10.7% DivorcedWomen who gave birth in the past 12 months Now married:
10.4% (8)Unmarried:
89.6% (70)
Women who did not give birth in the past 12 months Now married:
27.3% (448)Unmarried:
72.7% (1,196)
Marital status - White alone, not Hispanic / Latino population 15 years and over
Males 33.5% Never married49.4% Now married0.4% Separated3.0% Widowed13.8% DivorcedFemales 25.3% Never married44.7% Now married0.7% Separated13.8% Widowed15.4% DivorcedWomen who gave birth in the past 12 months Now married:
96.7% (226)Unmarried:
3.3% (8)
Women who did not give birth in the past 12 months Now married:
44.5% (1,931)Unmarried:
55.5% (2,411)
Marital status - Hispanic or Latino population 15 years and over
Males 52.8% Never married38.7% Now married0.6% Separated4.9% Widowed3.0% DivorcedFemales 51.6% Never married33.2% Now married1.4% Separated2.5% Widowed11.4% DivorcedWomen who gave birth in the past 12 months Now married:
32.7% (19)Unmarried:
67.3% (38)
Women who did not give birth in the past 12 months Now married:
38.3% (607)Unmarried:
61.7% (980)
Ancestries in Greenfield
3,458 19.1% German1,974 10.9% Polish585 3.2% Irish547 3.0% American509 2.8% Norwegian508 2.8% European380 2.1% Italian373 2.1% English224 1.2% Serbian159 0.9% Greek143 0.8% Czech115 0.6% Egyptian107 0.6% Slovene104 0.6% Jordanian89 0.5% Moroccan75 0.4% Swedish63 0.3% Palestinian62 0.3% Croatian60 0.3% Arab60 0.3% Scottish59 0.3% Austrian56 0.3% Nigerian52 0.3% Yugoslavian43 0.2% French Canadian40 0.2% French39 0.2% Slovak35 0.2% Dutch30 0.2% Czechoslovakian26 0.1% Danish25 0.1% Scotch-Irish17 0.09% Belgian16 0.09% Finnish16 0.09% Hungarian15 0.08% Eastern European14 0.08% Ukrainian13 0.07% British10 0.06% Scandinavian10 0.06% Albanian9 0.05% Russian8 0.04% Lebanese7 0.04% Swiss6 0.03% Romanian6 0.03% African5 0.03% Assyrian
Geographical mobility in Greenfield Same house 1 year ago 22,637 88.8% White (Caucasian)1,311 68.1% Black or African American170 97.3% American Indian / Alaska Native2,003 90.9% Asian9 100.0% Native Hawaiian / Pacific Islander682 59.4% Other race4,571 84.9% Two or more races22,561 89.2% White alone, not Hispanic / Latino4,312 80.9% Hispanic or LatinoMoved within same county 1,851 7.3% White / Caucasian525 27.3% Black or African American6 3.2% American Indian / Alaska Native84 3.8% Asian521 45.3% Other race706 13.1% Two or more races1,726 6.8% White alone, not Hispanic / Latino813 15.3% Hispanic or LatinoMoved within same state 653 2.6% White / Caucasian113 5.9% Black or African American35 1.6% Asian4 0.3% Other race53 1.0% Two or more races647 2.6% White alone, not Hispanic / Latino16 0.3% Hispanic or LatinoMoved from different state 283 1.1% White / Caucasian8 0.4% Black or African American16 0.7% Asian23 2.0% Other race277 1.1% White alone, not Hispanic / Latino43 0.8% Hispanic or LatinoMoved from abroad 9 0.0% White70 3.2% Asian8 0.7% Other race12 0.0% White alone, not Hispanic / Latino13 0.2% Hispanic or Latino
Children Nativity (place of birth) in Greenfield
Children under 6 years - Living with two parents Both parents native 1,192 100.0% NativeBoth parents foreign-born 321 81.9% Native71 18.1% Foreign-bornOne native, one foreign-born parent 171 100.0% NativeChildren under 6 years - Living with one parent Native parent 444 100.0% NativeForeign-born parent 9 100.0% NativeChildren 6 to 17 years - Living with two parents Both parents native 1,743 100.0% NativeBoth parents foreign-born 488 74.7% Native165 25.3% Foreign-bornOne native, one foreign-born parent 208 100.0% NativeChildren 6 to 17 years - Living with one parent Native parent 1,235 100.0% NativeForeign-born parent 133 48.9% Native139 51.1% Foreign-born
Grandparents responsible for own grandchildren in Greenfield
Grandparents (30 to 59 years) White / Caucasian 40 47.0% Responsible for grandchildren45 53.0% Not responsible for grandchildrenAmerican Indian / Alaska Native 12 100.0% Responsible for grandchildrenWhite alone, not Hispanic / Latino 54 68.4% Responsible for grandchildren25 31.6% Not responsible for grandchildrenHispanic or Latino 15 50.5% Responsible for grandchildren14 49.5% Not responsible for grandchildrenGrandparents (60 years and over) White / Caucasian 46 30.8% Responsible for grandchildren104 69.2% Not responsible for grandchildrenWhite alone, not Hispanic / Latino 51 31.5% Responsible for grandchildren111 68.5% Not responsible for grandchildrenHispanic or Latino 21 77.6% Responsible for grandchildren6 22.4% Not responsible for grandchildren