Races in Groveland, Massachusetts (MA) Detailed Stats
Ancestries, Foreign-born residents, place of birth

Recent posts about races in Groveland, Massachusetts on our local forum with over 2,400,000 registered users:

3.8% of Groveland, MA residents are foreign-born (2.5% born in Europe, 0.6% born in Latin America, 0.4% born in North America), which is 370.5% less than the foreign-born rate of 18.0% across the entire state of Massachusetts.
Race distribution in Groveland

- 5,91898.0%White alone
- 360.6%Asian alone
- 280.5%Hispanic
- 250.4%Two or more races
- 210.3%Black alone
- 80.1%American Indian alone
- 20.03%Other race alone

2000
2022
-
- 5,198,35981.9%White alone
- 428,7296.8%Hispanic
- 318,3295.0%Black alone
- 236,7863.7%Asian alone
- 110,3381.7%Two or more races
- 43,5860.7%Other race alone
- 11,2640.2%American Indian alone
- 1,7060.03%Native Hawaiian and Other
Pacific Islander alone

-
- 4,676,62767.0%White alone
- 911,03813.0%Hispanic
- 501,4637.2%Asian alone
- 459,7406.6%Black alone
- 341,8894.9%Two or more races
- 84,4031.2%Other race alone
- 5,8380.08%American Indian alone
- 9760.01%Native Hawaiian and Other
Pacific Islander alone

Income and house value in Groveland
- Median household income in 2022
- $130,188White non-Hispanic householders
- $88,296Black householders
- $24,288American Indian and Alaska Native householders
- Median 2022 house value
- $628,544White Non-Hispanic householders
- $315,957Black or African American householders
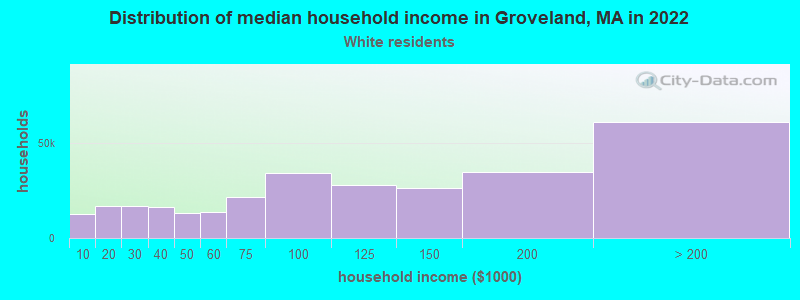
Household income for White non-Hispanic householders
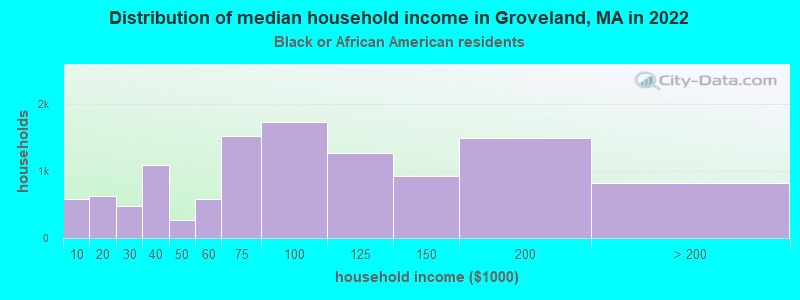
Household income for Black householders
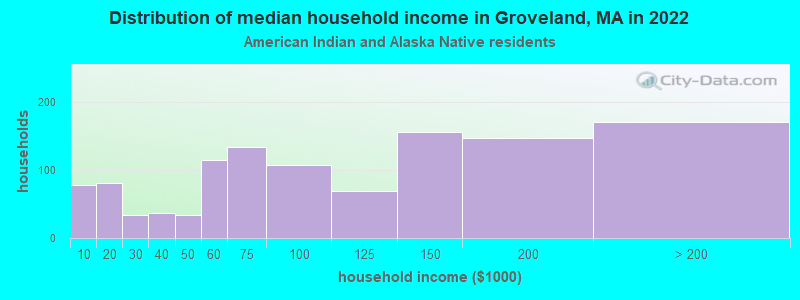
Household income for American Indian and Alaska Native householders
Foreign-born residents in Groveland
231 residents are foreign born (2.5% Europe, 0.6% Latin America, 0.4% North America).
| This city: | 3.8% |
| Massachusetts: | 12.2% |
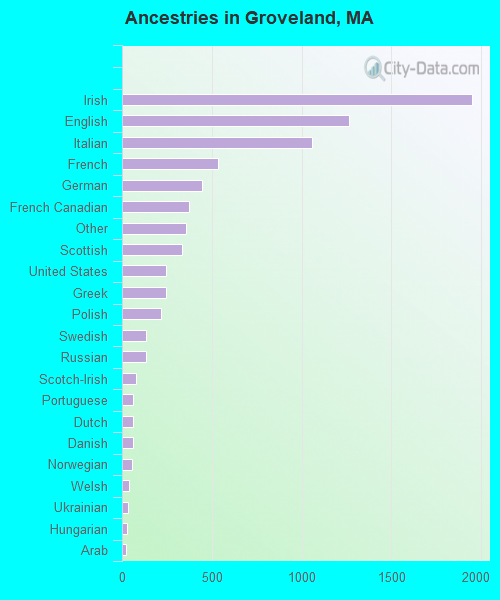
Ancestries in Groveland

- 1,94625.0%Irish
- 1,26316.3%English
- 1,05913.6%Italian
- 5366.9%French
- 4465.7%German
- 3714.8%French Canadian
- 3554.6%Other
- 3354.3%Scottish
- 2463.2%United States
- 2433.1%Greek
- 2162.8%Polish
- 1341.7%Swedish
- 1331.7%Russian
- 781.0%Scotch-Irish
- 640.8%Portuguese
- 620.8%Dutch
- 590.8%Danish
- 580.7%Norwegian
- 380.5%Welsh
- 360.5%Ukrainian
- 260.3%Hungarian
- 200.3%Arab
- 170.2%Swiss
- 140.2%West Indian
- 80.1%Czech
- 80.1%Slovak
Zip codes: 01834.